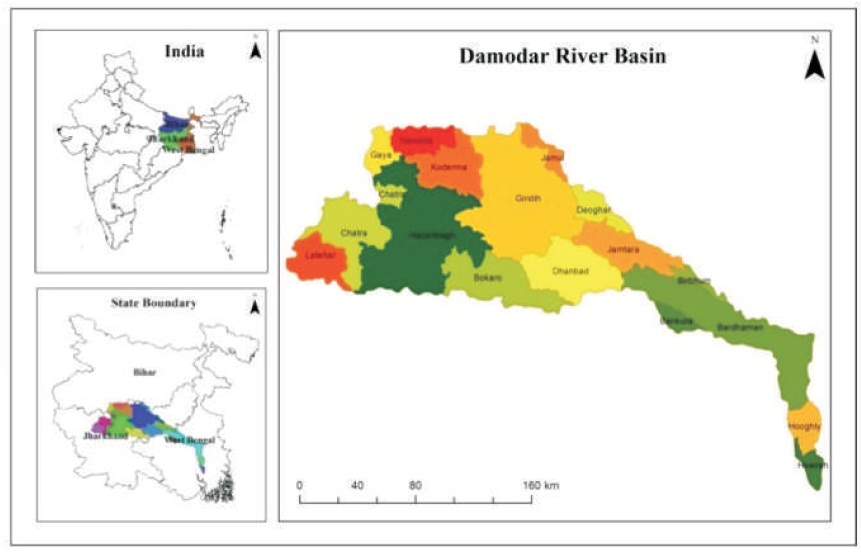
Figure 1. Location Map of Damodar River Basin
Flood is a natural hazard occurring on the Earth's surface when water overflows the bank and spreads over the flood plain causing harm to the residents, crops, and vegetation. GIS, Remote Sensing, and Modelling technology are used in formulating models for flood hazard monitoring, risk analysis, and identification of flood risk zones for the planning and management of this natural hazard. The flood risk assessment of Damodar River Basin lying in districts of Jharkhand, Bihar and West Bengal in India, was prepared using multi-criteria analysis involving the weighted overlay of LU/LC, drainage density, soil, rainfall, slope, and geological parameters. The total area of 23,370.98 sq.km is divided into four flood risk zones, namely no flood risk, low flood risk, moderate flood risk, and high flood risk zone. According to the final output flood risk map no risk zone covers 6,472.19 sq.km (27.69%), low risk zone covers 3,341.02 sq.km (14.30%), moderate risk zone covers 12,647.48 sq.km (54.12%), and high risk zone covers 910.29 sq.km (3.89%) of area. According to the evaluated statistics 40% of the total area of Bihar in the study area comes under no risk zone. A major area of low flood risk zone is present in Jharkhand, which is 15.80% of the total area of Jharkhand in the study area, whereas in Bihar it comprises 6.23% of its total area in the study area and in West Bengal it covers 11.02% of its total area in the study area. In West Bengal, 68.63% and 20.35% of the total area of West Bengal in the study area comes under moderate flood risk and high flood risk zone, respectively.
Natural disasters occurring all over the world have a significant impact on the regional and global environment and economy, however; their distribution around the globe varies regarding type, frequency, and impact (Renyi & Nan, 2002). Flooding is a temporary condition of partial or complete inundation of normally dry areas from overflow of inland or tidal waters or from unusual and rapid accumulation or runoff (Jeb & Aggarwal, 2008). Flood is ranked "first" out of sixteen natural disaster types in the world (">Lingadevaru & Govindaraju, n.d.). Floods can also be caused by anthropogenic activities and human interventions in the natural processes (Balabanova & Vassilev, 2010; Lingadevaru & Govindaraju, n.d.). There are several types of floods, such as riverine flooding, flash flood, urban drainage, ground failures, fluctuating lake level, coastal flooding, and erosion (Ali et al., 2016). In India, floods occur due to intense rainfall in the comparatively small catchments of many rivers, especially in the sub-mountainous or plateau sharp regions, causing flash floods and destruction in their floodplains, (Ghosh, 2013; Singh & Sharma, 2009). As the bulk of summer monsoon rainfall occurs within a period of four - five months (June - October), naturally the majority of flood occurs in the Indian rivers during this season only (Dhar & Nandargi, 2003; Kale, 1998). Damodar River in eastern India is one of the flood prone rivers and is renowned as 'Sorrow of Bengal' due to its havoc destruction and flood power (Choudhury, 1995; Saha, 2005). Great floods of Damodar were recorded in the year 1770, 1855, 1866, 1873-74, 1875-76, 1884-85, 1891-92, 1897, 1900, 1907, 1913, 1927, 1930, 1935, 1943, 1956, 1970, 1978, 2000, 2005, 2007, 2011, 2013, and 2015, where huge loss of life and destruction of property was reported.
The study area is Damodar River Basin (DRB) which is a sub-basin and part of the Ganges River Basin spreading over an area of about 23,370.98 sq.km in which area of about 19,000 sq.km are on uplands and 3,000 sq.km in plains being deltaic in nature. The entire Damodar River Basin covers the state of Jharkhand and West Bengal and some parts of Bihar in India (Figure 1). It originates from Chandwa, Latehar, Chota Nagpur Plateau and river mouth being Hooghly River, Howrah district, West Bengal. Its average rate of discharge is 296 m3/s (10,500 Cu ft/s). The geographical extremity lies between 22°15' N to 24°30' N latitude and 84°30' E to 88°15' E longitude. The river basin travels conjointly over four districts of West Bengal that are Bankura, Burdwan, Hooghly, and Howrah, nine districts of Jharkhand that are Latehar, Chatra, Hazaribagh, Koderma, Bokaro, Giridih, Dhanbad, Deogarh, and Jamtara and three districts of Bihar, namely Gaya, Nawada, and Jamui.
Figure 1. Location Map of Damodar River Basin
The study of flood risk assessment on Damodar River Basin includes the use of different data and software. The data used in the study are listed in (Table 1) and the software used during the study are listed in (Table 2).
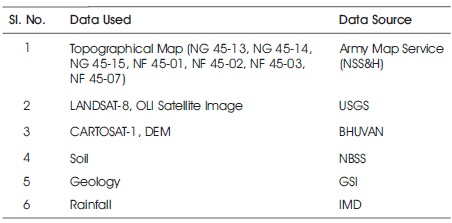
Table 1. List of Data used in the Study Area
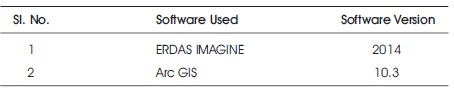
Table 2. List of Software used in the Study Area
The flood risk assessment mapping of Damodar River Basin includes the collection of the data listed in (Table 1). The base map was prepared from Topographical Maps prepared by Army Map Service (AMS) on a scale of 1:250000, according to Traverse Mercator Projection and Everest Spheroid. The rainfall distribution map was prepared according to the annual rainfall data collected from the Indian Meteorological Department (http://www.imd.gov.in), soil map collected from National Bureau of Soil Survey (NBSS) of scale 1:250000, and geology map collected from the Geological Survey of India (GSI). CARTOSAT-1, DEM of spatial resolution 30 m and 1:250000 scale collected from Bhuvan (http://bhuvan.nrsc. gov.in/ bhuvan_links.php) was used to prepare the slope, hill shade, contours, and drainage map in Arc GIS 10.3 using Spatial Analyst Tool. Satellite images of Landsat 8, OLI sensors from (https://earthexplorer.usgs.gov/) of spatial resolution 30 m, spectral resolution of 11 bands and 1:50000 scale (Geo-coded with UTM projection, spheroid, and datum WGS 84, Zone 45 North) has been used to prepare thematic maps such as LU/LC using an unsupervised classification by K-means in Erdas Imagine 2014. All thematic maps were converted to raster and all raster data were reclassified into the different number of classes. The flood risk zones were obtained by overlaying all thematic maps in terms of the weighted overlay analysis using a spatial analyst tool in Arc GIS 10.3, where a ranking was assigned to each parameter of each thematic map (Figure 2).
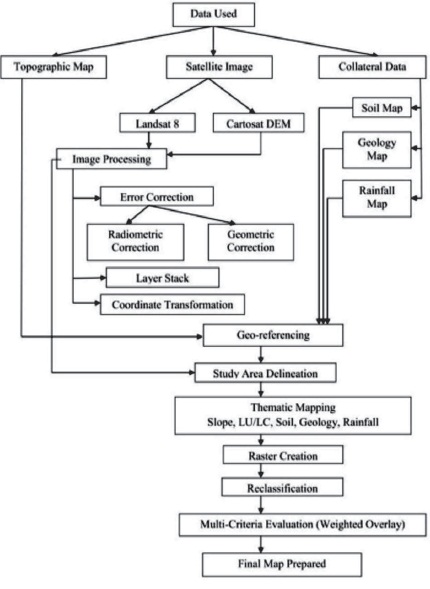
Figure 2. Methodological Flowchart
LU/LC map of the study area 23370.98 sq.km was prepared from the Landsat-8 OLI satellite image using K-means unsupervised classification and classifying the area into forest, vegetation, settlement, river, agricultural land, agricultural fallow land, barren land, river, roads, and railways (Figure 3). A major area of forest is found in North West direction of the study area that is in Gaya and Nawada district with minor patches in South West and South East of the study area, which comes under the districts of Jharkhand. Districts of West Bengal, which are in South East direction is covered with vegetation and agricultural land. The agricultural fallow land is spread all over the districts of Jharkhand in the study area. Settlement in Jharkhand and West Bengal are found in the southern part of the study area. The total area of different LU/LC classes in the entire study area is shown in Table 3.
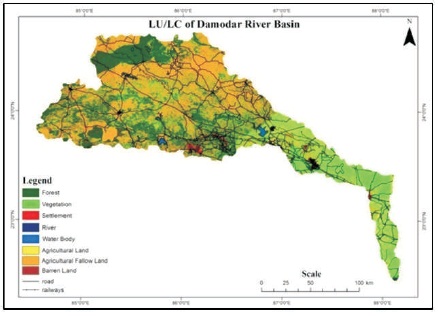
Figure 3. LU/LC of Damodar River Basin
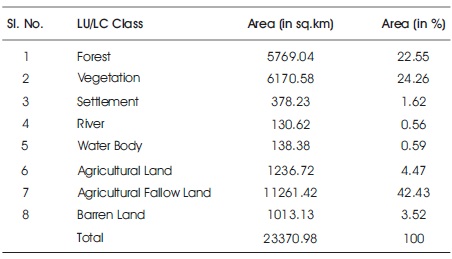
Table 3. Area of Different LU/LC Classes in sq.km and % of Area
The Damodar river basin contains eight different types of geology that are Archean, basic intrusive, Gondwana formation, Gondwana, mica schist, Phyllite, recent alluvium, Singhbhum granite, and tertiary gravels (Figure 4). Recent Alluvium and Archean present in districts of West Bengal influence the flood hazard zone. Mica Schist, Phyllite, Quartzite, and Basic Intrusive found in districts of Bihar and Jharkhand influence to no flood hazard zone.
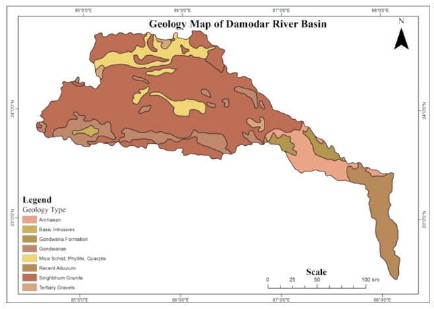
Figure 4. Geology Map of Damodar River Basin
Ten different types of soil are found in Damodar River Basin, namely red gravelly, laterite soil, brown-red soil, loamy soil, red, yellow soil, red sandy soil, coarse-loamy, older alluvial soil and alluvial soil, and buried laterite soil (Figure 5). Alluvial soil, laterite soil, brown and red soil, loamy soil present in the districts of West Bengal influence to high risk during flooding. Red and yellow soil, buried laterite soil, coarse loamy soil in the districts of Jharkhand and West Bengal are influenced to low and moderate flooding hazard whereas red sandy soil, red gravelly soil, brown and red soil, loamy soil, coarse loamy soil, older alluvium soil in the districts of Bihar and Jharkhand influence to no flood hazard.
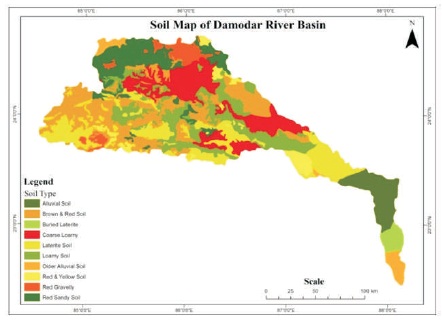
Figure 5. Soil Map of Damodar River Basin
The drainage density of Damodar river basin varies between 0-144.46 km/sq.km (Figure 6). Some areas of Barddhaman, Bankura, Birbhum, Hooghly, Dhanbad, Deoghar, Bokaro, Jamtara, Deoghar, Giridih, Hazaribagh, Chatra, Koderma, Gaya, and Nawada have a high drainage density, whereas low drainage density is found in Bankura, Birrhbhum, Howrah, and Hooghly, Barddhaman and on the boundary of Damodar River Basin. High drainage density indicates low flood risk and low drainage density indicates high flood risk.
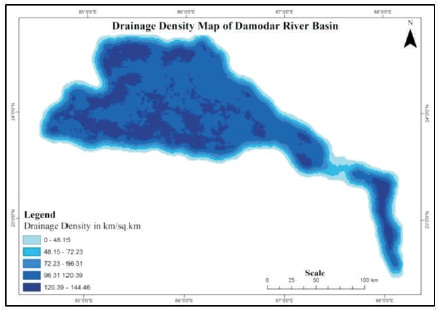
Figure 6. Drainage Density Map of Damodar River Basin
The elevation of Damodar River Basin at different locations ranges between 0 m-1300 m, whereas the elevation of the districts of Bihar and Jharkhand in the study area ranges between 51 m-1300 m and elevation of districts of West Bengal in the study area is below 50 m (Figure 7). Due to high to low water flowing nature runoff, water flows from upland to lowland area so in the lower part of the Damodar River Basin volume of surface water is very high during the rainy season.
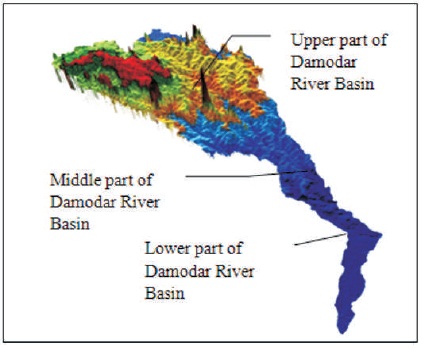
Figure 7. 3D View of Damodar River Basin
The annual rainfall recorded during 2016 in different districts of Jharkhand, Bihar, and West Bengal varies between 999.4 mm-1640.3 mm (Table 4 and Figure 8). The highest rainfall recorded is 1640.3 mm in Latehar district of Jharkhand and lowest rainfall recorded is 999.4 mm in Nawada district of Bihar.
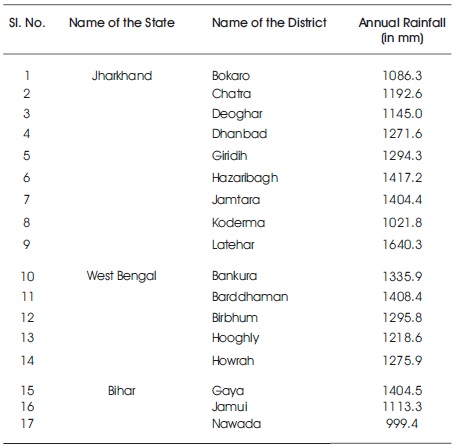
Table 4. Annual Rainfall (in mm) of the Study Area (Source: IMD)
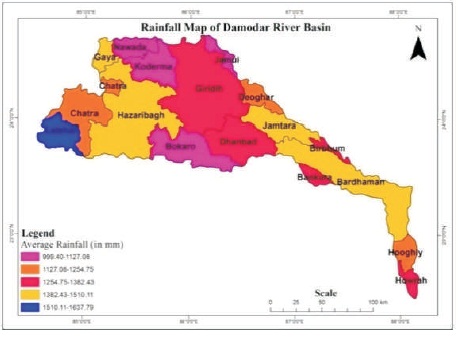
Figure 8. Rainfall Distribution Map of Damodar River
The Slope of the Damodar River Basin ranges between 0°- 67.07° (Figure 9). The upper and middle catchment area is a hilly terrain with a steep slope of 11.88°-67.07° while the slope of lower valley is 0°-5.55° and is narrow and flat.
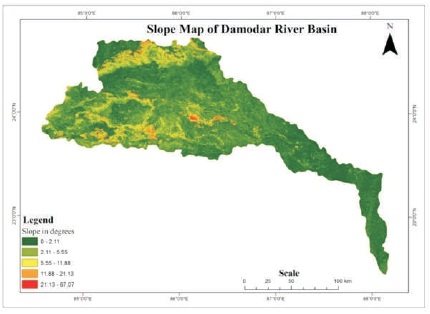
Figure 9. Slope of Damodar River Basin
Using multi-criteria analysis technique, weighted overlay analysis method was used to prepare the final map. Among the total area of 23370.98 sq.km no risk zone covers 6472.19 sq.km (27.69%), low risk zone covers 3341.02 sq.km (14.30%), moderate risk zone covers 12647.48 sq.km (54.12%), and high risk zone covers 910.29 sq.km (3.89%) of the area (Table 5 and Figure 10). Most of the area of Bihar comes under no flood risk zone that is 40% of the total area of the study area of Bihar. A major area of low flood risk zone is present in Jharkhand, which is 15.80% of the total area of Jharkhand, whereas in Bihar it comprises 6.23% of its total area and in West Bengal it covers 11.02% of its total area in the study area. In West Bengal 68.63% of the total area of West Bengal in the study comes under moderate flood risk zone and 20.35% of the total area of West Bengal in the study are within high flood risk zone (Table 6). Different areas within the districts of Jharkhand, Bihar, and West Bengal fall under no risk zone, low-risk zone, moderate risk zone, and high-risk zone (Tables 7, 8, and 9).
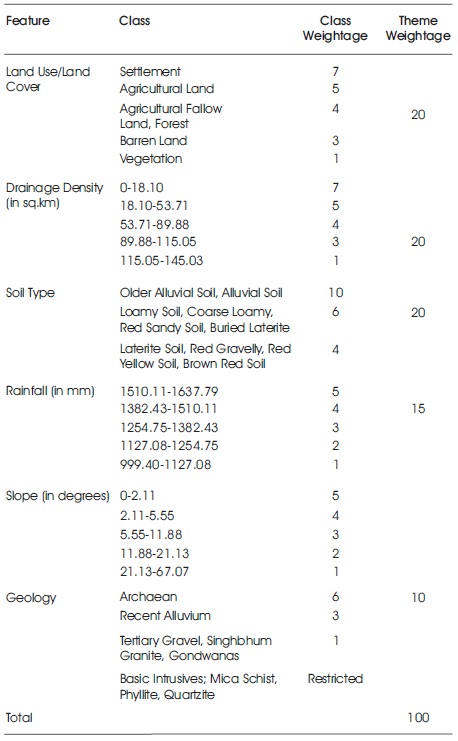
Table 5. Weightage of Each Class of Each Feature with its Overall Weightage
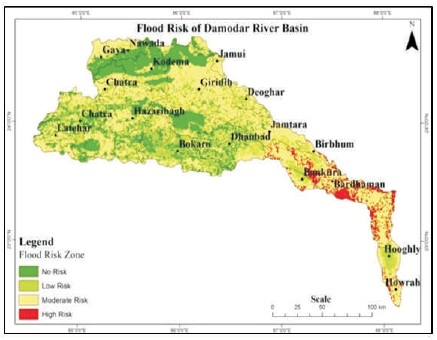
Figure 10. Flood Risk Map of Damodar River Basin
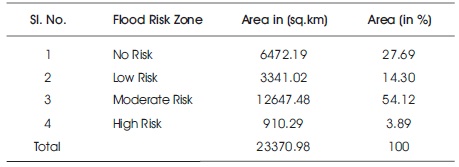
Table 6. Area of different flood risk zones
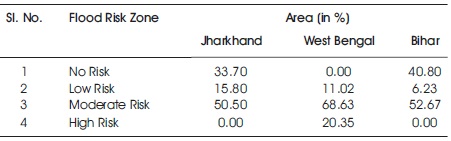
Table 7. State Wise % of Flood Risk Area
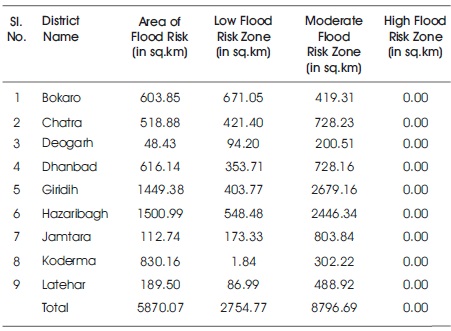
Table 8. Area in % Covered by Flood Risk Zone in each District of Jharkhand
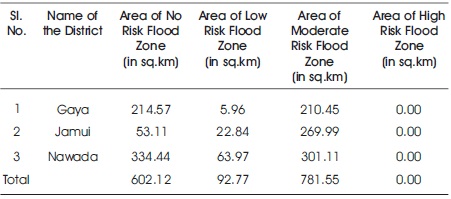
Table 9. Area in % covered by Flood Risk Zone in each District of Bihar
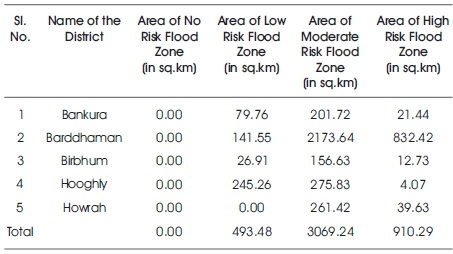
Table 10. Area in % covered by Flood Risk Zone in each District of West Bengal
From the final result prepared by a weighted overlay analysis method using different parameters by assigning weighted value of each class in Arc GIS software and the different thematic maps it is observed that during the flooding in Damodar River Basin agriculture, vegetation in Bankura, Barddhaman, Birbhum, Howrah districts of West Bengal are at high risk. The area is presently at an elevation of 0 m-50 m and in geological terms, it is rich in Archean and recent alluvium, whereas the soil found in these areas are alluvial soil, laterite soil, brown, and red soil with low drainage density. Most of the area of Gaya, Nawada, Bokaro, Dhanbad, Chatra, Koderma, Giridih districts of Jharkhand, and Bihar at an elevation of 50 m-1300 m, the slope of 11.88°-67.07° and high drainage density comes under the low risk zone. The area is rich in Mica Schist; Phyllite, Quartzite and Basic Intrusive and loamy soil, red sandy soil and red gravelly soil are present in this region. The possibility of flood risk is very high in the lower part of the basin. This present study can be used for land resource management in flood-prone areas and also as input for the coping mechanism in relation to flood, capacity in dealing with flood, and policy research on flood risk management.
The author would like to thank Dr. Pradeep Kumar Singh, Director, CSIR-CIMFR, Dhanbad, for support to complete this work.