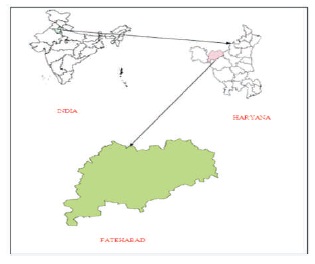
Figure 1. Location Map of Study Area
In modern period of urbanization, industrialization, agriculture, and increasing population have great affect on quantity and quality of groundwater. Haryana is an agriculture dominated state so water is a major requirement for irrigation. Fatehabad district is also an agriculture dominated district, which lies between 28o48'15” to 29o17'10” N and 76o28'40” to 77o12'45” E covering an area of 2538 km2. In this present study, remote sensing satellite IRS-P6-LISS-III 2006 has been used to assess the groundwater prospects and quality by preparing various thematic layers in Arc Map Arc Info 9.3 GIS software. Field visits have been done to collect GPS points to verify delineated unit and inventory data. Post field correction has been made in prospects and quality map. In the district, Older Alluvial Plain, Aeolian plain, Sand Dune, Sand Dune Complex, Palaeochannel, and Older Flood Plain have been demarcated. Older Alluvial covers the largest area of 1498.94 sq. km2 (59.09%) having good to very good groundwater prospects, which is 59.09% of total area. After that Aeolian plain covers 411.8 km2 (16.22%) having moderate to good, sand dune and dune complex covers 30.86 km2 (1.21) and 70.04 km2(2.77%), respectively having poor groundwater prospects. Older flood plain covers 368.84 km2(14.53%) having good to very good groundwater prospects. Palaeochannel covers 86.68 km2(3.41%) having very good to excellent groundwater prospects. For ground water quality, data has been collected from Groundwater Cell, Hisar. The major constituents, such as TDS, Cl, Ca+Mg, EC (μmho/cm), pH, and TH are used to assess the groundwater quality from pre monsoon and post monsoon data. Based on Indian Drinking Water Standards (BIS Guideline–IS: 10500:1991), ground water quality has been categorized into desirable and permissible limit and non-potable limit. In the integrated groundwater quality map, only two categories have same permissible and non potable limit. Permissible limit covers an area of 1703.67 sq.km (67.13%) and non-potable area covers an area of 834.33 sq.km (32.87%). The study presented is highly useful for giving a glance view of prospects and quality in the district which will be helpful in further development and management.
Groundwater is one of the most valuable natural resources that is found below the surface of the Earth, which mainly comes from precipitation, which gradually percolates into the Earth. Typically, 10-20% of precipitation eventually enters aquifer. Population growth has increased irrigated agriculture and other water usages are mining groundwater resources. Specifically, the uncontrolled rate of water withdrawal from aquifers is faster than the natural rate of recharge. “The launch of Earth Resources Technology Satellite, later renamed as LANDSAT-1 with the Multispectral Scanner System in a new era mapping and updating of geological, geo-morphological and structural features using the optical sensors data. Subsequently, Landsat-Thematic Mapper and the India Remote Sensing Satellite sensors have been operationally used in India to generate groundwater potential maps at 1:250,000 scale” – (Roy, 2008). The LISS-III multispectral data from IRS-1C and IRS-1D satellite have been used later for preparing groundwater potential maps at 1:50,000 scale.
Fatehabad district lies between 28o48'15” to 29o17'10” N latitudes and 76o28'40” to 77o12'45” E longitude covering an area of 2538 sq.km and this location is shown by Figures 1 and 2 (Location map and Satellite Data). Fatehabad is one of the smallest districts in the Haryana State covering 5.69% area of the state. The district is surrounded by states and other district of Haryana as Punjab state in the north, Jind district in the east, Sirsa district in the west direction, Hisar district and Rajasthan state in the South. The district has many geomorphologic units as part of the alluvial or Ghaggar-Yamuna plain and its southern and western portions mark a gradual transition to the Thar Desert. Ghaggar is the main seasonal drainage system in the District. Geological structure is hard, which is concealed under alluvial and Aeolian deposits in the district. The quality of water throughout the district varies from place to place and well to well. Vegetation under district falls under the category of tropical desert thorn and comprise predominantly of xerophytes. The district is inhabited by varied group of animals.
Figure 1. Location Map of Study Area
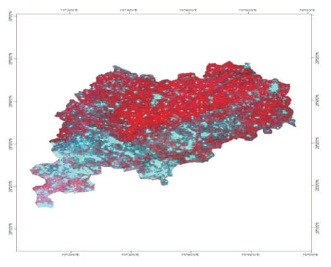
Figure 2. Satellites Data of Study Area
Kumar and Kumar (2010) have studied the application of remote sensing and GIS in groundwater prospects mapping and sitting recharge structures. They used satellite data as well as extensive field data for preparation of various thematic maps. Khan et al. (2006) studied the prospecting groundwater resources using RS-GIS -in arid western Rajasthan of India. Groundwater prospect map is prepared for a part of Jodhpur district in western Rajasthan through integrated analysis of four major controlling factors: geology, geomorphology, structure, and hydrology. Through visual interpretation of satellite data and using Geographical Information System, twenty five hydro geomorphic units were delineated. Qureshi et al. have studied integrated groundwater resources mapping in Balsmand Area of Hisar District, Haryana using remote sensing and GIS techniques (Ground water prospects map is derived from geomorphologic map).
The main objectives of the present study are:
IRS-P6 (LISS-III) 2006 satellite data have been used for preparation of thematic maps. SOI Toposheets on 1:50,000 scale (44 O/3,44 O/5, 44 O/6, 44 O/7, 44 O/9, 44 O/10, 44 O/11, 44 O/13, 44 O/14) have been used. Groundwater quality data of 2008 Pre-monsoon and Post-monsoon periods have been collected from Groundwater Cell, Hisar. Ground truth has been done for geomorphic categories using GPS. Erdas Imagine 9.1, Arc Map 9.3, Garmin, and MS Office (2007) have been used for this study (Qureshi et al., 2010).
Base map has been prepared with information like road, canal, railway line, and settlement using Survey of India topographic sheets and satellite data on 1:50,000 scale. The flowchart of methodology is given in Figure 3.
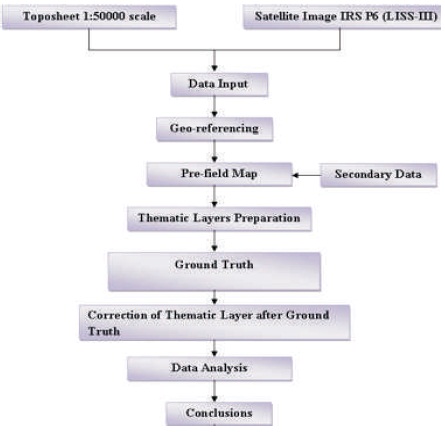
Figure 3. Flow Chart of Methodology Results
A detailed analysis on spatial database and other collected relevant information is done to demarcate the groundwater prospects area and also demarcate its geomorphology, drainage, and structure themes. Integration of base map (Figure 4), geology (Figure 5), structure (Figure 6), and geomorphology and drainage layers has been done and groundwater prospects map prepared (Figure 7) and area of groundwater prospects zones has been calculated. According to Table 1 and Figure 8, the study area has poor groundwater prospects in 100.67 km2, which is 4.6% of total area while 2026.75 km2 (79.10%) area has good to very good groundwater prospects and 409.58 Km2 area (16.30%) has moderate to good groundwater prospects. The overall scenario has been presented in Table 2.
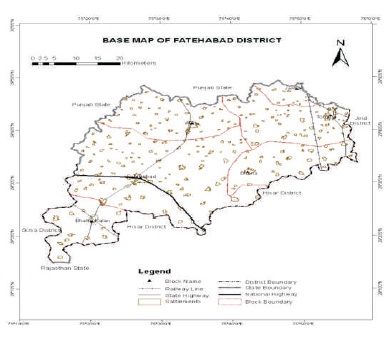
Figure 4. Base Map of Fatehabad District
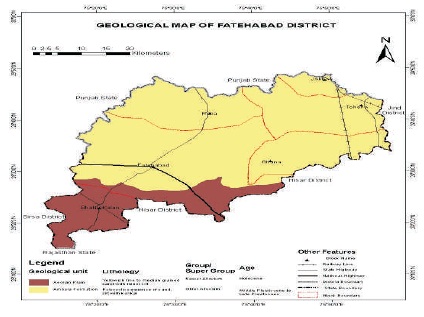
Figure 5. Geological Map of Study Area
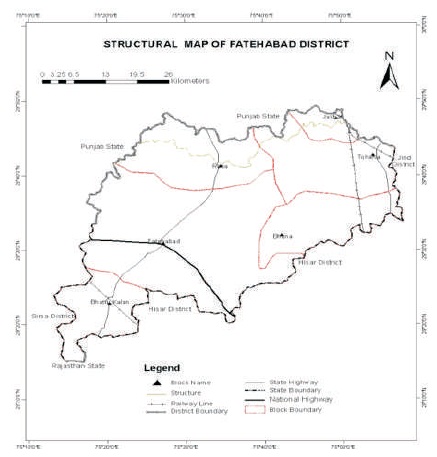
Figure 6. Structural Map of Study Area
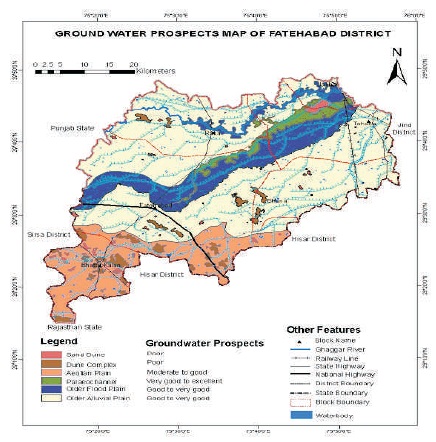
Figure 7. Groundwater Prospect Map
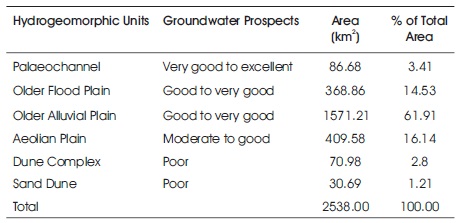
Table 1. Base Map of Fatehabad District
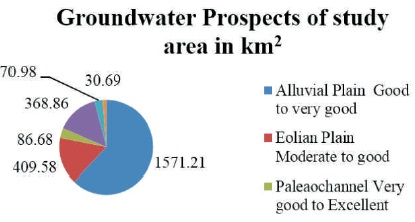
Figure 8. Groundwater Prospects Area of Study Area (in km2)
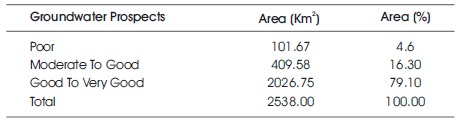
Table 2. Groundwater Prospects Scenario
There are many dissolved minerals and organic constituents present in groundwater in various concentrations. The most common constituents dissolved mineral substances are sodium, calcium, magnesium, potassium, chloride, bicarbonate, and sulphate. They are not harmful if they are within permissible limits. Few elements are highly toxic and hazardous to health of both human and animals. For the assessment of groundwater quality and prospects of the district, groundwater quality data has been collected from Groundwater Cell, Hisar for the year 2008, which consist of pH, TH, Cl, TDS, and Ca constituent's data. Based on Indian Drinking Water Standards (BIS Guideline-IS: 10500:1991) presented in Table 3, permissible and non-potable limits have been categorized. Based on pre and post monsoon maps have been prepared for each constituent and in last integrated map have been prepared which present the overall groundwater quality scenario in Fatehabad district, which is also presented in Figure 9 and Table 4.
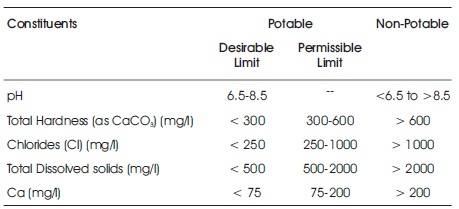
Table 3. Indian Drinking Water Standards (BIS Guideline-IS:10500:1991)
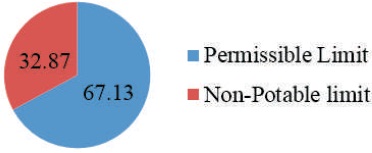
Figure 9. Area (in %) of Groundwater Quality Categories
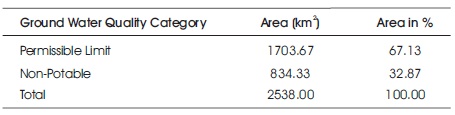
Table 4. Overall Groundwater Quality Scenario
Figures 10 and 11 represent the pre and post monsoon groundwater quality map based on groundwater cell. Figure 12 represents the integrated map of groundwater quality map of Fatehabad District.
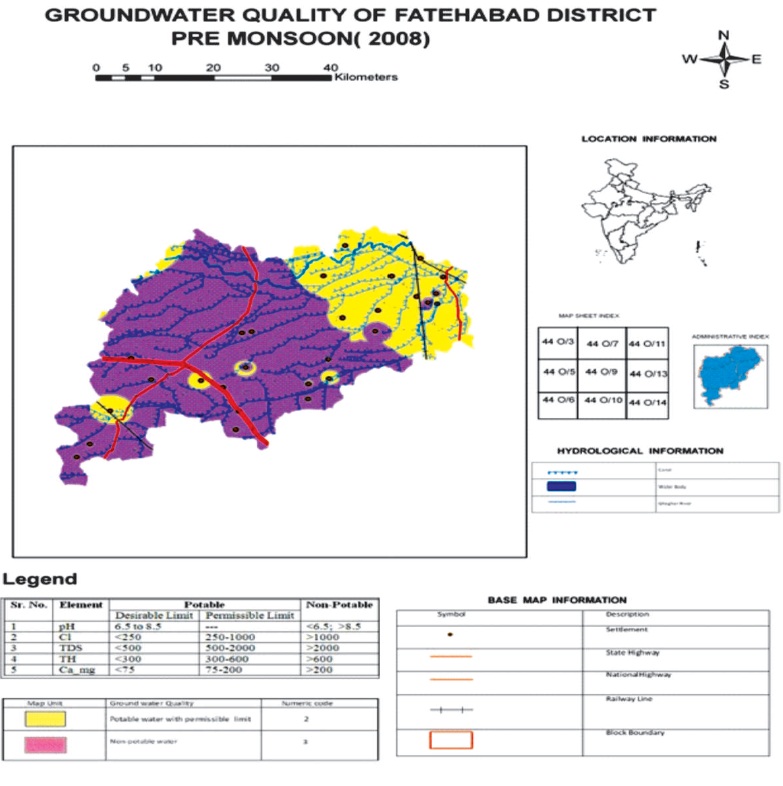
Figure 10. Groundwater Prospects Pre Monsoon
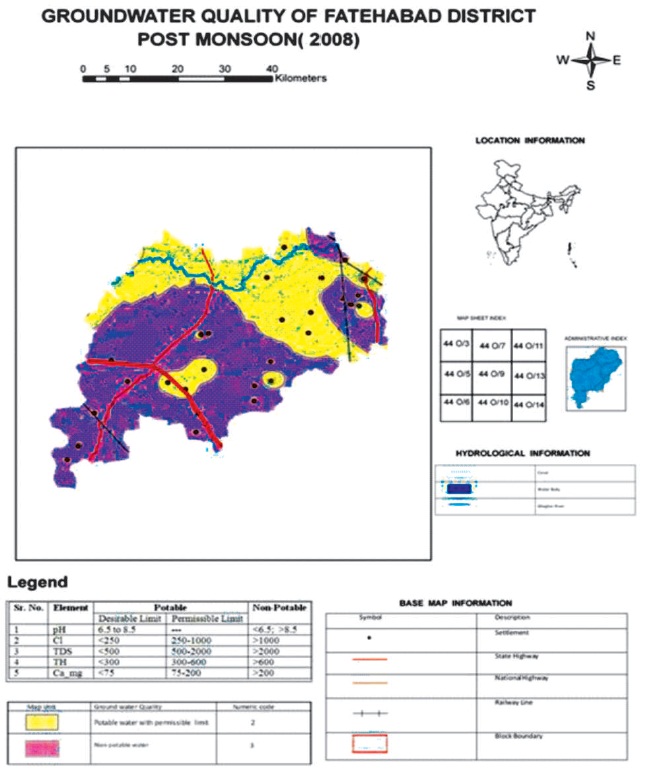
Figure 11. Groundwater Quality Post Monsoon
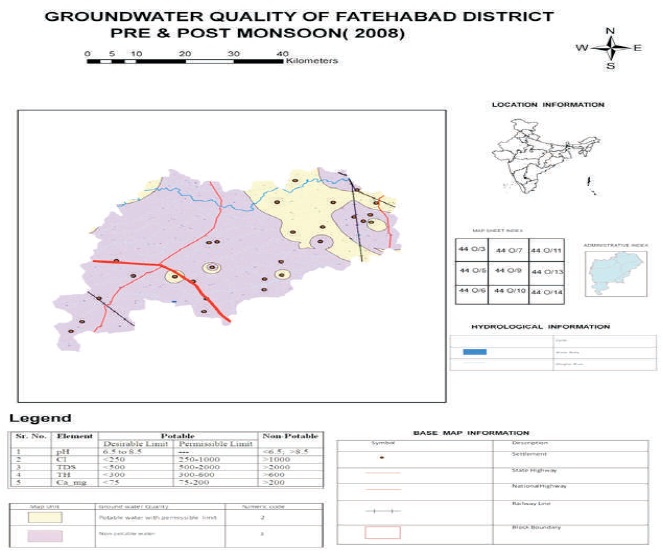
Figure 12. Integrated Groundwater Quality Map of Fatehabad District (Pre and Post-Monsoon-2008)
The study provides a glance about integrated role of remote sensing, GIS, and GPS for mapping and assessment of groundwater prospects and quality.
After the detailed analyzing of data which provides results as the groundwater prospect in Aeolian plain (16.24% of total area) is moderate to good and covers 406.8 sq.km area. Dune complex (3.39% of total area) covers 70.98 sq.km area. The possibility of groundwater prospect in this unit of district is poor. Sand Dunes cover (1.21% of total area) 30.69 sq.km area. The groundwater prospect in this unit is poor. Palaeochannel unit of the district spreads over an area of 86.68 sq.km of the total area of the district. The possibility of groundwater prospects in this unit of the district is very good to excellent. Older flood plain (14.53% of total area) covers 368.86 sq.km area having good to very good groundwater prospects. Older alluvial plain (61.91% of total area) having good to very good groundwater prospects covers 1571.21 sq.km area. In the district, good to very good groundwater prospect category is spread over an area of 2026.75 sq.km, which is 79.10% of total area. Moderate to good groundwater prospects covers 409.58 sq.km of the total area, which is 16.3% of total area. Poor groundwater prospects cover 101.67 sq.km, which is 4.6% of the total area. pH covers 140 sq.km (5.51%) area under desirable unit, 2343 sq.km (92.33%) area under permission limit and 55 sq.km (2.16%) area under non- potable limit. Ph value in the pre-monsoon is 7.1 to 90 and in the post monsoon it lies between 6.6 to 9.2. TH ranges between 200.02 ppm to 5596.82 ppm; TDS ranges 156.03 ppm to 10919.4 ppm; pH value ranges 7.0 to 8.9 in the study area. TH covers 655 km2 (25.8%) area under permission limit and 1883 sq.km (74.2%) area under non-potable limit. Th value in the pre monsoon is between 100 to 10800 ppm and value of the post monsoon lies between 100-3700 ppm. Ca+Mg concentration ranges 4.0 ppm to 215.98 ppm in the study area. The concentration of these elements is within permissible limit. Ca+Mg covers 2428 km2 (95.66%) under desirable unit, 87 km2 (3.43%) under permission limit, and 23km2 (0.91%) area under non-potable limit. Ca+Mg value in the pre monsoon is between 2.0 to 216 ppm and value of post monsoon lies between 2.0 to 160 ppm. Cl ranges 31 ppm to 313.4 ppm in the study area. Cl covers 2457 km2 (96.8% area under desirable unit, 32 km2 (1.26%) area under permission limit, and 49 km2 (1.94%) area under non-potable limit. Cl value of the pre-monsoon is between 2.0 to 304 ppm and value of the post monsoon is 2.0 to 152 ppm. TDS (Total Dissolved Solids) ranges 156.036 to 10919.4 in the study area. In the study area, TDS covers 42 km2 (1.65%) under desirable unit, 1607 km2 (63.31%) under permission limit, and 889 km2 (35.04%) under non-potable limit. TDS value of the pre-monsoon is between 216 to and 23km (0.91%) area under non-potable limit. Ca+Mg value in the pre-monsoon is between 2.0 to 216 ppm and value of post monsoon lies between 2.0 to 160 ppm. Cl ranges 31 ppm to 313.4 ppm in the study area. Cl covers 2457 km2 (96.8% area under desirable unit, 32 km2 (1.26%) area under permission limit, and 49 km (1.94%) area under non-potable limit. Cl value of the pre-monsoon is between 2.0 to 304 ppm and value of the post monsoon is 2.0 to 152 ppm. TDS (Total Dissolved Solids) ranges 156.036 to 10919.4 in the study area. In the study area, TDS covers 42 km2 (1.65%) under desirable unit, 1607 km2 (63.31%) under permission limit, and 889 km2 (35.04%) under non-potable limit. TDS value of the pre-monsoon is between 216 to 10920 ppm and value of post monsoon lies between 156 to 9840 ppm. In the integrated groundwater quality map, only two categories, i.e. permissible and non-potable have been observed. Permissible limit which is 67.13% of the total area of the district covers an area of 1703.67 sq.km and non-potable which is 32.87% of the total area of the district covers an area of 834.33 sq.km (32.87%).