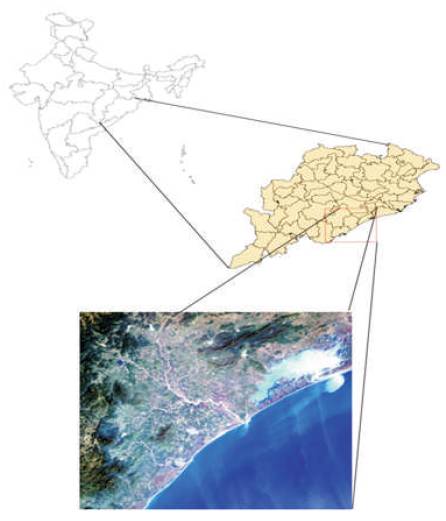
Figure 1. Study Area Map
The coastal ecosystem environment is exceedingly creative and dynamic monetarily as well as naturally and biologically as geographical and physical procedures, for example, disintegration, statement, flooding and ocean level varieties adjust the beach front land forms persistently. Any little changes in any piece of the coastal ecosystem zone straightforwardly influences the financial improvement and land-utilize administration of each package of landmass. All in all, coastal ecosystem zones are inclined to numerous characteristic perils, for example, beach front disintegration, storm surge, wave, waterfront flooding and typhoon, and so on. It is obvious that the worldwide mean ocean level ascent because of human incited dangerous atmospheric deviations, which has turned into a constant marvel amid the 21st century. It is likewise a principle risk to the seaside biological community. Coastal ecosystem zone in India expect its significance on account of high efficiency of its biological systems, convergence of populace, abuse of characteristic assets, release of waste emanating and city sewage, advancement of different ventures, expanding load on harbours, burst in recreational exercises or more all oil investigation exercises. The decimation and loss of land in waterfront zone because of ocean disintegration is an extreme issue, especially for a state like Odisha, which is confronting an unstable populace and mechanical development as of late. The coastal ecosystem frameworks along the state have been influenced by a few formative exercises, for example, ports, ventures, aquaculture cultivating and other human mediation as beach front barrier on past years and with the present pattern of advancement in the state, it is normal that the consumption of these waterfront biological system may happen in earlier too. Keeping the above verifiable and significance of the seaside biological community, the present examination tries to evaluate the land use and land cover changes during pre and post cyclone Phailin at southern part of Odisha coast.
Natural Disasters occur often a round the world and their incidence and intensity appear to be increasing in recent years. The disasters like cyclones and floods usually cause vital loss of life, large-scale economic, social impacts, and environmental damages. Asian country is one of the disaster prone geographical zones of the globe and suffers losses because of various types of disasters annually (Avila & Jiménez, 2010; Singh et al., 2014a; Bhatta, 1997). Cyclone could be a disaster ensuing from nature's fury and is on the far side human management. It causes harm to agriculture, human lives, livestock, infrastructure, and communication facilities. The crucial half here is that the data assortment, mapping and its dissemination. The real-time processing of satellite remote sensing has incorporated the interpretation of data derived from different technologies to ground reality (Chilar, 2000; Kanga et al., 2017; Singh et al., 2014b; Choudhury, 2001). Remote sensing techniques group the information space and mapps the affected areas extensively, but in developing countries the typical resource mapping sources are restricted. Mapping the disaster areas would facilitate within the management of rescue and rehabilitation operations (Sadhu et al., 2017). The supportive data must be used along with remotely detected information for higher assessment (Kanga & Singh, 2017a, 2017b; Dube et al., 1994; Evans, 1992). One direct technique to estimate the damages is to obtain satellite information before, throughout and during the event and analyse them along for modification. From the satellite pictures before the cyclone and during the cyclone, the cases are often mapped. The satellite pictures throughout the event revealed the inundation extent. The post-cyclone satellite information shows the residual effects of the broken space.
Among the coasts, mostly natural disasters, such as storm surges arising throughout cyclones, abnormal waves throughout tsunamis area unit are the foremost distinguished ones. The Bay of Bengal’s geographical region being a cyclonic area, generates cyclones once a year (Kesgin & Nurlu, 2009; Kumar et al., 2010a; Singh et al., 2017a; Lighthill et al., 1994). The cyclonic storms that cross the coastal regions because abrupt tab normal rise of ocean water are referred to as surges and this can be the first cause for coastal flooding within the contiguous land. The Bay of Bengal’s geographic region is one in every one of the ocean basins for the transformation of regions of non-aggressive within the atmosphere into cyclonic storms. Between the years 1891 and 1977. The Bay of Bengal’s geographic region has generated concerns for over four hundred cyclonic storms with totally different degrees of intensity. The results of those storms area affect states on the East Coast of Asian nation, specifically the states, Odisha, Andhra Pradesh, and Tamil Nadu. Sometimes, the surges on the coast incidental to these storms area unit are abnormally high and become the foremost damaging part of this coupled ocean- atmosphere development.
A really severe cyclonic storm Phailin originated from a remnant cyclonic circulation from the South China Ocean. The cyclonic circulation lay as an occasional th pressure area unit over Tenasserim coast on 06 October, 2013. It laid over north Andaman Sea as a marked air mass space on 07th October, 2013. It focused into a depression over constant region on 08th October, 2013, moving west-north-westwards, and it is intense into a deep depression on 09th October, 2013 and more into cyclonic storm 'Phailin' within the same day evening. Phailin, brought heavy deluges, harming winds of more than 220 kilometres for every hour (km/h) and tempest surges of up to 3.5 m. Phailin had a distance across of roughly 500 km toward the eastern Indian conditions of Odisha and Andhra Pradesh. The effects of Phailin and following surges influenced more than 13.2 million individuals, left five regions of Odisha submerged, and caused a huge number of dollars in harm to homes, schools, crops, and the business. At last, a sum of almost 1.2 million individuals were cleared, bringing about the biggest departure operation in India in 23 years (IFRC, 2013). Early cautioning likewise took into consideration, the migration of more than 30,000 creatures. A sum of 21 lives were lost because of the twister and an extra 23 lives because of serious glimmer flooding in the result of the cyclone.
Tropical Cyclones area have intense air mass systems that develop over heat ocean. They are capable of inflicting injury attributable to sturdy winds, serious rains, and storm surges. The frequency of the Tropical cyclones within the Bay of Bengal’s geographic region is four to five times more within the sea. Satellite primarily based observations area unit being extensively used. Satellite integrated automatic weather stations a reputing on islands, oil rigs and exposed coastal sites. The goal of any warning system is to maximise the quantity of individuals, where World Health Organization takes applicable and timely actions for the security of life and property. Land Use/Land Cover information alludes to information that is a consequence of ordering crude satellite information into "Land Use and Land cover" (LULC) classifications in light of the arrival estimation of the satellite picture (Singh et al., 2017b; Lillesand & Ralph, 2011; Pandey et al., 1986; Kanga et al., 2015; Kumar et al., 2010b). Most LULC information items are discharged quite a while after the satellite pictures were removed and hence from date to a specific degree when they are discharged. Regardless, LULC gives an extremely significant technique for deciding the degrees of different land uses and land covers, for example, urban, forested, shrubland, farming, and so on. Land use/Land cover information are most ordinarily in a raster or matrix information structure, with every cell having an esteem that relates to a specific arrangement (Kanga et al., 2017; Y lmaz, 2010; Pandey et al., 2015). Typhoon alludes to any turning storm that pivots around a low-weight focus (Richards, 1999; Sabins, 1987; Shalaby & Tateishi, 2007; Kanga, 2017). The low-weight focus is additionally alluded to as the 'eye' of the tempest, which is notable for being frightfully quiet contrasted and the regions under the turning 'arms' of the tempest. It could be stated that the eye is watching that is happening down beneath, so it needs an unmistakable way, yet the arms are the place, where all the activities happen in light of the fact that this is the place the tempest is tossing out the greater part of its rain and wind. A tropical twister is a low-weight framework which creates in the tropics and is adequately extraordinary to deliver supported intense breezes of not less than 63 km/h. On the off chance, the maintained breeze achieves sea tempest power of no less than 118 km/h and the framework is characterized as an extreme tropical twister. In different parts of the world they are called sea tempests or tropical storms. Tropical tornados can cause critical marvels which can unfavourably, and here and there positively effect on groups and nature. The most widely recognized highlights are dangerous breezes and overwhelming precipitation that can prompt flooding. Tempest surge, or waterfront immersion via seawater, is a lesser known wonder, however can be the most hazardous component of a tornado (Walsh & Watterson, 1997).
The State of province (Odisha) with a geographic area of one, 55,707 sq. kilometre is delimited between North latitudes 17.78 N and 22.73 N and longitudes 81.37 E as and 87.53 E shown in Figure 1. The state contains of three revenue divisions, thirty districts, 58 subdivisions, and 314 community development blocks. The state's population mostly depends on agriculture, success of agricultural operations and also the sequent agricultural economy of the state is passionate about the availability of water and its optimum utilization. The whole population of the state as per 2011 census is 419.73 lakhs, out of that the agricultural population is 349.70 lakhs and also the urban population is 70.03 lakhs. The rural population is nearly passionate about agriculture for his or her support and also the agriculture on convenience of water. A consistent water information is inevitable for designing of considered and optimum utilization of water through the associated economical resource management system that the requirement may be a liable observance system. The coastal plains covering elements of Ganjam, Puri, Cuttack associated Balasore districts from south to north type as an extensive flat sediment tract between the hills within the west and therefore the coast within the east. It presents a flat topography gently sloping towards east with insignificant elevation distinction. The overall elevation of coastal plains varies from 1 to 10 m higher than mean water level (above mean sea level).
Figure 1. Study Area Map
In the present study Image processing, Digital classification and visual interpretation technique are used to carry out Land use / Land cover classification exploitation. The Level-I classification is adopted to organize land use and land cover map. The bottom map consists mainly of emptying map of the study space, which is ready from the Survey of India (SOI) toposheet number on 1: 50,000 scale. Survey of India (SOI) toposheet numbers on 1:50,000 scale (surveyed between 1973 and 1981) were used for the study. Resampled cloud free satellite images with 30 m spatial resolution has been taken to match the SOI toposheets. Due to no procurance of recent satellite imagery, Google Earth pictures were being used for the comparative study, since it was a time bound plan. The raw satellite pictures have been reprojected into the universally adopted customar y datum, i.e., UTM/WGS84 and then Georeferencing was being done of all twelve SOI Toposheets (which covers the study area) separately to provide them with a projection system as per requirement, that is, to be used with the satellite imagery. For the stitching of 2 or a lot of pictures mosaicking of all the reprojected satellite pictures and the georeferenced SOI toposheets were being done respectively to hide the entire study area. In order to build satellite images and SOI toposheets in the same projection system, Geocoding of the image was being done with relevance to the mosaicked SOI toposheets. For proximity analysis, buffering was performed (Mathur et al., 2016; Roy et al., 2017).
Present study was carried out using the open source data available online. Orthorectified Landsat- 8 Operational Land Imager (OLI) data acquired during pre and post cyclone Phailin were downloaded from United States Geological Survey (USGS) portal. Detail of these data is provided in Table 1.
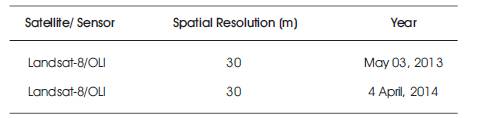
Table 1. Detailed of Data Used
The following software were used to process the data and generation of LU/LC. Earth Resources Data Analysis System (ERDAS) Imagine was used for displaying and subsequent processing and enhancement of the image. ArcGIS was used for preparing maps and processing of the data.
The total scheme of the method adopted for the current study is presented as a flowchart in Figure 3. Orthorectified Landsat-8 OLI data pertaining to pre (May 03, 2013) and post (May 04, 2014) cyclone Phailin were downloaded from USGS site. The bands 1-5 were separated from each data and the spectral radiance has been calculated using equation (1).
Conversion Image DN to Radiance: the spectral normalization is necessary while working with multitemporal datasets. A spatial model (Figure 2) is a graphical programing interface in ERDAS Imagine was created to perform this operation on the images based on equation (1).
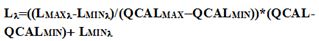
where,
Lλ is the cell value as radiance, QCAL = digital number, LMNλ = spectral radiance scales to QCALMIN , LMAXλ = spectral radiance scales to QCALMAX , QCAL MIN= the minimum quantized calibrated pixel value (typically = 1), QCALMAX = the maximum quantized calibrated pixel value (typically = 255).
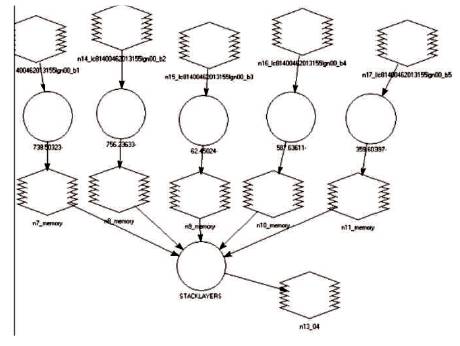
Figure 2. Model for DN to Radiance Conversion
This radiance image was used for unsupervised classification. The classification was performed in ERDAS Imagine using the International Standard Organization (ISO)-clustering technique. Further, these classified images were converted into vector maps and contextual editing has been done manually to refine and merge the clusters into final LU/LC classes.
Individual LU/LC maps were overlaid in ArcGIS environment in order to cross-query the themes and generate change analysis report. Overlay operation technique like intersect, identity, etc., were used here.
Geographic areas representing each LULC classes were calculated in Square Kilometer for each period (pre and post cyclone).
The final maps have been composed in ArcGIS with appropriate marginal details and presented in this report.
From the acquired Landsat 8 image of the study area, change detection analysis was carried out to attempt the land cover changes. For this, FCC (False Colour Composite) images were prepared with the band combinations 5, 4 and 3 to RGB (Red, Green and Blue) channels respectively for both the years 2013 and 2014. Figure 3 shows the FCC images (Pre-Classified) for both the years 2013 and 2014 as shown in Figure 4.
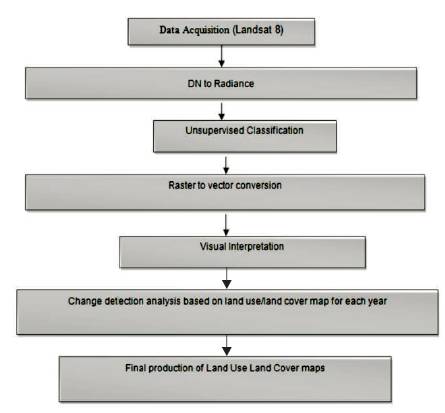
Figure 3. Flowchart of Methodology
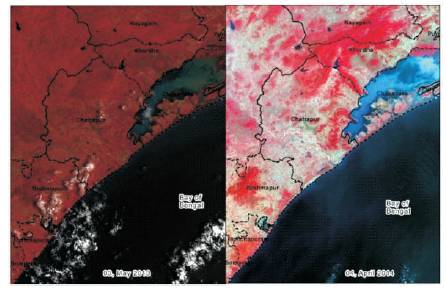
Figure 4. Satellite Images of 2013 and 2014
In 2013, the Vegetation/ forest area was nearly 28.76%, whereas build up area was hardly 0.28%, water bodies cover 4.70% area, barren land/ vacant land and uncultivated area covered 5.94% area respectively and Grassland/ agriculture cover 27.12%, and rest of the area are covered by the sea. Table 2 shows the LULC features of the study area in 2013 and Figure 2 shows the percentage of area covered by different LULC features in 2013. Major category is vegetation pertaining to agriculture and forest is shown in Figures 5, 6, and Table 2.
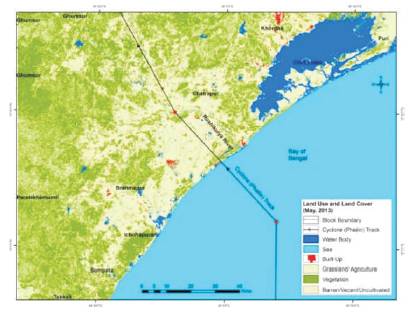
Figure 5. LULC Map May 2013
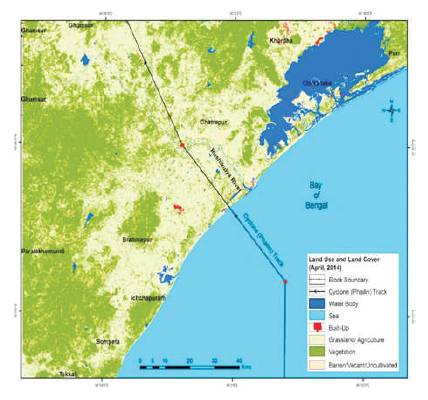
Figure 6. LULC Map May 2014
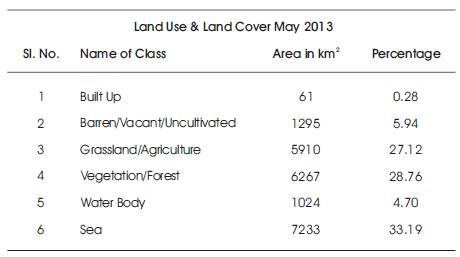
Table 2. Area and Percentage Covered by Different LULC Feature May 2013
In 2014, the Vegetation/ forest area was recorded nearly 29.62%, whereas build up area was hardly 0.29%, water bodies cover 4.75% area, barren land/ vacant land and uncultivated area covered 3.62% area, respectively and Grassland/ agriculture cover 28.51%. Table 3 shows the LULC features of the study area in 2014 and Figure 6 shows the percentage of area covered by different LULC features in 2014.
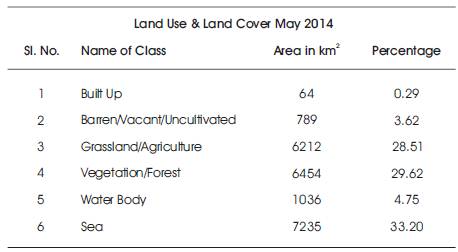
Table 3. Showing Area of Land Use Land Cover May 2014
LULC change assessment was carried out using the pre and post cyclone data suggest that the impacts of cyclone were not revealed in current study as shown in Figure Figure 7 and Table 4. This may be probably due to the post cyclone images acquired six months after the cyclone hit. This period is long enough to bring the LULC situation normal. Hence, much changes were not recorded in the current study. The only significant change noticed here was the barren/ vacant land class, this change may be due to change/ shift in cropping period.
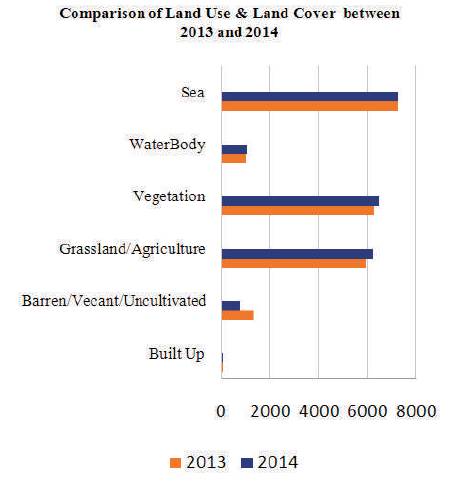
Figure 7. Comparison of Land Use Land Cover between 2013 and 2014
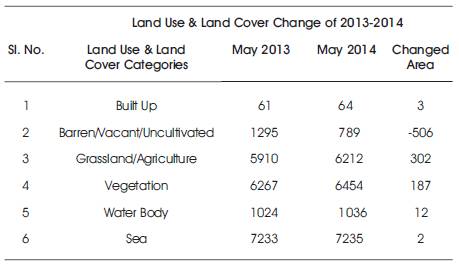
Table 4. LULC Change Comparison in 2013 and 2014
Catastrophe Management must be a multidisciplinary and proactive approach. Other than different measures for setting up institutional and arrangement structure, fiasco counteractive action, relief and readiness articulated and activities being taken by the Central and State Governments and different associations and media likewise have a key part to play in accomplishing the objective of moving together, towards a more secure nation. Remote detecting information and methods along with GIS have demonstrated their helpfulness in a debacle administration design particularly in mapping the new circumstances after the catastrophe, which help in refreshing the geological database. This can be utilized for the reproduction of the harmed zone. GIS interpreted data by making satellite based topical maps demonstrate the spatial measurement of the influenced territories. It has turned out to be simpler to do the catastrophe administration operations proficiently. Studies have helped in making it conceivable to estimate and mimic calamity events with respect to particular areas - helping in the underlying phases of pursuit and protect operations. Procedures like satellite symbolism and GIS help to distinguish zones that are calamity inclined, zoning them as per hazard extents, stock populaces and resources in danger, and re-enacting harm situations. These instruments are even helpful in overseeing fiascos as they give moment to access data required in administration choices.
Current frameworks have likewise demonstrated extremely valuable, especially in inquiry and save operations. They not just help in giving notices to previous catastrophes, yet additionally help in making mindfulness which helps in diminishing confusion, disarray, and mental anxiety. Therefore the framework helps in building up contacts between alleviation groups which, with better focal coordination, can work all the more proficiently. This investigation indicates land use and land cover changes that have happened in catchment over the most recent years and considers and relates diverse segments in charge of the change with the suggestions on increased in biodiversity, soil disintegration, and unseemly land administration. The strategies created as a result of this examination have been utilized for their ability to evaluate the spatial and transient changes in land use and land cover at a scene scale. In particular, Remote Sensing coordinated into a GIS domain describes substantial appraisal zones and set up reference conditions. The land use and land cover flow affects the neighbourhood scale and in addition its results does not have clear limits. There is, in this manner, a requirement for neighbourhood land use arranging and outline with preservation practices of the examination region. This work is only to demonstrate the temporal changes in the LULC and the method used to assess the changes between two periods. The high resolution data is necessary to enhance the current work. It is also necessary to have the cloud free data immediately after the cyclone to have better understanding.