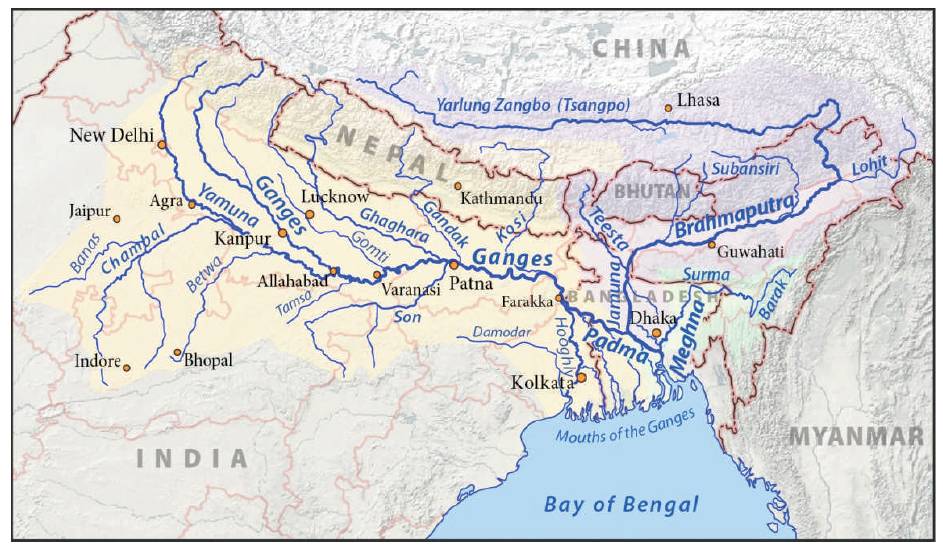
Figure 1. The River Ganga with its Tributaries (Singh et al., 2018)
The present study is done to understand the frequent change in the platform dynamics of river Ganga from Mirzapur to Ballia in Uttar Pradesh. The study is based on sequential river platform maps generated from the time series multispectral datasets, which revealed a periodic pattern of evolution of the river system over the study area. The study depends upon using Landsat sensors that are Trade Marks (TM), Market Stabilization Scheme (MSS), and Enhanced Thematic Mapper (ETM+) acquired through the years 1975 to 2015. The present work deals with Meandering index and Braiding index, which determines the sinuosity, tortuosity, and braiding of the river Ganga to investigate and classify the river into straight, sinuous, and meander category. The study reveals that the sinuosity was increased from 1.38 to 1.56 from 1975 to 2015, whereas the braiding index is observed as 0.6 to 0.26 at one of the Reaches within the study area from 1975 to 2015, which reveals that the river is exhibiting braiding as well as meandering pattern. The study reveals that the platform of river Ganga is shifting continuously, and the factors behind the shifting of river course are natural as well as anthropogenic.
Ganga River is perennial in nature and is one of the largest water systems among fourteen major rivers of India. The Gangetic basin is one of the most fertile and densely populated basins worldwide. River Ganga is personified as a goddess in India. Ganga river basin is the largest river basin in India in terms of the catchment area, constituting 26% of the country's land mass, which is 8,61,404 sq.km and supporting about 43% of its population of 448.3 million (Census of India, 2001; Singh et al., 2018). The basin is bounded by the Himalayas on the North, by the Aravalli on the West, by the Vindhyans and Chotanagpur plateau on the South and by the Brahmaputra Ridge on the East as shown in Figure 1. There are three segments of river Ganga, namely upper Ganga (Gaumukh to Haridwar); middle Ganga (Haridwar to Varanasi); lower Ganga (Varanasi to Ganga Sagar) (CWPRS, 2016).
Figure 1. The River Ganga with its Tributaries (Singh et al., 2018)
During late Pleistocene-Holocene, river Ganga had undergone river metamorphosis (Singh & Ghosh, 1994; Singh, 1992). Large rivers like Ganga exhibit some complex phenomenon like erosion, siltation, and sediment transport and their estimation reveal that its different reaches are in dynamic equilibrium phases (Chitale, 2017). According to Leopold and Wolman, (1957), the river flowing downstream deposits sand and silt along its course downstream of Haridwar. Hence the formations are uncompact and easily tend to erode by the high current of the river here. It is found that with the decrease in slope, the river multiplicity increases (Sinha et al., 2002). A number of rivers in India shows braiding as well as the temporal shifting in their channels, especially in large rivers like Ganga, Brahmaputra, and Kosi (Singh, 1996; Wells & Dorr, 1987; Kotoky et al., 2005). River meandering is an integral characteristic of channel flow in an alluvial plain, it contains a series of consecutive curves formed by the excess total discharge in the flow during floods and stream load discharge from valley slopes. Natural as well as anthropogenic factors are responsible for the meandering of the river like dam construction, settlement encroachments, agriculture, and waste depositions in the rivers’ periphery (Kumar et al., 2016).
The pattern of a river is described as the appearance of a reach in a plan view. Observing plan views of most of the major rivers, they can be classified broadly into three major patterns, such as straight, meandering, and braided (Ikeda et al., 1981). A straight channel never follows a sinuous course and it is very rare in nature. Figure 2 shows different channel patterns (Reza, 2011; Kumar et al., 2016).
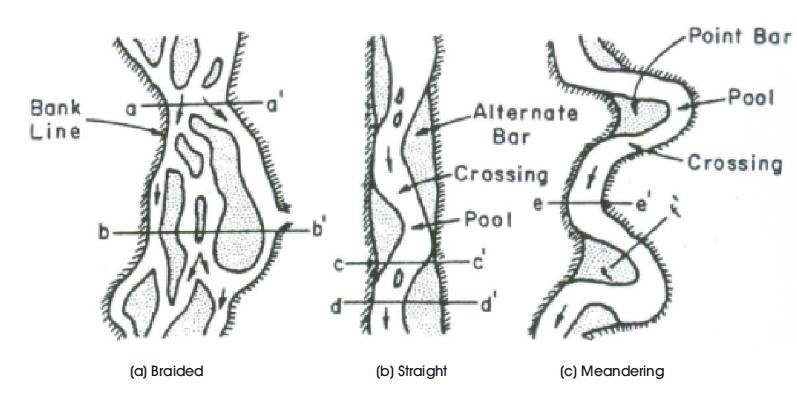
Figure 2. Channel Patterns (Kumar et al., 2016)
Remote sensing and Geographical Information System (GIS) plays an important role in monitoring, mapping, and analysing the surface phenomenon, likewise sinuosity index is calculated in present study to investigate and classify the rivers into three category, namely straight, sinuous, and meander (Ranjan et al., 2016). Multi temporal satellite images, topographic sheets, and Google Earth images were analysed and overlaid to see the change in the alignment of river. The various shifts of selected segments in many parts of the river were measured. It was observed that Landsat images/ remote sensed images can be successfully used to classify lengths of the river (Singh, 2014). Furthermore, it has been seen that the Geospatial Technology provides an influential toolsets through which the spatial data management as well as the decision making capabilities got enhanced as compared to the traditional methods (Stafford, 1991; Ranjan et al., 2017).
The Ganga basin is the largest river basin of India that occupies about 26.3% of the total geographical area of the country (Brice, 1964). Figure 3 shows the area selected for the present study area is the Ganga River flowing from Mirzapur to Ballia district to Uttar Pradesh state (India). Geographically, the study area is situated within the 82.56440 E to 84.14870 E longitudes and 25.13370 N to 25.75840 N passing through some major cities like Mirzapur, Varanasi, Ghazipur, Buxar, and Ballia. In this region, about 84% of the total rainfall occurs in the monsoon from June to September. This strong seasonal variation underlies many problems of land and water resource development in the region. The seasonality of flow is so acute that it can cause both drought and floods.
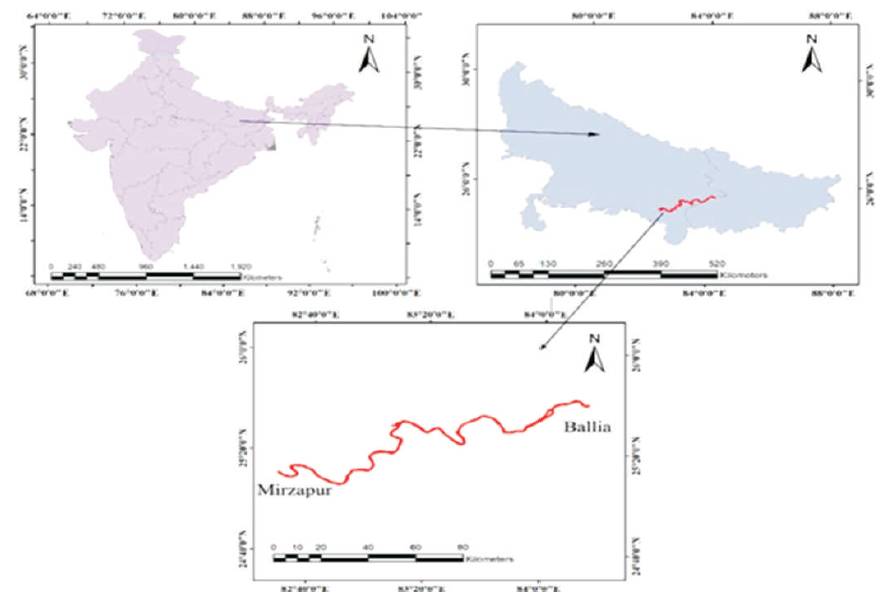
Figure 3. Study Area
As per the availability of multispectral remotely sensed data, multi-temporal Landsat data of study area were acquired from United States Geological Survey (USGS). Survey of India Toposheet covering the study area were imported into the ERDAS Imagine software. All 1:50,000 scale to pogaphics heets were individually georeferenced using Ground Control Points (GCP). Topographic maps and Landsat images were georeferenced into Universal Transverse Mercator (UTM) and Zone 45 projection is based on the generated GCP from ground survey using ERDAS Imagine software. All images that were acquired are resampled to a common resolution of 30 m using nearest neighbour technique. The Landsat images were taken from 1975-2015 in a time span of 5 years. Further, the GIS techniques were performed using ArcGIS 10.3 software.
A base thematic map has been generated from satellite images and topographical sheet at a scale of 1:50,000 of the study area. Different bands were layer stacked to generate a false color composite for every satellite image. After further pre-processing, digitization has been done for the years 1975, 1980, 1985, 1990, 1995, 2000, 2005, 2010, and 2015 of the river path. After digitization of river Ganga, the study area is divided into 16 equal distance reaches to obtain a higher accuracy in observation. After digitization of the river path, sinuosity index, tortuosity, and braiding index were calculated by obtaining the thalweg length, valley length of the river path, and the length of braiding bars. The methodology of the present study is shown in the flowchart as in Figure 4.
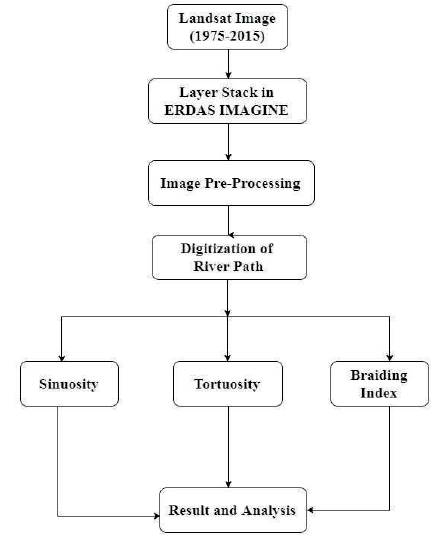
Figure 4. Flowchart of the Data Analysis
Digitized stream length is divided into 16 equal reaches to see the minor variation in the braiding of the river and the variation in river path. The increase in the number of reaches is directly proportional to the accuracy in the result. Figure 5 shows the location of all the 16 reaches.
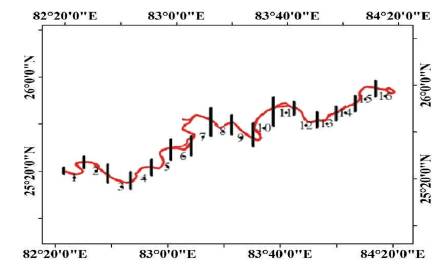
Figure 5. Division of Study Area into Reaches
The sinuosity ratio is the distance between two points on the stream measured along the thalweg length or arc length and divided by the valley length between the two points. Figure 6 shows the definition sketch of sinuosity index, where the curve line or black line denotes the thalweg length and the red line denotes the valley length. If the sinuosity index of a reach is 1.3 or more, the reach is considered as meandering, a straight reach has a sinuosity index of 1 and reaches having sinuosity indices between 1.05 and 1.3 are defined as sinuous (Singh, 2014). Sinuosity is estimated by the given formula.
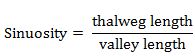
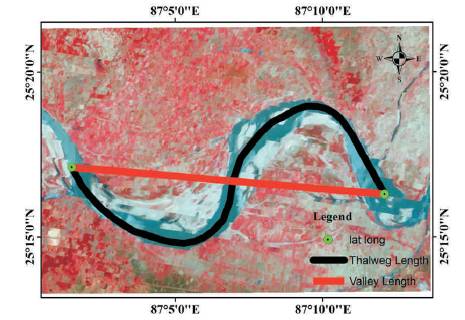
Figure 6. Definition Sketch of Sinuosity Index (CWPRS, 2016)
Braiding Index is a method to calculate the channel multiplicity or the amount of braid bars along the river path. Braid bars are the mid channel bars that forms where the discharge is low and the river flows in the route of less resistance and lower elevation.
The equation for braiding index is:
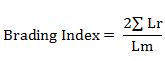
The above equation describes the formula used for the calculation of the braiding index by Brice (1964), where Lr , is the length of all the islands and/or bars in the reach, and Lm , is the length of the reach measured midway between the banks of the channel belt as shown in Figure 7. By using this formula, it was observed that the braiding index is greater than 1 and moreover this formula is very subjective. Therefore, CWPRS, Pune has suggested a new formula for the calculation of braiding index as shown in Figure 8. By using the new formula, it was observed that the braiding index varies between 0-1. So, this formula is quite useful for the analysis and is also used in the present study.
The formula used is:
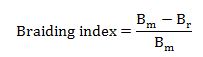
where Br is the distance between the inner bars and Bm is the distance between the outer bars of each braid bars.
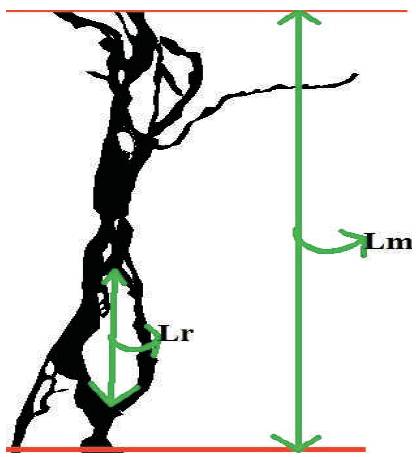
Figure 7. Depiction of Braiding Index (Brice, 1964)
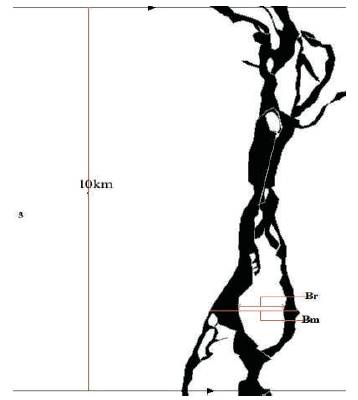
Figure 8. Method for Calculation of Braiding Index (CWPRS, 2017)
The migration of meandering rivers results from interactions among flow, sediment transport, and channel form that creates complicated sedimentary structures and leads to the evolution of channel over time. The morphodynamics of meandering river channels play an important role in sedimentation patterns and processes and hydrological and ecological processes in flood plain environments. The course of River Ganga at Varanasi is studied for last few years using the satellite image available in USGS earth explorer. The picture reveals that the morphology of the Ganga River has been changed in last few years in terms of sinuosity, braiding, and tortuosity.
It is observed that channel morphology in different parts of Ganga is changing continuously. Sinuosity data depicts that change in channel morphology that varies year to year may depend on the discharge and flow velocity change due to the variation in rainfall and other human interventions. Such changes distort the natural equilibrium of a river; in the process of restoring the equilibrium, the river generally adjusts itself to new conditions by changing its slope, roughness, bed material size, cross-sectional shape, or meandering pattern, which can be seen in the case of river Ganga in the present observation.
Here in Figure 9, the change in the river path can clearly be seen throughout the study area. Especially, river passing through the major cities like Varanasi, Rampur, Ghazipur, Buxar, and Ballia shows a continuous change in their path over time. The sinuosity and tortuosity were calculated for the study area and shown in Table 1.
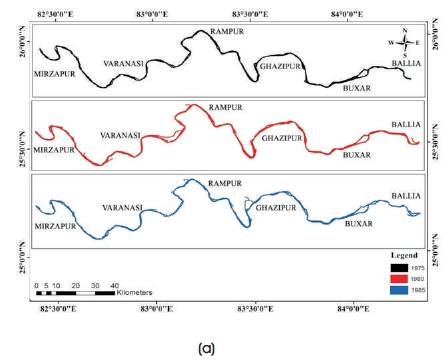
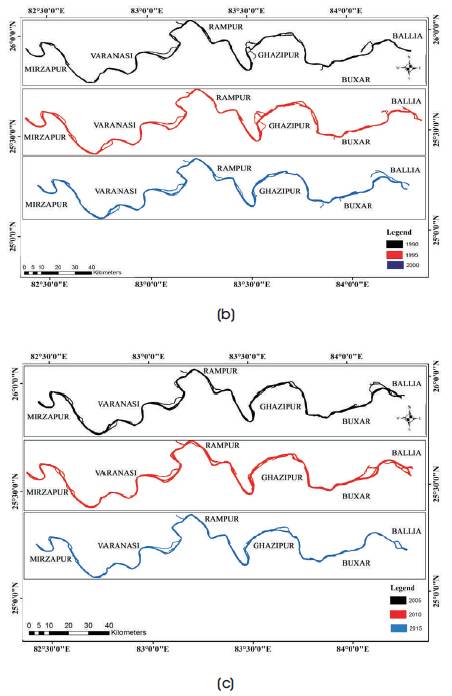
Figure 9. (a) Digitised Path of River Ganga from Mirzapur to Ballia (1975-1985), (b) Digitised path of river Ganga from Mirzapur to Ballia (1990-2000), (c) Digitised path of river Ganga from Mirzapur to Ballia (2005-2015)
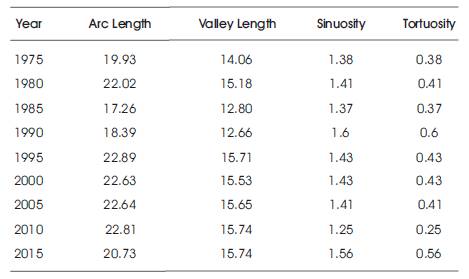
Table 1. Meandering Indices
By analyzing the graph in Figure 10 and Table 1, it has been seen that there is a gradual increase in the mean sinuosity index and tortuosity values that shows that there is increase in meandering and change in river path throughout the study area. There is a total increase of 0.18 in sinuosity index as well as in tortuosity from the year 1975 to 2015, but the value is fluctuating throughout the time. In 1990, the river got its maximum sinuosity and tortuosity value that is 1.6 and 0.6, respectively with a drastic increase of 0.23 in both sinuosity index and tortuosity. This type of drastic change in sinuosity index indicates the influence of natural or man made calamities like flooding, drought, dam burst, etc., in rivers course change. Another major increase in sinuosity can be seen during 2010-2015, which is 0.31. The above data shows that how river Ganga is changing its course in a very short duration of time.
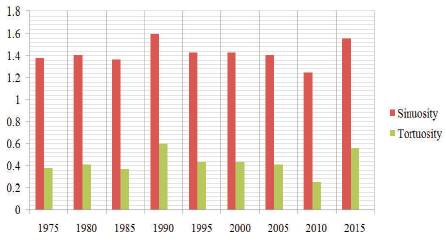
Figure 10. Observed Meandering Indices and Tortuosity
Variation is observed in the braiding index of the equally defined 16 reaches within the study area as shown in Table 2 from 1975 to 2015. For all the 16 reaches individually, it was observed that there are slight as well as drastic variations in the braiding index of the reaches. The braiding index varies from 0 to 1, where the lower value indicates river with lower braid bars, whereas the higher value indicates highly braiding zones.
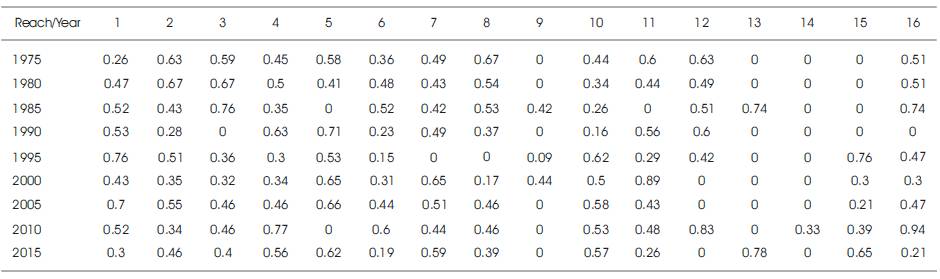
Table 2. Observed Braiding Index from 1975 to 2015
It had been seen in Reach 1 that it has a low braiding index in 1975 and gradually it has increased and attended its highest value of 0.76 in 1995 and it gradually decreased to 0.3 in 2015. This condition depicts that earlier the river has a low sediment load or braid bars, which gradually increased and became variable throughout the years, this type of variability in the number of braid bars totally depends on the river flow rate and the sediments carried by them. River flooding is one of the major factors affecting the variation in the amount of sediment deposition and erosion in any particular region. Similarly, the variation in the braiding index is seen in almost all the reaches, but some of the reaches have shown the value 0, which means that there is the absence of braid bars. In Reach 9,13,14, and 15, it has been seen that the most of the observation is 0 that indicates the river is much straighter in these reaches at that particular time. In Reach 13 it has been seen that there is drastic increase in the braiding index 0.74 in year 1985 and 0.78 in 2015 and besides these two time periods, the river is much straighter. This type of observation shows the influence of flooding in these zones that deposits the larger sediment bars in low slope areas.
River erosion is also a dominant phenomenon in the variation of braiding index, where there are several events recorded in the present study where erosion has taken place. For example, at Reach 16 it has been observed that the braiding index at that reach in 1985 is 0.74 and drastically it became 0 in 1990 and then again in 1995 it reached 0.47, which shows the involvement of erosion along the reaches and the rate of change in the braid bars. Highest value of braiding index is seen at Reach 16 near Ballia district that is 0.94 in year 2010 which is very high, Ballia is one of those districts where there Ganga river is changing its path very rapidly in the recent times because of the variation in the sediment load deposited from every year's flood in Ganga river.
The present study gives a qualitative as well as the quantitative analysis of exactly how the river Ganga is continuously shifting its path within the study area. It has been concluded that both erosion and deposition is taking place in the channel due to natural as well as anthropogenic factors, which is influencing the river dynamics. It has been seen that the morphometric variables like sinuosity and braiding index plays a significant role in defining the status (straight, meandering, and braided) of the river. The values of sinuosity is varying every year, and has been increased from 1.38 to 1.56 since 1975 to 2015, whereas the braiding index depends on the discharge rate and the flow velocity within the channel. Hence, the present study concludes the role of Geospatial Technology in determining the morphometric parameters and estimating the rate of change in platform dynamics of river Ganga from Mirzapur to Ballia.