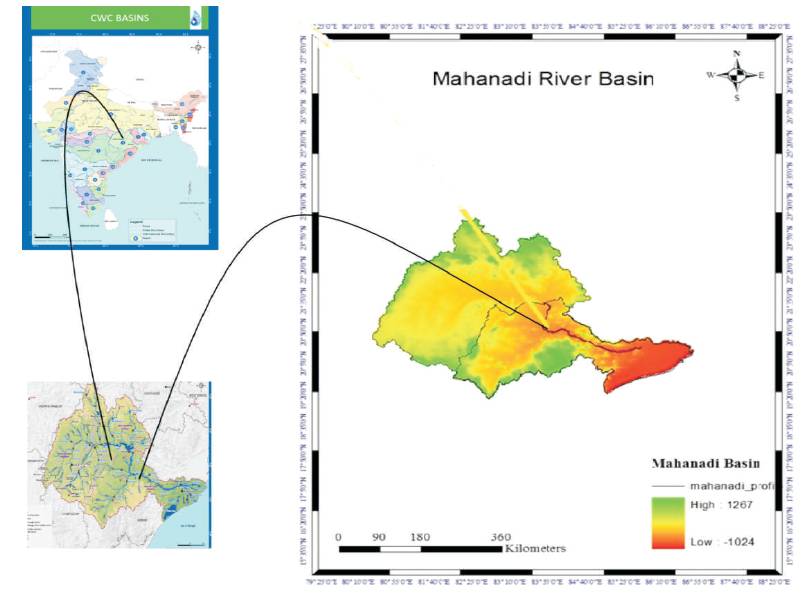
Figure 1. Study Reach (Hirakud Dam to Naraj) in the Mahanadi River Basin
India has such a diverse geographical area that there are floods in some parts and droughts in other parts of the country and same time they co-exist. Large numbers of severe and devastating floods are endangering life and properties. In the state of Odisha, flooding is caused primarily due to Mahanadi River. The flow of water and its level in the river Mahanadi having a catchment area 141000 km2 is controlled by Hirakud dam. The entire deltaic region of Mahanadi River intercepting a catchment of 48700 km2 gets affected by medium to severe flood almost every year causing immense loss to life and property. Study was done to find out reduced level of flood water in different locations of Mahanadi river reach between Hirakud dam and Naraj for 10, 25, 50, and 100 years return period using Hydrologic Engineering Center-River Analysis System (HEC-RAS) model. The study has been accomplished by preparing the basin map for Mahanadi river in HEC-RAS readable format and computing the peak flood for 10 years, 25 years, 50 years, and 100 years return period using Gumbel's distribution. Improvements for the channel cross-section, bank embankment modification, height of flood protection structure such as dikes, levees in the flooded zone were suggested. The peak flood discharge of Mahanadi river at 10 years, 25 years, 50 years, 100 years return have been calculated as 37535.026 m3/s, 45067.19m3/s, 50656.19 m3/s, and 56203.24 m3/s, respectively. Flood flow hydrograph has been prepared for the year 2008 by unsteady flood flow simulation. Around 10 marked location of river stations are prone to flood under 20 year return period. Eight such points were observed to be overtopping the existing banks with a varying height of 1 m to 10 m with reference to existing banks reduced level in subsequent 10 years to 100 years return period in increasing order. The findings of present study suggest the minimum height of dikes, levees to provide protection from flood at different locations of existing banks to be 2 m to 10 m.
Water is the most precious for the existence of the physical world. Adequate amount of water is important for the living beings. As the scarcity of water is a solemn concern for proper management, so also excess of it. The former situation leads to draught and the latter to flood; world is facing such types of phenomena simultaneously. Both are terrible catastrophic and alarming situation and needs to be properly managed. Rainfall excess over a catchment area of a natural river stream creates a situation of very high discharge at the outlet point by overtopping its bank and flooding its flood plain area. Excess of water in a natural river, streams, or an artificial channel leads to flood. As per Emergency Events Database by the Centre of Research on the Epidemiology of Disasters at Brussels (CRED) report, last decade of the 20th century floods killed about 1 lakh and affected over 1.4 billion people (Jonkman, 2005) and it was estimated that more than one-third of the world's land area is flood prone affecting some 82% of the world's population (Dilley et al., 2005). So, for minimizing the losses due to floods, proper sustainable scientific flood management strategy should have to be adopted (Ghanbarpour et al., 2014). Major flood that have happened before in 100 years on average, may now start to happen in every 10 or 20 years. The flood season may become longer and there will be flooding in the places where there was no flood earlier. So, risk of flooding looks greater than ever all over the world.
In Indian states there were huge damage and loss due to several flood disasters. Flood in the state of Himachal Pradesh in the year 1988; Orissa in the year 1999, 2006, 2008; West Bengal in the years 2000, 2004; Maharashtra in the year 2005; Gujrat in the year 2007; Jammu and Kashmir in the year 2014 and Sharsa area near Nepal of Bihar, etc., are one of them. In addition to this every year flood hazard is in low lying Indo-Gangetic plain (Pappenberger et al., 2005). Around 49.815 million hectares of land in India is prone to floods as per National Flood Commission report. Floods resulted in an annual damage of more than 1800 crore besides the loss of precious human lives and cattle as per Planning commission, Govt. of India (2011) on the basis of an average data during 1953 to 2010. In India mostly flood affected zones has been categories in three zones as these are (i) Ganga Basin, (ii) Brahmaputra and Barak Basin, (iii) Central India and Deccan Rivers Basin. Mahanadi river basin is one of the most flood prone areas of east central India and comes under third zone (Asia’s Disaster Toll, 2013).
Extreme rainfall due to climate change and deforestation in the Mahanadi River basin leads to uncontrolled and more frequent flood in the delta region (Jena et al., 2014). Among many flood events in Mahanadi river there are 9 events including pre and post-independence, viz. in years 1855, 1933, 1937, 1955, 1980, 1982, 2008, and 2011, which were highly severe and devastating and had caused huge damages to life and property (Choudhury et al., 2012). Analysis on historical records of flood events from 1969 to 2011 in this river reveals that 69% of the major floods are due to the contribution of flow from the middle reaches, 23% due to joint contribution of Hirakud dam and middle reaches while 8% are caused due to contribution from Hirakud releases only (Fritz, 2003; Mahanadi Basin, 2014; Mauri et al., 2013; Parhi et al., 2012; Pappenberger et al., 2005, 2006). The most recent severe flood recorded after independence was in 1982 which was extended over 114 blocks, 7 municipalities and 16 NACs, inundating an area of 90000 km2 ; endangering 5 million people and 12 lakh hectare cultivated land. During this flood the peak observed at Munduli was 44492 m3/s against the capacity of its existing embankment capacity 25510 m3/s, i.e. 75% excess (Management of Floods, 2009). It was also observed that this flood was primarily contributed from the downstream catchment of Mahanadi river beyond Hirakud dam. Another look on historic floods in Mahanadi system also reveals that 12% major floods were caused due to contribution from Hirakud releases only, 45% major floods were due to contribution from downstream of reservoir beyond Hirakud reservoir up to Munduli only and another 43% were jointly due to contribution from Hirakud reservoir and its downstream catchment up to Munduli.
D'oria et al. (2013) investigated downstream flow at the river confluences to generate the inflow hydrograph at the upstream side of the river. Kumar et al. (2011) reported that Channel roughness is a sensitive parameter in development of hydraulic model for flood forecasting and flood inundation mapping. The findings Parhi et al. (2012) suggests that Channel roughness is most sensitive parameter in development of hydraulic models for flood forecasting and flood inundation mapping and also suggested optimum manning's n value of 0.032 for a part of middle reach of Mahanadi river from Khairmal to Barmul. In a later paper of Parhi (2012), concluded the best fit result of channel roughness is 0.029 from Khairmal to Barmul reach of Mahanadi River. Panda et al. (2013) reported that Mahanadi River basin is one of the recognized climatic vulnerable regions of India. They observed a marked increase in the stream flow and rainfall of the pre and post-monsoon season. Study in Atrato River in Quibdo, northwest of Colombia done flood hazard modeling (Mosquera-Machado & Ahmed, 2006) that reveals that flooded zone was more significant out of the left bank than out of the right bank of the river. Flood in the Mahanadi River starts flowing when 17150 m3/s of discharge passes at the Naraj. Depending upon the amount of rainfall in the catchment area, a very high discharge upto 4500 m3/s may be flushed at the delta. Flood discharge of 28580 m3/s may also result as havoc damaging flood to the downstream of Mahanadi delta region.
The study aims for the flood flow modelling and embankment protection. To generate the information for flood forecasting and hazard mapping with different return period, Mahanadi river has been considered. An important prerequisite for developing management strategies for mitigation of extreme flood events is to identify areas of potentially high risk to such events, thus accurate information on the extent of floods is essential for flood monitoring and relief.
Hence the study is planned to approach combining statistical technique (Gumbel Distribution), Arc-GIS, Hydraulic Modelling (using HEC-RAS) to assess the risk and hazard of flooding and embankment protection in Mahanadi River in Odisha, India.
Hydrologically Mahanadi basin which is 8th largest basin in India is divided into three sub basins, namely upper, middle, and lower Mahanadi. Mahanadi Lower is the largest sub-basin followed by middle and lower (www.india-wris.nrsc.gov.in). Total area of the Mahanadi Lower sub-basin is 57,958.88 km2, i.e. 41.5% of total basin area. The focus of this study is in the lower region of the Mahanadi River in Odisha, India in Figure 1. In the present study, the river comprised of 310 km long from Hirakud dam to the Naraj Gauging site, near Railway Bridge covering an area of 48,700 km2. Average flow of Mahanadi river is 2119 m3/s (avg.) to 56700 m3/s (max) of water to the Bay of Bengal (The Indian Express, 2014).
Figure 1. Study Reach (Hirakud Dam to Naraj) in the Mahanadi River Basin
The Mahanadi basin has varying topography with the lowest elevation in coastal reaches and highest elevation found in northern hills (www.india-wris.nrsc.gov.in). The Coastal plain stretching over the districts of Cuttack and Puri covers the large delta by Mahanadi and elevation decreases towards this deltaic stretch reaching upto 10- 50 m. The spatial variation in rainfall is moderate in the basin. More than 90% of the total annual rainfall occurs during monsoon season spread over from June to October. The annual rainfall in the basin varies from 1143 mm to 2032 mm over the entire basin, the average being 1438.1 mm. Highest 24 hour rainfall recorded in the basin is 581.90 mm in Sambalpur in the month of May, 1982.
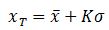
Return period and recurrence interval are most synonymously used for denoting the annual probability of exceedance. The frequency analysis, regression analysis, and screening of time series are the most common statistical methods of analyzing hydrologic data. Frequency analysis is used to predict how often certain values of a variable phenomenon may occur and to assess the reliability of the prediction of an event. Various water resource applications require the calculation called T year flood peak discharge, i.e. the flood peak magnitude with a return period of T-years or flood magnitude observed once every T-years on average. This frequency of exceedance or the design frequency is the risk that the designer is willing to accept. Of course, the smaller the risk, the more costly are the drainage works and structures, and the less often their full capacity will be reached. Improper understanding of the probabilistic behavior of floods at the location of interest may have a serious impact on the project construction cost and the structure life time. Similarly, design frequency should not be too high or too low, it must have a realistic value. Hydraulic processes like floods are exceedingly complex natural events. Floods in a catchment basically depend upon the following parameters.
1. Characteristics of the catchment
2. Rainfall and antecedent conditions.
Each one of the above parameters depend on various constituent parameters. Annual data series is the value hydrological data series of the annual maximum flood from a given catchment area for large number of successive years. The data are then arranged in descending order of magnitude and the probability P of each event. Probability of each event being equalled to or exceed in a hydrologic data series is calculated by the plotting positions formula (Weibull formula).

where,
m = Order number of events
N = Total number of events in that data
P = Probability of exceedance.
The normal formula for return period or frequency is,
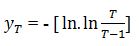
where, T = Return period of an extreme event. Chow (1951) has shown that most of the frequency distribution functions applicable in hydrological studies is expressed by the following equation known as the general equation of hydrologic frequency analysis:
where, xT = value of the variate X of a random hydrologic series with a return period T
x̄ = mean of the variate
σ=Standard deviation of variate
K= frequency factor which depend upon the return period T and the assumed frequency distribution.
Some of the commonly used frequency distributions are Gumbel's extreme-value distribution, Log-Pearson Type III distribution, and Log Normal distribution are used for frequency distribution.
Gumbel's methods introduced by Gumbel in 1941 is the most widely used for frequency distribution function of extreme events, like frequency analysis of rainfall, extreme flood events, etc. The equation is,
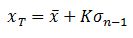
where σn-1 =standard deviation of the sample of
size 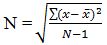
K = frequency factor

In which yT = reduced variate, a function of T
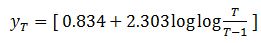
ȳn = Reduced mean, a function of sample size N
Sn = Reduced standard deviation, a function of sample size N
Flood models are the representation of the hydrologic and hydraulic processes in the watershed, river channel, and floodplain. Many models are used, which is for flood analysis Like Mike-11, Mike Flood, Mike-21, Sobek, HEC-RAS, ARC-GIS, etc. In this study HEC-RAS is used, which is developed by the Hydrologic Engineering Center (HEC) of the U.S. Army Corps of Engineers. The model is used for determination of water surface profiles for different flows cenarios. The peak discharge is calculated by Gumble's method. HEC- RAS is intended for steady flow water surface profile computations and unsteady flow simulation. The HEC-RAS program, like the other software it can be downloaded free of charge from the Hydrologic Engineering Center's. Hydrologic Engineering Centers River Analysis System (HEC-RAS) is the software predominately used in the field of hydraulic analysis for floodplain delineation. HEC-RAS 4.1 beta was used to develop terrain of the Mahanadi river (lower sub-basin). It was developed by processing the ASTER GDEM in HEC-RAS model.
The flowchart of the flood modelling in HEC-RAS is shown in Figure 2.
Figure 2. Flowchart of the Flood Modelling
Flood flow in the Mahanadi river reach were simulated between Hirakud dam and Naraj. The analysis of results with discussion has been presented in following headings.
1. Flood frequency analysis
2. Steady flow simulation
3. Unsteady flow simulation
4. Comparison between steady and unsteady flow simulation.
Hydrologic frequency analysis is one of the most widely used statistical techniques. In the present study, Gumbel's method has been used for hydrologic frequency analysis. Design flow has been calculated for return period of 10, 25, 50, and 100 years and presented in Table 1.
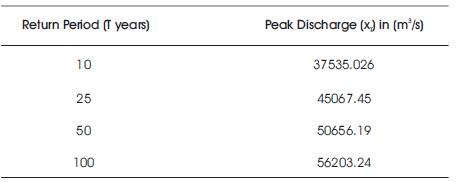
Table 1. Estimated Discharge of Mahanadi River using Gumbel's Method
Peak discharge variation 7532.24 m3/s was observed for return period of 10 to 25 years, but variation was 5588.74 3 m3/s of design discharge in next 25 years period, i.e. 25 to 50 years return period. Maximum design discharge was obtained for 100 years was 56203.24 m3 /s, which was 11% higher in comparison to 50 years return period discharge. Percentage variation of 22.80% was observed in 100 and 500 years return period. The observations shows that there is very high variation in the design discharge (20.06%). In lower range, if the return period (10 to 25 years) was observed, then it was decreased gradually from 12.40% to 11% in next 25 and 50 years occurrence interval. Maximum of 22.80% discharge variation in 100 to 500 years return period has been considered in this study. It shows that Gumbel's method of hydrologic frequency is one of the most suitable methods for design flood calculation (Machdo & Ahmad, 2006; Sapir, 2011; Song et al., 2014; Timbadiya et al., 2011).
Steady flow analysis was performed after drawing the river channel and computing cross-section, main channel, Left Over Bank (LOB), Right Over Bank (ROB) data in HEC-RAS model. Critical depth has been computed as upstream and downstream boundary condition to simulate steady flow analysis.
HEC-RAS model has been simulated under the mixed flow regime. Water flow variation along the river channel under steady flow condition is presented in Figure 3 for 5 different return periods of 10, 25, 50, and 100 years. The water flow profile of 310 km of Mahanadi lower reach from Hirakud dam to Naraj gauging station has been predicted in the HEC-RAS. The height of the water flow varies from R.L of 168.52 m at just below the Hirakud Dam to R.L of 23.97 m at Naraj Gauging station. Total relief under the study reach was 144.55 m, an average gentle slope of 0.047%, which causes very high velocity in the downstream. But due to low elevation and silt deposition, the river widens more and more and flood water overtops existing banks and inundate the entire area. This leads to a great robustious damage to the structure, life and properties in the flood spreading area. Profile of higher return period have the greater capacity to overtops banks and create havoc.
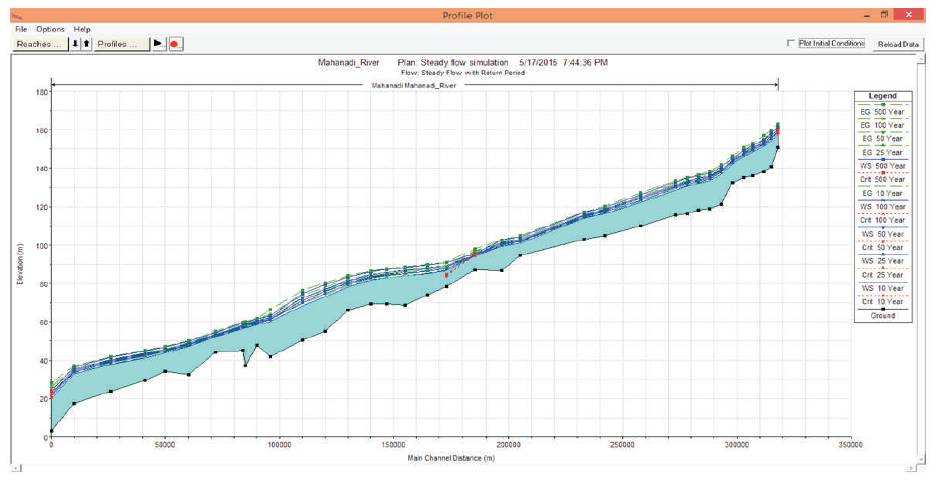
Figure 3. Water Surface Profile with Return Period along the Main Channel of Mahanadi River under Steady Flow Condition
Water surface elevation and velocity distribution across the cross-section of the Mahanadi River is obtained from the steady flow simulation. Depth of water above left and right bank of Mahanadi River with 10, 25, 50, 100, and 500 years return period and respective discharge passing through 36 cross-section of study area is presented in Table 2. Positive and negative sign indicates the height of water above and below the reduced level of the existing bank. Reduced level values with Positive sign indicate the need of modification in bank heights according to the return period discharge and location.
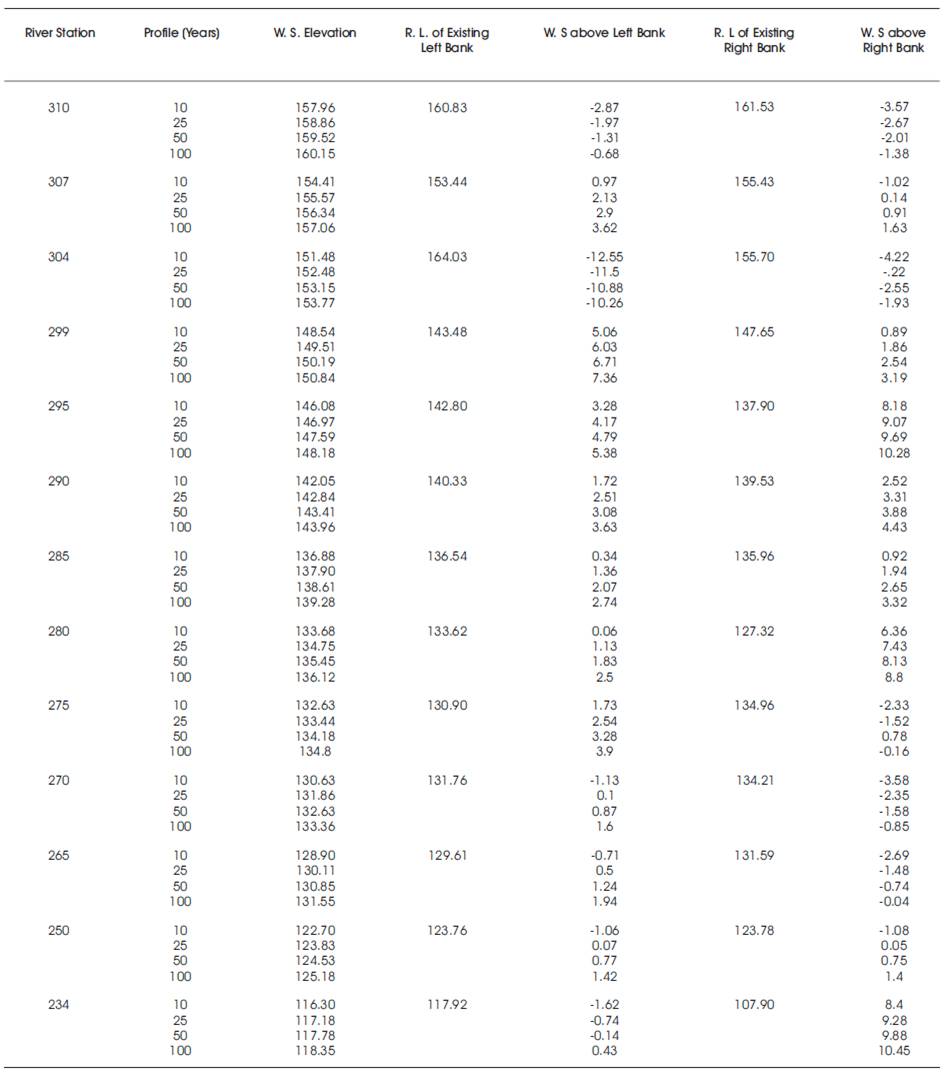
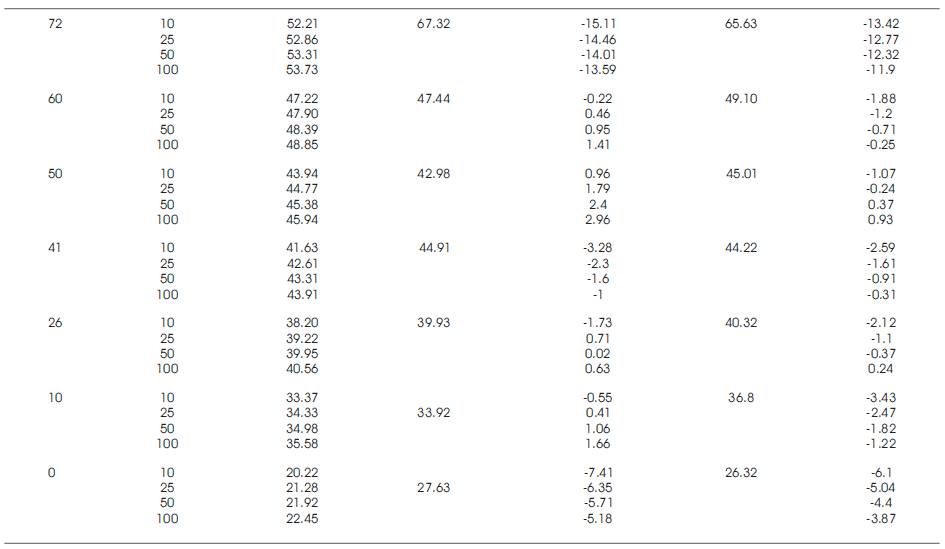
Table 2. Water Surface Elevations with the Result of Steady Flow Simulation (River Reach-Mahandi Lower)
The water height at cross-section station 307 is obtained 3 km below Hirakud dam to the river cross-section station near Kirba village. Flood water flow creates a height of 154.3, 155.46, 156.24, and 156.97 m in return periods of 10, 25, 50, and100 years, respectively. A maximum height of 17.68 m and 20.58 m at station nos. 307 and 0, respectively was observed.
It was observed that a total of 17 river bank stations out of 36 stations were affected by severe to high floods in all respective return periods of 10, 25, 50, and 100 years. The following cross-sections 307, 299, 295, 290, 285, 280, 275, 197, 165, 155, 147, 140, 130, 96, 50, 10 are found unsafe and unstable. The maximum and minimum variation of flood height above left bank in 10 years return period is 0.06 m to 5.06 m at cross-section 280 and 299, respectively. Stations 299, 295, 165, and 147 have flood height of more than 2 m above the existing bank. Considering 10 years return period flood, steady flow simulation showed that right bank area is more vulnerable to the flood as compared to left bank. Flood water produces 3.34 m more height in the right bank than the left bank.
There are nine bank stations in 25 years of return period have running flood height of greater than 2 m during flooding. The maximum and minimum variation of flood water above left bank in the 25 years of return period is 0.1 to 6.2 m.
It was observed that total 24 bank stations are flowing above the existing left bank in the 50 years of return period. The minimum and maximum variation in the height of water flowing above the existing bank is 0.02 m to 6.98 m at the bank stations 26 and 165, respectively.
In this 100 years of return period, flood flow through the cross-sections are running dynamically and overtops total 25 stations among the existing station. In this recurrence, interval flood height variation is up to 7.76 m. It is morethan the height of two stories building. This 100 years return period flood is considered for the very important structures and futuristic purpose.
There are 15, 17, 20, 21, and 29 stations in the right bank of the river which overtops its bank in its 10, 25, 50, and 100 years of return period, respectively. In 10 years of return period, three banks at 295, 280, 324 are running with 8.18, 6.36, 8.4 m flood water height.
The minimum and maximum variation of flood water above the right bank in the 25 years of return period is varied from 0.05 m to 9.28 m. Thus there is wide variation in the flow throughout the reach. 50 years of return flood shows 13 right bank under the flood water of more than 2 m. The maximum of 9.88 m height is observed of the flood water at station 234 in this return period. The right bank of the river is in more threatening condition as flood water is flowing above 4 m in 7 nos. on left river bank and 14 nos. on right bank stations, respectively in 100 and 500 years of return period. The maximum variation of flood flow touches a height of 10.45 m and 11.62 m, respectively in a century and 500 years return period.
The following stage and flow hydrograph is obtained from unsteady flow simulation. The flow hydrograph of the year 2008 was computed as boundary condition for the unsteady flow simulation. The peak flood discharge of 3 44768.94 m /s was estimated 4.2 days after the starting of flood. Stage and flow hydrograph of the study reach is shown in Figure 1. Stage hydrograph represents the stage of water at various cross-section of the 310 km Mahanadi river reach. Stage and flow hydrograph is shown in Figure 2.
In the present study, HEC-RAS model has been used to find out the minimum height of flood protection structures, such as the height of levees, dikes, flood wall, etc., to minimize the havocs of flood in flood plain. It was used for flood flow modelling and embankment protection of Mahanadi river reach from Hirakud dam to Naraj gauging station. Gumbel's method was used to predict design discharge of 10, 25, 50, and 100 years return period for the Mahanadi river. This design discharge was released from the upstream station 310 and allowed to flow through the other existing stations through the river profile. Mahanadi river profile was drawn and projected in Arc-GIS and projected Mahanadi river profile was imported to HEC-RAS as background map of the present study area. Mahanadi river flow was simulated under steady and unsteady flow condition and compared. HEC-RAS was simulated with the flood hydrograph of 2008 under unsteady flow condition. The simulated unsteady flow analysis showed that the embankment system needs heightening for almost all the existing bank stations.
Unsteady flow was simulated using a flood flow hydrograph of 2008 for the Mahanadi river, comprised a length of 310 km from Hirakud to Naraj. This flood hydrograph was used as the upstream boundary condition for unsteady flow simulation in HEC-RAS. In the year 2008, peak flood volume was nearly equal to 25 years return period discharge. Unsteady flow simulated discharge shows a dynamic change in the river flow hydraulics and a wide variation in flood water surface elevation. The peak flood was observed after 4 days and 6 hours after the starting of the flood in the Mahanadi river. The maximum duration of the flood was 9 days and 3 hours.
There are 24 bank stations in left and 20 numbers bank stations in right bank out of 36 left and right bank stations are submerged in this flood. The left bank shows a more submergence than the right bank. The maximum and minimum variation of overbank height of water is varies from 0.11 m to 10.63 m and 0.09 to 9.94 m in the left and right bank of the river, respectively. Results obtained from unsteady flow simulation showed that a maximum 10.63 and 9.94 m left and right bank, respectively. There is maximum and minimum of 3.38 m, 1.35 m, and 0.1 m, 0.04 m variation in water surface flood height in left over bank and right over bank, respectively in steady and unsteady flow simulation result. There was submergence of 67% station in left bank and 55% in the right bank out of total 36 stations at both sides and is presented in Table 3. From the above discussions this can be concluded that both banks are affected even in 10 years return flood. So, proper management have to be applied to protect the banks of the Mahanadi river. From the study it was observed that the embankment system of Mahanadi river needs to be strengthened and heightening for almost all the existing bank stations in a 310 km reach length from post Hirakud to Naraj.
Table 3. Water Surface Variation of Left and Right Bank of the Mahanadi River under Unsteady Flow Condition
Flood modelling showed wide variation in the river flow from one bank station to another in the river channel. In this present study following conclusions can be stated. From the study of 10 years return flood it is found that right bank area is more vulnerable to the flood as compared to left bank. Flood water produces 3.34 m more height in the right bank than the left bank. Therefore, the minimum height of the flood protection structures, such as levees, groynes should have to be 6 m and 9.5 m for the left bank and right bank for protecting 10 years flood and minimum height of the buildings, factories, etc. in future in the vicinity of the river banks should have a height of 10 m.
Again considering 25 years return period flood showed that the right bank produces 3.12 m more height of flood than left bank of the river and from the unsteady flow simulated result, it can be concluded that flood water surface is 10.63 and 9.94 m on the left bank and right bank stations, respectively on an average basis. So, the left bank flood height is 0.69 m higher than the right bank. In the 50 years return flood, showed right bank is 2.9 m higher than left bank on the maximum flood height. Further considering for 100 years return flood, RL of water surface was 2.69 m and 2.12 m in the right bank compared to the left bank in the maximum flood elevation.
This research will be beneficial for people of Odisha leaving in the bank and nearby flood affected area of the Mahanadi river for their safety from flooding and Govt. of Odisha can apply proper management practice to strengthen the both banks to protect the river bank from flooding and flood prone area as stated in this research. The minimum height of flood protection structure for 25, 50, and 100 years flood in the left and right bank have to be 10 and 12 m on an average basis, respectively in a 310 km of study reach.