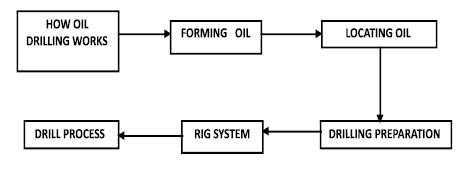
Figure 1. Steps involved in Drilling a Well
Drilling Rig safety emphasizes on the identification of Hazards during the drilling operation. Availability and Maintenance of Safety and Firefighting equipment, in line with the drilling operation emphasizes on training and awareness of the employees and workers associated with the operation. Accident reporting and investigation are seriously taken up for identifying the root cause of the accident and to avoid the reoccurrence. Special emphasis is given to Personal Protective Equipment (PPE) for protection of the employees working in critical areas. The accident dates should be collected and analyzed correctly. Risk Analysis is an effective tool to assess the various risks present in the rig, which is continuously getting sophisticated to identify possible hazards, quantify them and to implement required mitigation measures. Since the Degasser and Shale Shaker are identified as severe hazard equipments by Fire and Explosion Index (F & EI) and Event Tree Analysis (ETA), Hazard and Operability (HAZOP) study is carried out which recommends some more, in addition to the safeguards available there for the safe operation of the unit. The probabilities are also found out for the head events using ETA techniques and minimal cut sets are also found out for a single head event. This paper concludes with suitable recommendations to the drilling rig to mitigate the hazards.
A drilling rig is a machine which creates dumps (generally called as boreholes) and tubes in the ground. Drilling rigs are gigantic structured housing equipments used to drill water wells, oil wells, and natural gas extraction wells (Venna, 2008). The rig is very small where one person is enough to move. Drilling rigs used for penetrating the holes are having mobile equipment mounted on trucks, paths/trailers, and on more eternal land or marine-based structures such as offshore oil rigs. The term ‘rig’ generally refers to the complex equipment that is used to penetrate the surface of the earth's crust. While drilling a new well to find new reservoirs, it is often called as an exploratory well. There are also advanced wells, which go into already developed oil fields, to increase oil production from that developed field. Rotary drilling is the most common drilling technique where a rotating drill bit is forced down into the earth to make a hole/wellbore (Hanes, 2002). The drill bit is linked and rotated by a drill stem, which provides a passageway through which the drilling fluid such as mud is pumped. Figure 1 shows the steps involved in drilling the well.
Drilling operations have been done using an onshore rig (Chen et al., 2008). Drilling unit for drilling of oil and gas wells consists of a wellhead at the top which is mounted a crown block and a hoisting block with a hook. From the swivel, the drilling rig is put off to a Kelly stem which passes through a square or hexagonal Kelly bush into the rotary table (Skogdalen et al., 2011). The rotary table receives the power to drive it, from an electric motor. The rotary table is rotated using electric motor which passes through the Kelly bush and the rotations are transmitted to the bit. As the drilling progresses, for continuing the drilling process, the drill pipe of length around 9 meters is used. At the end of the bit life, the drill pipes are drawn out in stands and stacked on the derrick platform. Further drilling is continued after altering the bit, the drill string is run back into the hole. This process lasts till the target depth is attained by the rig.
From the ground surface, the mud coming out from the well along with the cuttings falls in a trough, passes through the solid control equipments such as shale shaker, de-sander, and mud cleaner which are used to remove the solids of different sizes while drilling to get mixed with the mud. The cleaned mud flows back to the suction tanks which is to be again pumped into the well (Lindsay et al., 2001). The drilling mud/fluid circulation is thus a continuous cyclic operation. Bentonite is described as the most suitable clay for mud which is capable of forming highly dispersed colloidal solutions. Various other chemicals are also used in mud preparation as per necessities dictated by the temperature and pressure conditions of the wells (Skorecki, 2006). The mud is continuously tested for its density, viscosity, yield point, water loss, and pH value to ensure that the drilling operations can be continued without any down hole snags.
After the drilling operations have got completed while drilling using the rig, if adequate signs of hydrocarbons are noticed, then the well is tested by perforation in the production case.
Figure 1. Steps involved in Drilling a Well
The accident statistics dates in Oil and Natural Gas Corporation Limited in the year 2007 is shown in Table 1 (Lymer et al., 1968).
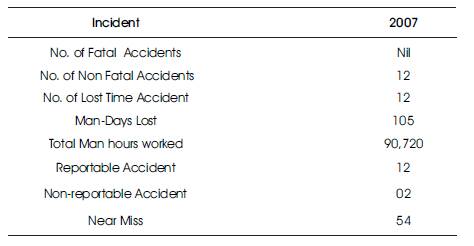
Table 1. Incident Statistics of E-760 RIG-16
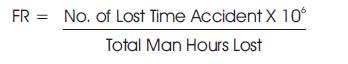
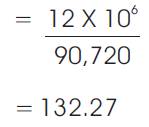
According to Occupational Safety Health Administration (OSHA), the value of frequency rate is 58.2. The value is extended in the year 2007.
Reasons:
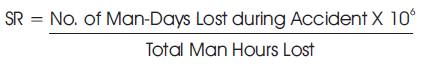
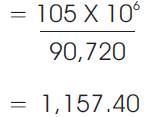
The total working man-days lost because of lost time accident injury per million of man hours worked in a year is called as Severity Rate (SR).
According to Occupational Safety Health Administration (OSHA), the value of severity rate is 490.1. The value is extended in the year 2007.
Reasons:
The accident statistics dates in oil and natural gas Corporation Limited in the year 2008 is shown in Table 2 (Montgomery, 2000; Pargeter, 1989).
Applying the values from Table 2 in equation (1),
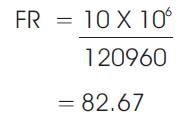
According to Occupational Safety Health Administration (OSHA), the value of frequency rate is 58.2 frequency rate. The value is extended in the year 2008.
Reasons:
Applying the values from Table 2 in equation (2),
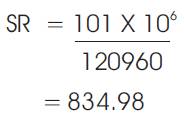
According to Occupational Safety Health Administration (OSHA), the value of Severity rate is 490.1. The value is extended in the year 2008.
Reasons:
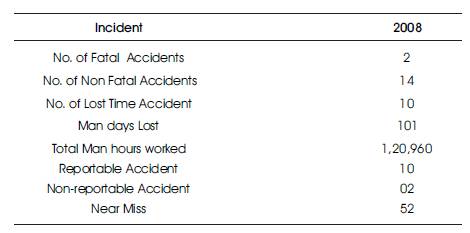
Table 2. Incident Statistics of E-760 RIG-16
Extra man power was involved for extra time, by the contractor. Contractor’s employees are not aware of the safety norms or procedure. Hence, they are not taken care by Personal Protective Equipment. Because of this, the value is increased gradually in the year 2009. The typical graph is shown in Figure 2.
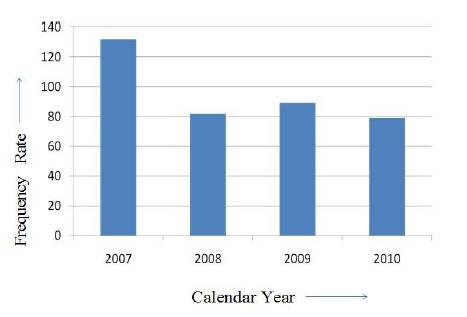
Figure 2. Frequency Rates of Accidents during the Year from 2007 to 2010
Figure 3 shows the severity rates of accidents during the year from 2007 to 2010, which tends to have good awareness safety as training was conducted to educate the awareness program. People should wear Personal Protective Equipment and follow all safety norms.
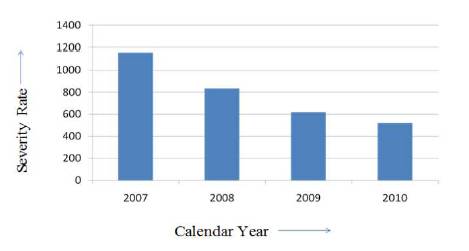
Figure 3. Severity Rates of Accidents during the Year from 2007 to 2010
The injuries occurred are as follows:
24% of the workers were injured because of not wearing hand gloves.
18% of the contractor workers were injured because of not using proper safety shoes.
22% of the workers were injured because of the lack of safety guard of machines and collision with an object.
15% of the supervisors were injured because the Personnel Protective Equipment (PPE) are not weared properly and careless walking.
10% of the tool pushers were injured because of lifting the chemicals at drill site.
11% of the riggers were injured because of poor housekeeping and slip and fall of an object.
From the accident trend, it is observed that most of the accidents are due to wrong practices of employees and there is no standard operating procedure for doing the work.
The tools used to identify the hazards and risks associated with it such as Engineering tools viz. Fire and Explosion index (F&EI), Event Tree Analysis (ETA), and Hazard Identification and Risk Assessment (HAZOP).
The relative difference between fire and explosion index and degree of hazard are as shown in Table 3.
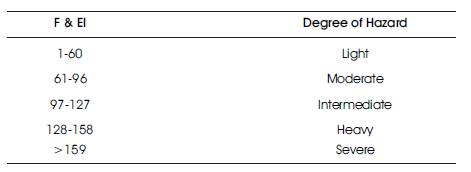
Table 3. F & EI vs Degree of Hazard
In this case, it separates air and gas such as methane and Carbon dioxide (CO2) from the mud to the surface. As per the guidelines given in the Hazard Figures and Material Factors as derived from the National Fire Protection Association (NFPA) Hand Book, the MF (Material Factor) can be determined.
Therefore, MF = 21
Table 4 describes the process range with penalty of the hazards.
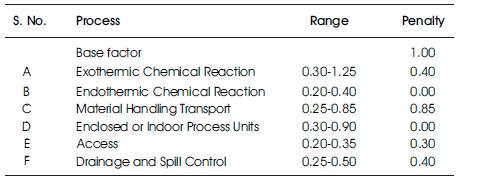
Table 4. Process with Range Penalty
Here the Range and Penalties are taken from Dow's Fire and Explosion Index Hand Book.
GPH Factor F1 = Base Factor + (Sum of 'A' to 'F')
= 1.00 + (0.40+0.00+0.85+0.00+0.30+0.40)
= 1.00 + (1.95) = 2.95
Table 5 describes the details of special process factor with the components and parameters of the architecture.
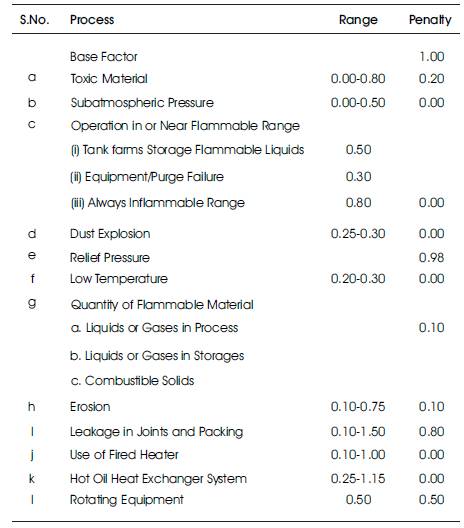
Table 5. Details of Special Process Factor
SPH Factor F2 = Base Factor + (Sum of 'a' to 'l')
=1.00 + (0.20 + 0.00 + 0.00 + 0.00 + 0.98 + 0.00 + 0.10 + 0.10 + 0.80 + 0.00 + 0.00 + 0.50)
=1.00 + (2.68)= 3.68
Finally, F & EI is calculated as follows,
F & EI = F3 * Material Factor (MF)
Here,
Unit Hazard Factor, F3 = F1 * F2
= 2.95 *3.68
= 10.856
Then by substituting the values of F3 & MF, equation (5) becomes
F & EI = 10.856 * 21
= 227.976
Therefore, F & EI for Degasser is 227.976 [SEVERE] (Since >159)
Event Tree Analysis (ETA) assesses potential accident outcomes that might be resulted following an equipment failure or to process upset known as initiating events. This analysis being with an initiating event develops the following sequences of events that discrete potential accident, accounting for both the success and failures of the safety functions as the accident progresses.
Here, Probability of Hydrogen detectors to detect the gas release = 0.99. Probability of field personnel notify and perform = 0.97. Probability of Immediate Ignition = 0.20. Probability of Delayed Ignition = 0.05. Similarly all the other probabilities for the other situations are calculated from their respective failure rates. Figure 4 shows the Event Tree Analysis, which states the sequential description of transformation of sulphate gas peak to atmosphere.
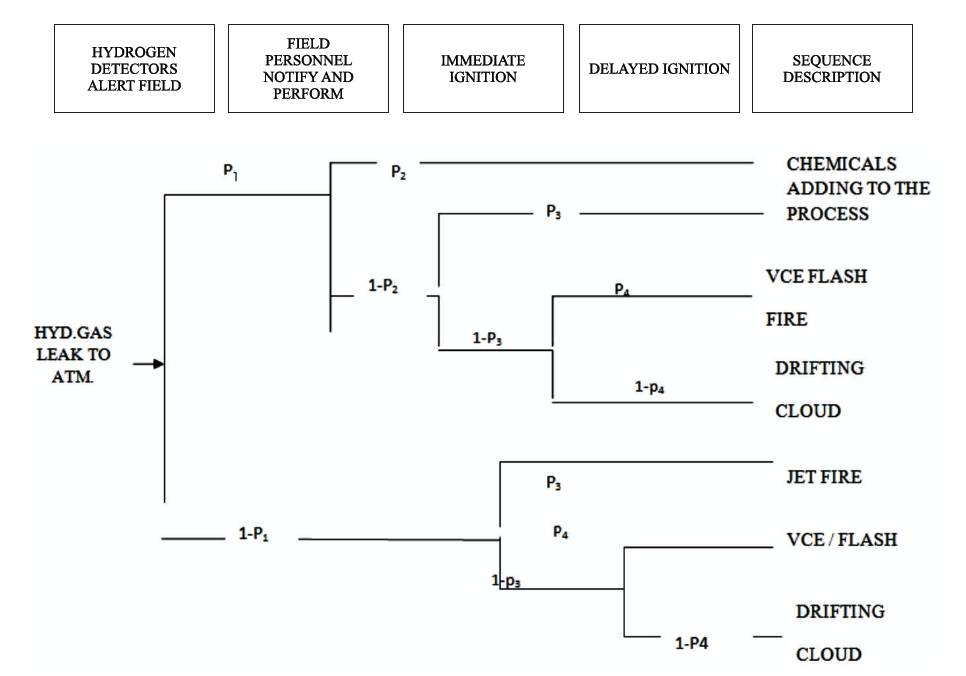
Figure 4. Event Tree Analysis (Hydrogen Sulphate Gas Leak to Atmosphere)
p5= p1*p2
=0.99 * 0.97
= 96.03%
p6= p1*(1-p2)*p3
= 0.99 *0.003*0.2
=59.4%
p7=p1*(1-p2)*(1-p3)*p4
=0.99*0.003*0.8*0.05
=11.88%
p8= p1*(1-p )*(1-p2)*(1-p3)*(1-p4)
= 0.99*0.003*0.8*0.95
= 2.25%
p9= (1-p1)*p3
=0.01 *0.2
=0.002%
p10= (1-p1)*(1-p3)*p4
= 0.03 * 0.8 * 0.05
= 1.2%
p11= (1-p1)*(1-P3)*(1-P4)
= 0.01*0.8*0.95
= 7.6%
Thus, the various probabilities are calculated for the various outcomes in the event tree taking Hydrogen Sulphate Gas Leak to atmosphere as an emergency scenario. Hence, the probability of p1 (hydrogen detectors alert field) and p2 (field personal notify and perform) are very severe. The probability values of p7 , p8 , p9 are low. i.e. it may cause severe rate, after polluting the environment.
For any manufacturing industry to be a successful firm, it has become important to identify the hazards, to measure the associated risks and to bring the risks to tolerable level. Table 6 shows the statistical analysis of HIRA
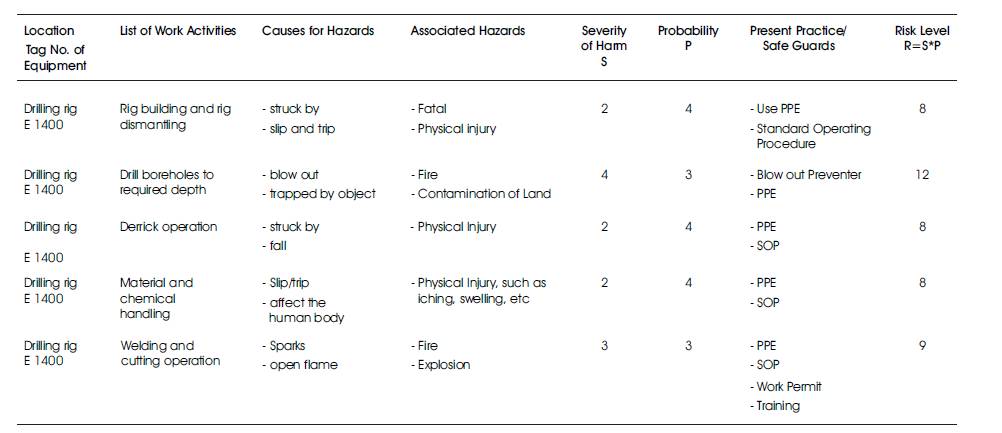
Table 6. Statistical Analysis of HIRA
For smooth operation of any drilling rigs, fire and safety equipments play a vital role in the drilling industry. Table 7 shows blow out preventer details of hazop study.
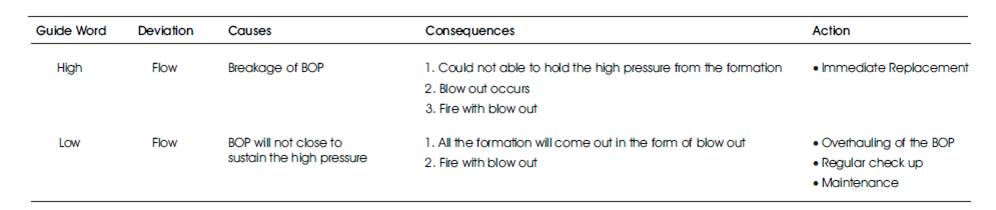
Table 7.HAZOP Study on Blow out Preventer
The findings that are identified in the industry so far are as given below:
All equipment tools and rods should be properly secured during transport. Hydraulic leveling jacks should be set before raising the mast. Drilling clearance permit shall be obtained from base personnel. Approved electrically resistant footwears should be provided. Maintaining safe distance away from the augers. The mast must be lowered, if possible, to make repairs or without any obstruction. Approved eye and hearing protection should be used. First aid training should be imparted to the employees. Special procedure should be implemented when drilling in known natural gas location such as mud procedures and BOP. All mechanical equipments must be well calibrated. Drill rods and Augers stored and transported in racks shall be blocked to prevent shifting.
Drilling rig thus plays a significant role at the operational stages of the oil and gas industries, as it is a vital tool for decision making by public, government, and safety professionals. F & EI are done initially on all the major severe equipments which are involved in hazardous operations and Index results are obtained. Also, suitable recommendations are also given to the safe running of the rig. The probability of initiating event of Hydrogen Sulphite gas release to the atmosphere is also analyzed using Event Tree, as it is calculating the various possible outcomes. It also helps to implement appropriate safeguards and take remedial measures for the prevention of accidents.