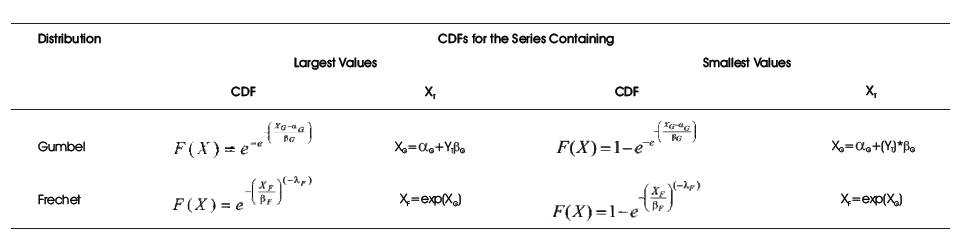
Table 1. CDFs of Gumbel and Frechet Distributions (Vivekanandan et al., 2012)
Assessment of rainfall and temperature for a desired return period is of utmost importance for planning and design of hydraulic structures and also for installation of nuclear power projects. This can be achieved through Extreme Value Analysis (EVA) by fitting of probability distribution to the observed series of meteorological data. This paper illustrates the study on EVA of rainfall and temperature recorded at Mandla observatory adopting Gumbel and Frechet distributions. The annual series of 1-day maximum rainfall, maximum and minimum temperature derived from daily data are used for EVA. The parameters of the probability distributions are determined by order statistics approach and used in EVA. The adequacy of probability distribution is quantitatively assessed by using Goodness-of-Fit (GoF) test viz., Kolmogorov- Smirnov and Diagnostic test, using correlation coefficient and root mean squared error. The GoF and Diagnostic tests’ results show that Gumbel is better suited probability distribution for EVA of rainfall and temperature for the region under study.
Extreme Value Analysis (EVA) of observed meteorological data relating to the geographical region where the project is located is a basic requirement for arriving at structural and other related design parameters for the project (IAEA, 2003). Depending on the size and the design life of the structure involved, the different return periods for the identified design criteria are generally stipulated (Ang and Tang, 1984; Vivekanandan, 2014). In this context, as per (AERB 2008) guidelines, the 1000-year return period Mean+SE (where Mean denotes the estimated value (XT) and SE the Standard Error) values will be generally considered for arriving at a design value of 1- day maximum rainfall and maximum temperature, whereas Mean-SE value for minimum temperature for installation of Nuclear Power Projects ( NPPs) (Vivekanandan, 2017). For designing of hydraulic structures other than NPPs, the 1000-year return period Mean+(1.96)SE value of 1-day maximum rainfall and maximum temperature, whereas Mean-(1.96)SE value of minimum temperature will be considered. For arriving at such design values, a standard procedure requires to be adopted for analysing historical meteorological data over a period of time (year) (Vivekanandan, 2014).
A number of probability distribution functions are available for EVA. Out of which, Gumbel and Frechet distributions are widely applied for EVA of rainfall and temperature. Based on the intended applications and the variate under consideration, parameter estimation procedures such as Method of Moments (MoM) and Maximum Likelihood Method (MLM) are used for determination of parameters of the distributions (Mujere, 2011). Generally, the EVA results obtained from MoM may not give satisfactory results as (i) it is difficult to assess true information about the shape of a distribution by third and higher order moments; and (ii) the estimated parameters of distributions were biased in comparison to procedures (Ghorbani et al., 2010). MLM is based on the maximum likelihood function of probability distributions. In MLM, the parameters of distributions will be initially determined by equating the partial differential equation of each variable by considering number of likelihood function to zero (Rao and Hameed, 2000). MLM is based on iterative procedure which requires more time and enormous efforts for determining the optimum values of parameters of the distributions. To overcome these issues, AERB guidelines suggested that the Order Statistics Approach (OSA) could be considered for determination of parameters of Gumbel and Frechet distributions, and hence applied.
In the recent past, number of studies have been carried out by researchers adopting different probability distributions for EVA of rainfall and temperature. (Hughes et al 2007) carried out statistical analysis using Generalized Extreme Value (GEV) distribution and time-series models for minimum and maximum temperatures in the Antarctic Peninsula. Varathan et al. (2010) found that the Gumbel (i.e., EV1) distribution is the best fitting distribution to analyse the annual maximum of rainfall of Colombo district. AlHassoun (2011) carried out a study on developing empirical formulae to estimate rainfall intensity in Riyadh region using EV1, Log Normal, and Log Pearson Type-3 (LP3). He concluded that the LP3 distribution gives better accuracy amongst three distributions studied in estimation of rainfall intensity. Baratti et al. (2012) carried out flood frequency analysis on seasonal and annual time scales for the Blue Nile River adopting EV1 distribution. Esteves (2013) adopted EV1 distribution to estimate the extreme rainfall depths at different rain-gauge stations located in southeast part of United Kingdom. Rasel and Hossain (2015) applied EV1 distribution for development of intensity duration frequency curves for seven divisions in Bangladesh. Vivekanandan (2015) applied EV1 and EV2 (i.e., Frechet) distributions for EVA of rainfall, temperature, and wind speed for Kanyakumari region. He found that the EV1 (OSA) is better suited probability distribution for EVA of rainfall and temperature, whereas EV2 (OSA), for EVA of wind speeds in Kanyakumari region. Vivekanandan (2016) carried out statistical analysis of rainfall data using EV1 distribution for estimation of peak flood discharge for ungauged catchments of Bhul and Manjuhi Khad, Himachal Pradesh.
Generally, when different probability distributions are used for EVA, a common problem that arises is how to determine which distribution fits the best for a given set of data. For this purpose, Goodness-of-Fit (GoF) test viz., Kolmogorov-Smirnov (KS) is applied for checking the adequacy of fitting of probability distributions adopted in EVA (Annis, 2009). However, the results of GoF tests offered diverging inferences which lead to adopt diagnostic test using Correlation Coefficient (CC) and Root Mean Squared Error (RMSE) to aid the selection of suitable probability distribution for EVA. Thus, there exist research efforts in assessing the extreme values of rainfall and temperature (maximum and minimum), and for aiding design parameter of interest, and the present work is an effort in this direction. This paper details the procedures involved in assessing the suitable probability distribution for EVA of rainfall and temperature through GoF and diagnostic tests with illustrative example.
The effort made in this study is to assess the applicability of Gumbel and Frechet probability distributions adopted in EVA of rainfall and temperature. The Cumulative Distribution Functions (CDFs) of Gumbel and Frechet distributions for the series containing largest and smallest values are presented in Table 1 (Vivekanandan et al., 2012).
In Table 1, αG and βG are the location and scale parameters of Gumbel distribution. The term XT indicates the estimated value of X for a return period (T) that is computed from XG or XF . The reduced variate YT and (YT)* are defined by YT =-ln(-ln(1-(1/T))) and (YT)*=-ln(-ln(1/T)). Similarly, βF and lF are the scale and shape parameters of Frechet distribution. Based on extreme value theory, Frechet distribution can be transformed to Gumbel distribution through logarithmic transformation. Under this transformation, the parameters of Frechet are computed from βF = exp(αG) and lF = 1/ βG (Lieblein, 1974, Vivekanandan et al., 2012). The upper and lower confidence limits (LCL and UCL) of the estimated value at 84.13% level are obtained from LCL=XT -SE and UCL=XT +SE. Likewise, the values of LCL and UCL at 95% level are obtained from LCL=XT -(1.96)SE and UCL=X +(1.96)SE. AERB guidelines described that XT +SE will represent the value that will not be Texceeded by 84.13% of the events having a particular return period. Likewise, X +(1.96)SE will represent the value that will not be exceeded by 95% of the events having a particular return period (Vivekanandan et al., 2012).
Table 1. CDFs of Gumbel and Frechet Distributions (Vivekanandan et al., 2012)
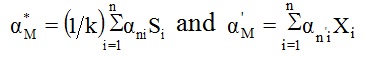
The parameters of Gumbel distribution using OSA are,

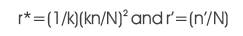
where, r* and r¢ are proportionality factors, which can be obtained from the selected values of k, n, and using the relations r*=kn/N and r’=n’/N (Vivekanandan et al., 2012). Here, N is the sample size which contains basic data that are divided into k sub groups of n elements each leaving n’ remainders. In OSA, α*M and β*M are the distribution parameters of the groups and α’M and β’M are the parameters of the remainders, if any. These can be computed from Equations (2 and 3), which are as follows.
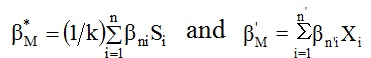
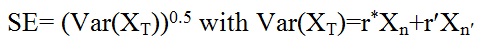
where 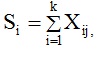 i=1, 2, 3, .., n. Here, Xi is the ithobservation in the remainder group having n’ elements, Xij is the jth observation in the jth group having elements (Lieblein, 1974). Table 2 gives the weights of αni and bni used in determination of parameters of the distributions by OSA (Vivekanandan et al., 2012). The parameters are used to estimate the values for different return periods. The Standard Error (SE) on the estimated value for a return period (T) is computed from Equations (4 and 5), which are as follows.
Here, Xn and Xn' are defined by the general form as Xn=(An(YT)2+BnYT+Cn)(bG)2. The coefficients of An , Bn , and Cn for different values of n are presented in Table 3 (Vivekanandan et al., 2012).
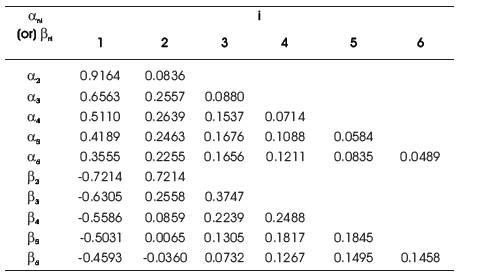
Table 2. Weights αni and βni used in OSA (Vivekanandan et al., 2012)
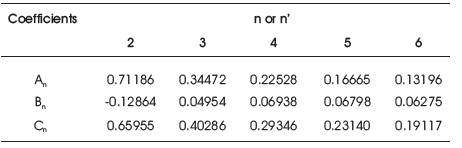
Table 3. Coefficients of An , Bn , and Cn used in Estimation of SE(Vivekanandan et al., 2012)
The KS test statistic is defined by,
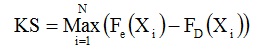
Here, Fe(Xi)=(m-0.35)/N is the empirical CDF of Xi , where, m is the rank assigned to the observations arranged in ascending order viz., X1
Theoretical descriptions of CC and RMSE are given by,
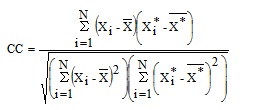
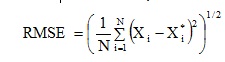
where, Xi is the recorded value of ith observation, X*i is the estimated value of ith observation by probability distribution, 
is the average value of X i is the average value of Xi and
 is the average valu of X* i . The distribution has less RMSE and better CC is considered as better suited probability distribution for EVA (Chen and Adams,2006 , Vivekanandan et al., 2012).
In this paper, a study on EVA of rainfall and temperature adopting Gumbel and Frechet distributions was carried out. The annual series of 1-day maximum rainfall (AMR), maximum temperature (AMAXT) and minimum temperature (AMINT) was derived from the daily data, and used for EVA. Daily rainfall, and temperature data observed at Mandla observatory for the period 1969 to 2006 was used. The Mandla observatory is located between the latitude of 22o 35 N and longitude of 80o 22 E in the Mandla region of Bhopal district, Madhya Pradesh, India. The descriptive statistics of the observed values of AMR, AMAXT and AMINT are presented in Table 4 (Vivekanandan et al., 2012).
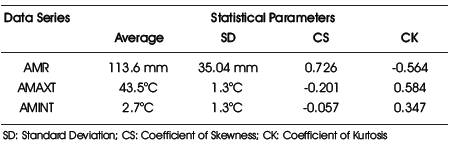
Table 4. Descriptive Statistics of Observed AMR, AMAXT, and AMINT
The procedures described earlier for estimating 1-day maximum rainfall, maximum and minimum temperature have been implemented adopting computer code and used in EVA. The program computes the (i) parameters of probability distributions; (ii) rainfall and temperature estimates with SE for different return periods; and (iii) GoF and diagnostic test values.
The estimated values of rainfall and temperature (maximum and minimum) together with SEs for different return periods obtained from Gumbel and Frechet distributions (using OSA) are presented in Table 5. From EVA of AMINT data, it was observed that the EV2 is not found to be feasible for fitting and therefore EVA results of EV2 for minimum temperature are not presented in Table 5.
From Table 5, it is noted that the estimated 1-day maximum rainfall by Frechet distribution is relatively higher than the corresponding values of Gumbel for return periods from 10-year and above. Also, from Table 5, it is noted that the difference between the estimated maximum temperature for different return periods using Gumbel and Frechet distributions vary from 0.1 oC to 0.8 oC. The plots of observed and estimated 1-day maximum rainfall with confidence limits (84.13% and 95% levels) using Gumbel and Frechet distributions are presented in Figures 1 and 2 respectively. From EVA results of rainfall, it is noted that the 1-day maximum rainfall obtained from EV2 is higher then the corresponding values of EV1 and thus the plots of EV2 are not clubbed with the plots of EV1. Also, from Figures 1 and 2, it can be seen that the fitted curves are in the form of linear trend for EV1, whereas in the form of an exponential trend for EV2.
The estimated values of maximum temperature obtained from Gumbel and Frechet distributions together with confidence limits (84.13% and 95% levels) are presented in Figures 3 and 4 respectively. Similarly, the plots of estimated minimum temperature together with lower confidence limits (84.13% and 95% levels) using Gumbel distribution are presented in Figure 5. As the upper confidence limits of the estimated values of minimum temperature are not adding any significance in EVA of ATMIN, the corresponding plots are not presented in Figure 5.
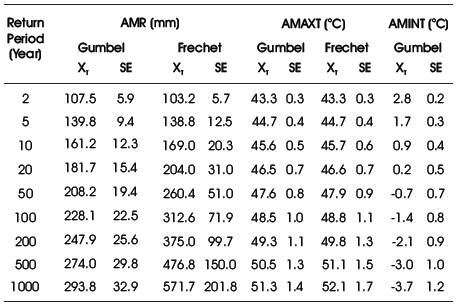
Table 5. Estimated Values of Rainfall and Temperature with SEs for Different Return Periods using Gumbel and Frechet Distributions
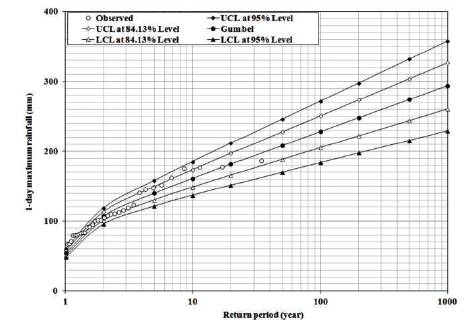
Figure 1. Plots of Observed and Estimated 1-day Maximum Rainfall with Confidence Limits by Gumbel Distribution
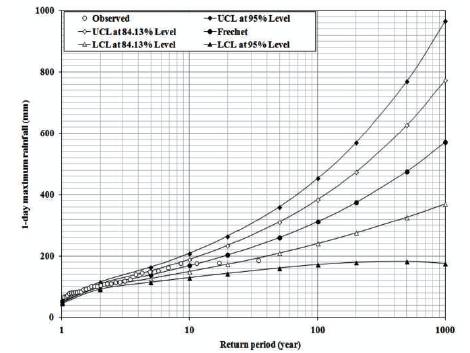
Figure 2. Plots of Observed and Estimated 1-day Maximum Rainfall with Confidence Limits by Frechet Distribution
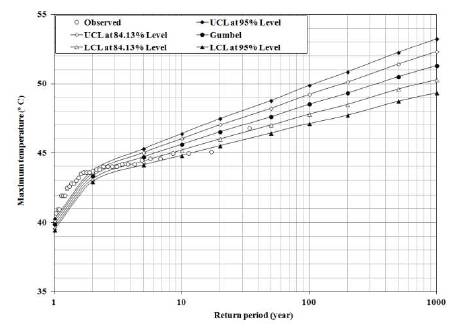
Figure 3. Plots of Observed and Estimated Maximum Temperature with Confidence Limits by Gumbel Distribution
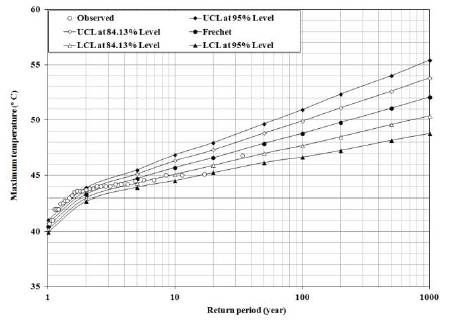
Figure 4. Plots of Observed and Estimated Maximum Temperature with Confidence Limits by Frechet Distribution
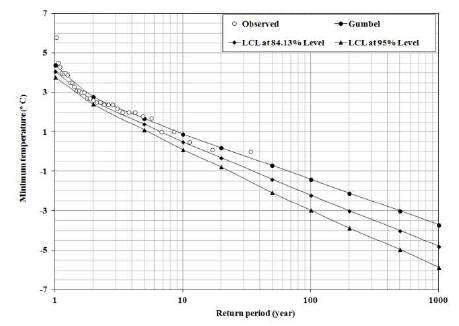
Figure 5. Plots of Observed and Estimated Minimum Temperature with Lower Confidence Limits by Gumbel Distribution
The adequacy of fitting Gumbel and Frechet distributions adopted in EVA of rainfall and temperature was performed by GoF test using KS test statistic, as described earlier. The KS test statistic values are computed from Equation (6), and are presented in Table 6.
From Table 6, it may be noted that the computed values of KS statistic by Gumbel and Frechet distributions are less than the critical value (0.221) at 5% level of significance, and at this level, both distributions are acceptable for EVA of rainfall and temperature.
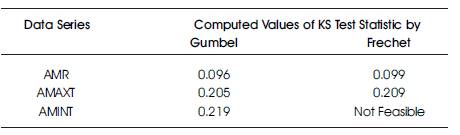
Table 6. Computed Values of KS Test Statistic by Gumbel and Frechet Distributions
A diagnostic test was applied for assessing the adequate probability distribution for EVA of rainfall and temperature. The CC and RMSE values of Gumbel and Frechet distributions are computed from Equations (7 and 8), and are presented in Table 7. From diagnostic test results, it is noticed that the RMSE values for the series of AMR and AMAXT given by Gumbel are minimum when compared to the corresponding values of Frechet for Mandla. Also, from Table 7, it is noticed that the values of CC and RMSE obtained from Gumbel distribution for the series containing AMINT are 0.966 and 1.6 oC respectively, and not comparable with the corresponding values of Frechet because of its non-feasibility of fitting to the observed data. For AMR and AMAXT, it is found that there is generally good correlation between the observed and estimated values by Gumbel and Frechet distributions.
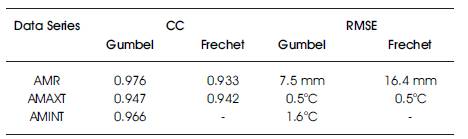
Table 7. CC and RMSE given by Gumbel and Frechet Distributions
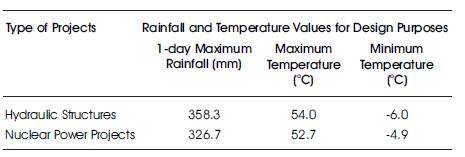
Table 8. Suggested Values of Rainfall and Temperature for Design Purposes
Based on the evaluation of EVA results obtained from Gumbel and Frechet distributions through GoF and diagnostic tests, the study confirmed that the Gumbel (using OSA) is better suited probability distribution for EVA of rainfall and temperature (maximum and minimum) for Mandla. The values of 1-day maximum rainfall, maximum and minimum temperature obtained from Gumbel (using OSA) distribution recommended for planning and designing of hydraulic structures and installation of nuclear power projects are presented in Table 8.
The paper presented the study on assessing the adequacy of Gumbel and Frechet distributions (using OSA) adopted for EVA of rainfall and temperature of Mandla through GoF and diagnostic tests. The following conclusions were drawn from the study.
The author is grateful to Dr. (Mrs.) V. V. Bhosekar, Additional Director & Director In-charge, Central Water and Power Research Station, Pune, India for providing the research facilities to carry out the study. The author is thankful to M/s Nuclear Power Corporation of India Limited, Mumbai for making available the rainfall and temperature data used in the study.