Table 1. Level of variables
Laser Beam Machining (LBM) is one of the most advanced machining processes that is used for shaping, cutting and machining the virtually whole varieties of engineering materials. In LBM, the surface roughness and kerf taper significant factors affects the product characteristics and quality of the product. During this analysis work, the impact of process parameters like cutting speed, frequency and Gas pressure surface roughness (Ra) of steel (AISI 321 stainless steel) material in laser cutting machining are studied. L9 orthogonal array was generated for fractional factorial design (Taguchi analysis) for better understanding of the interaction among the process parameters. The values of surface roughness for steel were calculated by Regression model equations, and Taguchi Analysis and Genetic Algorithm were employed to the parametric analysis of the experimental data. Taguchi analysis gives the optimum values of surface roughness and kerf taper, which are 2.2981 μm and 0.1637° respectively. Genetic algorithm was used for providing a set of optimum values for both outputs simultaneously.
Laser (An acronym for Light Amplification by Stimulated Emission of Radiation) has become a necessary tool in modern technology. There are only a few fields untouched by the laser in today's world. As a result of its distinctive properties-specifically, high power density, mono-chromaticity, coherency, and directivity - lasers have a range of applications that embrace materials process, medicine, analysis and development, communications and measurements to call a few. LBM is one among the advanced machining processes that are used for shaping a whole variety of engineering materials. There are many applications of LASER which include cutting of metals and non-metals, soft and Difficult To Machine (DTM) materials. The laser is directed at the specified surface and wrapped around to cut the materials within the desired form. LBM is a nonconventional machining method, so it needs high investment and offers a poor efficiency; therefore, great attention is required for higher utilization of the resources [1,6]. The values of process parameters are determined to yield the specified product quality and conjointly to maximize the method performances. In LBM, there are several factors like beam parameters, material parameters and machining parameters that affect the assorted quality characteristics, e.g. surface roughness, Heat Affected Zone (HAZ), recast layer, etc. The Design experimental approach is used as a superior approach from other approaches, as a result of its systematic and scientific manner of coming up with the experiments, assortment, and analysis and the information with a restricted use of accessible resources [3]. Nd: YAG and CO2 were most generally used for LBM applications. The high power laser, Nd: YAG laser were solely accessible in a periodical mode, whereas a CO2 laser was accessible both in periodical and continuous (CW) modes. Now-adays, energy laser varieties are accessible periodically and clockwise [2, 3].
There are many advantages of laser cutting over mechanical cutting, since the laser beam performs the cut. There is no exact contact with the material of the tool, thus contaminants cannot enter or implant into the material. Laser cutting will produce high-quality cutting edges, complex cutting edges, cutting many parts at the same time, and provides a clean cutting edge, that needs negligible finishing, similarly as low edge load throughout cutting, which can scale back distortion [7,13].
The primary focus of the research in Laser assisted cutting nowadays is:-
Sivarao et al. [4] have gone through an experiment that investigated the impact of surface roughness on steel having a thickness 6 millimeters with numerous parameters like cutting speed, frequency and duty cycle and an RSM-based model equation has been found for this experiment. They found that surface roughness was extremely tormented by cutting speed and duty cycle; thus, these two are the foremost affecting parameters and concluded that, at high cutting speed and low duty cycle, best roughness are very often achieved. Once when a comparison of information between the calculated and the determined values for surface roughness were done, the deviation error between the expected and the determined values is not over than 15%. It implies that a mathematical model obtained for surface roughness is reliable. During this analysis work, the impact of method parameters like cutting speed, frequency and duty cycle surface roughness (Ra) of the steel material in optical laser cutting is mentioned. L-27 orthogonal array was selected for full factorial design to the higher understanding of the interaction between the method parameters. The values of surface roughness for steel were calculated as mistreatment model equations and Central Composite style of the response surface methodology is employed to the parametric analysis [19].
In 2008, Avanish Kumar Dubey worked on Laser Beam Cutting (LBC) process. It has been found that, the kerf width during LBC is not uniform along the length of cut, and, therefore, the unevenness is more in the case of the pulsed mode of LBC [8, 14]. In this paper, two kerf qualities such as, kerf deviation and kerf width have been optimized at the same time using Taguchi quality loss function throughout the pulsed Nd: YAG laser-assisted cutting of aluminium alloy sheet (0.9 mm thickness), which is very difficult to cut the material. A suitable improvement in kerf quality has also been achieved during the experiment [8,14,15].
In 2011, Koji Hirano and Remy Fabbro worked on striation generation mechanism on inert gas laser cutting of steel using experiments on hydrodynamics of the melt layer on the kerf front [12, 16-18]. Melt flows in the area of kerf side, and kerf front displays the instability in various velocity ranges. They used 8 kW disk laser beam which was focused on to a 3-millimeter thick low carbon steel with beam diameter 1.7 mm. The pressure of element was set to 2.5 bars and the cutting speed was varied from one to 6 m/min. They determined the melt dynamics, which exhibited their instability and that depends upon the cutting velocity too. In lowest velocity ranges (v < 2 m/min), the melt flow in the peach, the central (mid) and the end region of the kerf front are unstable. In intermediate region, the velocity varies (2.1 m/min < v < 6 m/min), in central flow becomes stable, while the side region remains unstable. The unstable region becomes an additionally restricted to the side with the increase of v, until the whole region becomes stable at v = 6 m/min. The determined instability may be explained by a mixture of thermal instability of melting method and hydro dynamical instabilities due to surface tension.
In 2012, Ruben Phipon & B.B. Pradhan have worked on control Parameters optimization of laser beam Machining using Genetic algorithm. Their work was with a Heuristic analyzer using the GA (Genetic Algorithm) for optimizing the cut quality, specifically kerf taper and surface roughness throughout the pulsed Nd: YAG laser cutting of thin Al-alloy sheet for straight profile is performed. The process input parameters considered are oxygen pressure P, pulse width, pulse frequency F and cutting speed v. The experimental procedure is designed/ fabricated. The mathematical models giving the desired relationship between the desired responses and the control parameters are established using the Response Surface Methodology. Finally, the Genetic algorithm is applied to search the optimum parametric values for the optimum responses. Using Genetic algorithm, minimum Kerf taper angle obtained is 0.14695° that is 0.313° less in magnitude than the experimentally measured value. Also, the minimum surface roughness predicted using Genetic algorithm is 1.2625 μm which is 0.3375 μm better in value compared to the experimentally measured value in the past experiments [11].
In 2013, M. Lakshmi Chaitanya & A. Gopal Krishna have worked on Multi-objective optimization of laser beam Cutting method [9,10]. The material used for the experiment was Silicon Carbide (SiC) reinforced aluminum metal matrix composite. It is the most advantageous engineering material due to their properties such as, low weight, heat-resistant, wearresistant and low cost. Their work was conducted about the machining conditions involving the minimization of HAZ and Ra. The mathematical models for the HAZ and Ra are developed through the Response Sur face Methodology (RSM). A very widespread evolutionary algorithm, Non-dominated Sorting Genetic Algorithm II (NSGA-II), was used to retrieve the multiple optimum sets of the input variables.
In 2014, K. Venkatesan & R. Ramanujam worked on an experimental investigation of Cutting Forces and Temperature in laser beam cutting of Inconel 718 using Taguchi technique [9]. This paper was discussed regarding the L9 orthogonal array, S/N ratio, and ANOVA that were adopted for locating the optimum process parameter for the performance measures of feed force (Fx), thrust force (Fy) and cutting force (Fz) [13] .
Within the last decade, the most rapidly growing use of laser cutting was under Cutting and biomedical purposes. The unique qualities of laser cut surfaces add elegance to food and cosmetic packaging that would be tough to achieve in any other way except laser assisted packaging [5].
It is evident from the review of literature that:
On the basis of literature survey, the objectives of the thesis are listed below:-
Based on the screening experimental results, the Taguchi method was selected for the DOE. Within the Taguchi method, the experiments are performed as per standard orthogonal arrays, while the optimum level of process input parameters (control factors) is decided by a statistical analysis of the experimental results. The tool used in the Taguchi method is the Orthogonal Array (OA).
The OA defines the value of the parameters for each experiment. The Taguchi method employs a generic Signal-to-Noise Ratio representing the magnitude of the mean of a process compared to its variation. These S/N ratios measure the effect of noise factors on performance characteristics. S/N ratios take into account both the amounts of variability in the response data and the closeness of the average response to the target. S/N ratios are calculated for each level value. Therefore, the optimal level of the process parameters is the level with the greatest S/N ratio, since this indicates the situation where the performance of the process is maximized, and the noise is minimized [7].
Genetic Algorithms (GA) were initially introduced by John Holland within the Seventies (Holland, 1975) as a result of investigations into the possibility of computer programs undergoing evolution within the genetic sense. GAs are a part of a broader soft computing paradigm called organic process computation. They attempt to make better solutions through a method almost like biological evolution. This involves following the principles of survival of the fittest, and cross-breeding and mutation generate higher solutions from a pool of existing solutions [17].
Genetic algorithms have been found to be capable of the search for solutions for an excellent variety of issues that no acceptable algorithmic solutions exist. The GA methodology is especially suited for an improvement, and a problem-solving technique within which one or more excellent answers are a probe for in a solution space consisting of a large variety of options. The genetic algorithm reduces or tries to reduce the research space by regularly evaluating the current generation of candidate solutions, discarding the ones stratified as poor, and manufacturing a new generation through crossbreeding and mutating those stratified as good. The ranking of candidate solutions is finished using some predetermined measures of goodness or fitness.
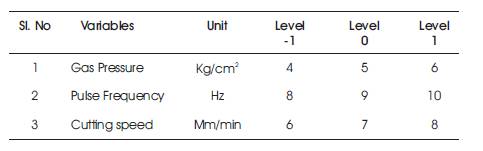
Table 1 shows the level of variables like gas pressure, pulse frequency and cutting speed. The levels of gas pressure are 4, 5 and 6 kg/cm2 respectively. The level of pulse frequencies are 8, 9, 10 Hz respectively. The level of cutting speed are 6, 7, 8 mm/min respectively. After selecting the L9 orthogonal array with appropriate settings, the Table 2 is obtained with blank spaces for taper angle value and surface roughness value.
Table 1. Level of variables
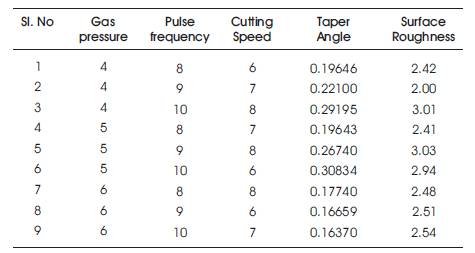
Table 2. L9 Orthogonal Array
After the experimental work, these values are filled in the blank space and the optimization work has been done accordingly. Main effect plots for SN ratio and main effect plot for the means are obtained by the optimization, which shows that A1B1C2 are the most optimized value for Ra, and A3B1C2 are the most optimized values for Taper angle as shown in Figure1.
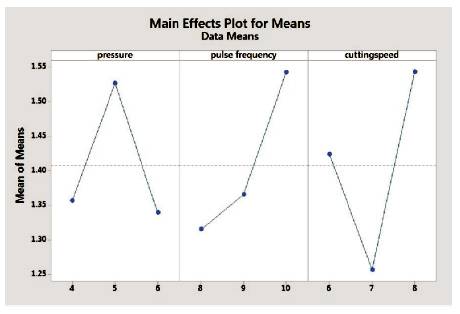
Figure 1. Main Effects Plot for Means for Surface Roughness
Figure 1 shows the value of mean for the means of input parameters. The maximum values of mean of the means are for Gas pressure at A2 i.e. 5 Kg/cm2 , for pulse frequency at B3 i.e. 10 Hz and for cutting speed at C3 i.e. 8 mm/min.
Figure 2 shows the S/N ratio for the optimization of surface roughness. Gas pressure A1 i.e. 4 Kg/cm2 has a maximum value of S/N ratio. Pulse frequency B1 i.e. 8 hertz has maximum value. Cutting speed, the maximum value of S/N ratio is at C2 i.e. at 7 mm/min. These values shows that the surface roughness will be at its minima with the set of values of A1B1C2. Maximum value of S/N ratio is for the cutting speed which is -4.287, so cutting speed is the most significant factor in case of surface roughness.
Table 3 shows the values of the parameters at the different points which are shown in the Figure 2. It shows the response value of S/N ratio for the value of surface roughness. These are the tabulation form of the values shown in the curves of Figure 2.
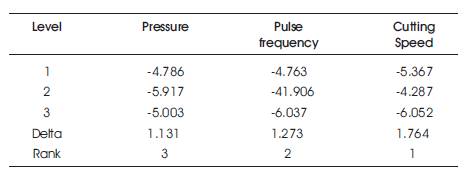
Table 3. Response Table for S/N Ratios for Ra
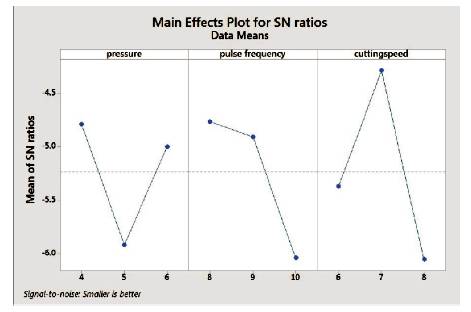
Figure 2. S/N Ratio for Surface Roughness
Figure 3 shows the S/N ratio for the optimization of Taper angle in degree. Gas pressure A3 i.e. 6 Kg/cm2 has maximum value of S/N ratio. Pulse frequency B1 i.e. 8 hertz has maximum value. For cutting speed, the maximum value of S/N ratio is at C2 i.e. at 7 mm/min. These values shows that the surface roughness will be at its minima with the set of values of A3B1C2. Maximum value of S/N ratio is for gas pressure which is 15.44, so gas pressure is the most significant factor in case of taper angle.
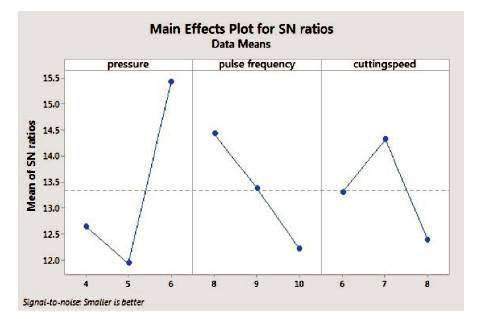
Figure 3. S/N Ratio for Kerf Taper
Table 4 shows the value of S/N ratio at different points for the cutting parameters while minimizing the value of taper angle. These are the tabulation form of the values shown in the curves of Figure 3.
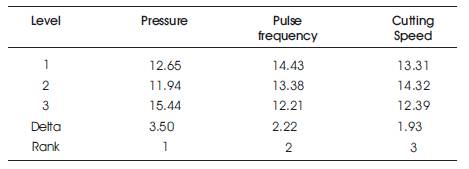
Table 4. Response Table for S/N Ratios for Ta
Figure 4 shows the main effects plot for the means for taper angle. The maximum values of mean are for Gas pressure at A2 i.e. 5 Kg/cm2 , for pulse frequency at B3 i.e. 10 Hz and for cutting speed at C3 i.e. 8 mm/min.
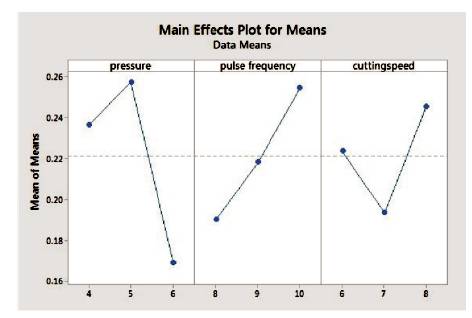
Figure 4. Main Effects plot for Means for Taper Angle
Genetic algorithm is used for multi-objective optimization. By using genetic algorithm, both the objective functions i.e. surface roughness and taper angle are optimized simultaneously. For this optimization, MATLAB 2014 is used.
Equations used for the computation are given below:
Ra = -0.00 + 0.017 pressure + 0.195 pulse frequency + 0.208 cutting-speed
Ta = 0.022 - 0.0336 pressure + 0.0323 pulse frequency + 0.0109 cutting-speed
Figure 5 shows the pareto chart obtained from the genetic algorithm. In this chart, two objective functions are taken which are chosen for optimization on different axis. After 167 iterations, the optimization curve for the objective functions were obtained. On this curve, the set of optimum values can easily be taken.
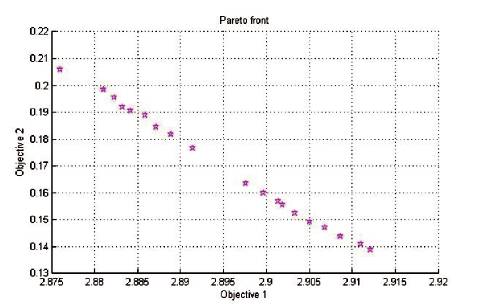
Figure 5. Pareto Chart obtained from genetic algorithm
Optimistic plot in Figure 6 shows the exact values of the parameters after optimization. So optimum results are given below:
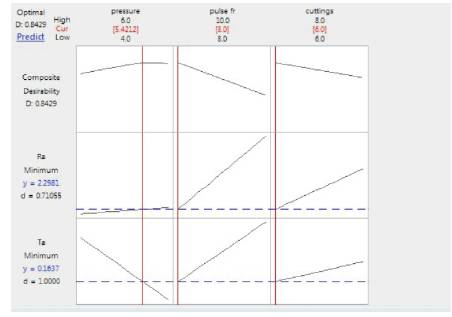
Figure 6. Optimistic Regression Analysis