(1)
Development of Stage-Discharge Rating Curve (SDRC) is of utmost importance for reliable planning, design and management of water resource projects. The SDRC is time dependent and very often exhibits a random phenomenon with fluctuation. For establishing the SDRC, Non-Linear Regression Approach (NLRA) is widely applied to many gauging sites worldwide for many decades. The SDRC is based on power equation that is used to establish a relationship between stage (i.e., water level) and discharge, whose variables can be determined by the method of least squares. In this paper, a study on development of SDRCs for Aamdabad, Nighoje and Wegre gauging sites located in the upper Bhima basin upto Ujjani reservoir is carried out. The performance of the NLRA used for developing the SDRCs is evaluated by correlation coefficient and the mean absolute percentage error. The paper presents the procedures adopted in the development of SDRCs using NLRA and the results obtained thereof.
Discharge measurement in rivers is a challenging job for hydraulic engineers. A common practice is to measure the river stages at regular intervals and use them for discharge calculations is of paramount importance in issues related to water resources, flood frequency analysis, flood control, flood and drought forecast, compensation discharge and water use conflicts (Clarke et al., 2000). The most common and simple method for monitoring stream flow at a hydrometric station is to establish a Stage-Discharge Rating Curve (SDRC), which is used to convert the continuously observed water level into discharge time series (Ghimire Bhola and Janga Reddy, 2010).
SDRC is determined by assuming that, there exists a unique relation between stage (i.e., water level) and discharge (i.e., stream flow) of the river at the given site. However, the SDRC is time dependent and very often exhibits a random phenomenon with fluctuation. Mostly, a power equation is used to establish a relation between stage and discharge whose variables can be determined by the regression analysis (Petersen-Overleir, 2006) . In the present study, Non-Linear Regression Approach (NLRA) is applied to develop the SDRC for three gauging sites located in the upper Bhima basin upto Ujjani reservoir.
In the recent past, NLRA is most commonly used for the establishment of SDRC for many gauging sites worldwide for discharge calculations. From the research paper published by Herschy (1999), it was observed that the rating curve uncertainty analysis is based on the residual variance from regression of a power function and possibly on the standard error of the parameter estimates. Lenzi et al. (2003) have developed a sediment rating curve for river Riokordon using power equation and analysed that 76% of the total transmitted sediment loads are suspended load type and a huge part of the suspended transmitted sediment was because of two bewildered floods of 1994 and 2001. Petersen-Overleir (2004) have proposed a likelihood-based method to take into account of the usually observed heteroscedasticity of a stage-discharge relation. Peterson showed that the classical non-linear least square method leads to unaccounted heteroscedasticity in the stage-discharge relations for several study cases. He also extended the NLRA to more complex stage-discharge relation cases, including multi-segment (or piecewise) power equation, hysteresis and overbank flow in rivers with floodplains. Petersen-Overleir (2008) presented a simple uniform flow depth-discharge model for a two-stage main channelflood plain river section. The piecewise regression problem is solved using the least square regression of rating curve parameters, including the main channel floodplains change-point. Results of Lang et al. (2010) investigations showed that the power equations have the highest level of correlation among different types of sediment rating curve equations.
Arun Goel (2011) has developed the SDRC using linear regression for Tikarapara gauging station located on river Mahanadi in Odisha. He also compared the results obtained from the Artificial Neural Network (ANN) approach and concluded that back propagation feed forward ANN works quite well for the data sets and produced promising results in comparison to the linear regression. Akbarzadeh et al. (2014) have compared the various types of regression methods to develop the sediment rating curve for six hydrometric stations located in Atrak river basin. They concluded that the model of mean load within discharge classes at Tabarrok Abad station, linear model at Aghmazar and Barzoo stations, graphical models (maximum concentration) at Baba Aman and Ghatlesh stations, and hybrid models (multiline) at Darband stations have the lowest mean square error and the best predictability in estimating sediment content among the tested models at the studied stations. However, power curve based on NLR is considered to be the classical approach for the development of SDRC for many gauging sites.
The objectives of this study includes:
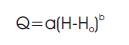
In general, the relationship between the stage and the discharge is a single-valued relation which is expressed as:
where,
Q is the discharge,
H is the gauge height (stage or water level),
Ho is a constant which represents the gauge reading o corresponding to zero discharge,
a and b are constants (WMO, 1986).
Marginal adjustment in the values of H may be required in o order to produce a straight line giving a better fit to the plotted points. There is a possibility that more than one straight line is fitted if so required to represent the changing conditions at different stages. The constants (a and b) in Equation (1) for a given range of stage can be obtained by the method of least squares. By taking logarithms, Equation (1) can be written as:
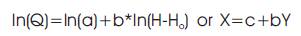
where,
X = ln(Q) (dependent variable),
Y = ln(H-H ) (independent variable) and
c=ln(a).
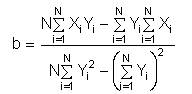
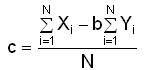
The Equation (2) is known as the rating equation of the stream and can be used for estimating the discharge (Q) of the stream for a given stage reading (H) within the range of data used in its derivation. The values of the coefficients for the best-fit straight line using data of N sample values of X and Y are:
The constant (Ho ) representing the stage (gauge height) for zero discharge in the stream is a hypothetical parameter and cannot be measured in the field. As such, its determination poses some difficulties. Different alternative methods are available for its determination. However, it is found by extrapolating the rating curve by eye judgement to find Ho as the value of H corresponding to Q=0. Using the value of Ho , plot log Q versus ln(H- Ho) and verify whether the data plots as a straight line. If not, select another value in the neighbourhood of the previously assumed value and by trial and error find an acceptable value of Ho which gives a straight line plot of ln(Q) versus ln(H-Ho ).
The performance of the developed SDRC using NLRA is evaluated by Correlation Coefficient (CC) and the Mean Absolute Percentage Error (MAPE), given as,
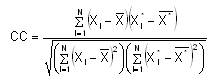
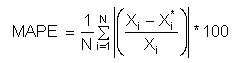
where,
Xi is the observed discharge of ith sample,
Xi* is the estimated discharge of ith sample,
 is the average
observed discharge,
is the average
observed discharge,
 is the average
estimated discharge, and
is the average
estimated discharge, and
N is the number of sample values (Vivekanandan, 2015).
In this paper, a study on the development of SDRCs using NLRA for three gauging sites located in the upper Bhima basin was carried out. Bhima is a major tributary of Krishna river and one of the two major rivers of Maharashtra, with the other being Godavari. Bhima originates at Bhima- Shankar in the Sahyadri Ghats at the elevation of mean sea level of 700 m. The river is prone to frequent flooding due to heavy rainfall during the monsoon season.
Bhima river flows southeast for a long journey of 725 km, before joining the Krishna River at Krishna, Raichur district, Karnataka. The total catchment area of Bhima is 48631 km²; comprising of 219 sub-watersheds. For the present study, Upper Bhima basin upto Ujjani reservoir has considered.
The Upper Bhima basin is located in the western part of Maharashtra between 17o 53' N to 19o 24' N latitude and 73o 20' E to 75o 18' E longitude. The basin covers a geographical area of 14712 km2 ; comprising of 68 subbasins. Of the total geographical area under study, 25% are hilly and/or highly dissected, 55% plateau and the remaining plain area. In this paper, Aamdabad, Nighoje and Wegre gauging sites are considered. The catchment area of these gauging sites is noted to be 1522.5 km2 , 832.3 km2 and 91.2 km2 respectively. The locations of the gauging sites are shown in Figure 1.
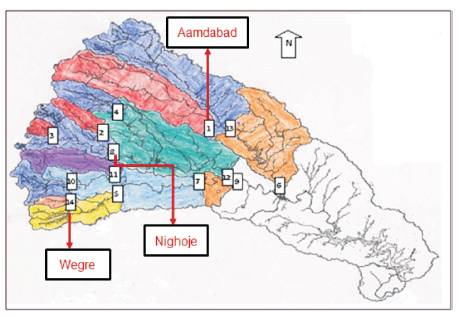
Figure 1. Location Map for the Study Area
By applying the procedures of NLRA, a computer program was developed and used to develop SDRCs for Aamdabad, Nighoje and Wegre gauging sites. The stage discharge data observed at these gauging sites were used. The descriptive statistics such as Average, Standard Deviation (SD), Coefficient of Skewness (CS) and Coefficient of Kurtosis (CK) for the data series of stage and discharge observed at these gauging sites are presented in Table 1.
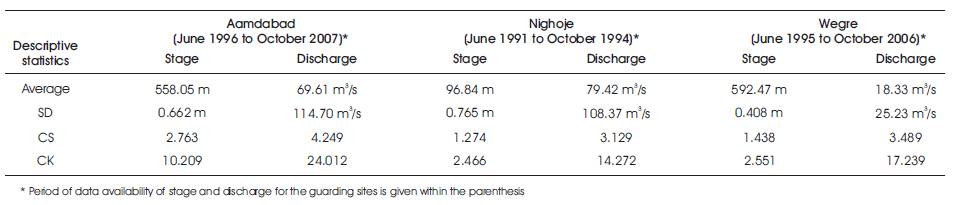
Table 1. Descriptive Statistics of Stage and Discharge Data
By applying the trial and error method, the stage corresponding to zero discharge for three gauging sites were determined as 556.961 m for Aamdabad, 94.884 m for Nighoje and 591.685 m for Wegre. The values of b and c were determined by the method of least squares using equations (3) and (4) and used to develop the SDRCs for the gauging sites considered in the study. The developed SDRCs with CC and MAPE for the gauging sites were presented in Table 2.
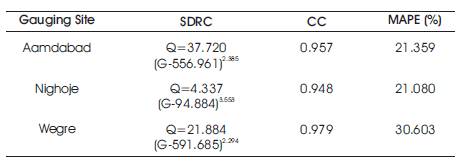
Table 2. SDRCs with CC and MAPE
The developed SDRCs for Aamdabad, Nighoje and Wegre gauging sites are presented in Figures 2 to 4.
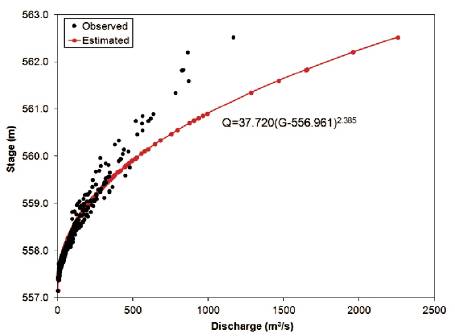
Figure 2. SDRC for Aamdabad
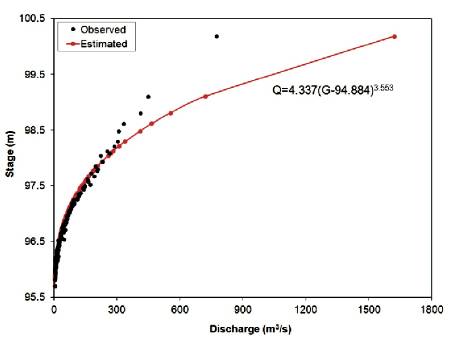
Figure 3. SDRC for Nighoje
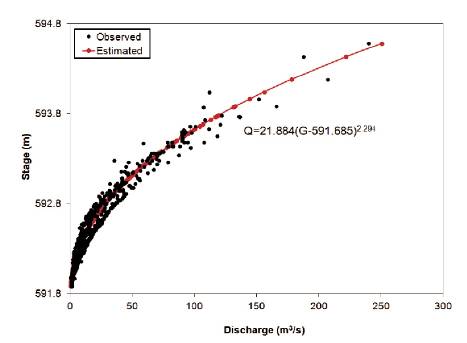
Figure 4. SDRC for Wegre
From Figures 2 to 4, it was observed that, there is generally a good line of agreement between the observed and estimated discharge for the gauging sites with CC values vary from 0.948 to 0.979.
The NLRA described in this paper was used to develop SDRCs for Aamdabad, Nighoje and Wegre gauging sites using the available stage and discharge data. The developed SDRCs were evaluated by model performance analysis using CC and MAPE. From the results of the data analysis, the following conclusions were drawn from the study.
The author is grateful to Dr. M.K. Sinha, Director, Central Water and Power Research Station, Pune, for providing the research facilities to carry out this study. The author is also thankful to the Executive Engineer, Water Resources Department, Nashik, for the supply of Stage-Discharge data used in this study.