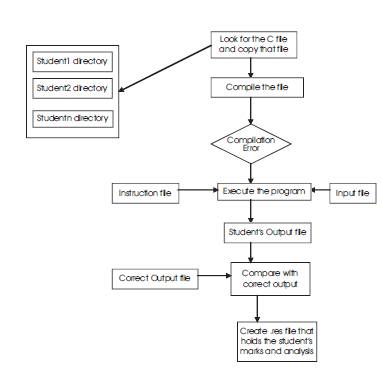
Fig. 1. Flow chart of automated marking process
In this paper, we propose and discuss a fully automated system for marking and plagiarism detection for programming assessment using self organizing map (SOM) and fuzzy logic. The plagiarism approach involves finding similarities between programs submitted by students, and rank them depending on their similarity metrics based SOM clustering. The distance from the cluster centroid for individual assignment is calculated using fuzzy technique. The system is a syntax dependant approach for C language and is based on a tree data structure with leafs and attributes that denote the semantic translation of the given program. The system has been tested successfully on real world programming assignments from software development course.
The automation of the two independent modules - marking assessment and detection of plagiarism in the software code is undoubtedly one of the most valuable teaching tools. The paradigm of assessments in computer programming subjects has been shifted from the traditional pen paper based examination to individual or group based programming assessment task. The advantages include saving in time for marking them, flexibility for the student to complete them in their appropriate time, more closeness towards real time application development, fairness of assessment and reliability in testing. Some earlier works by Gitchell and Tran (1999), Wise (1992), Clark (1999), Donaldson et al. (1981), Faidhi and Robinson (1987) showed some promising results. However the difficulties for finding clear terminology without using any fuzzy theory and also the level of appropriateness in the proper translation into some encoded from the given program remain a major challenge for the researchers. The primary issue in developing an automated marking system is to develop a clear input / output relationship with the assessment software model. Once the relationship has been established, the model can include some intelligent tool to add more flexibility that can deviate from the initial relationship. However the common problem of plagiarism in programming courses continues to be an important issue for the teachers. Plagiarism detection software code varies widely than their traditional document based lexical analysis part. Also, the existence of many diversified programming languages makes the task even more difficult.
Many approaches for Plagiarism detection by Austin and Brown (1999), Boywer and Hall (1999), Carter (1999) exist that follow the lexicon analyzer process, where the programs are tokenized (e.g. Gitchell and Tran, 1999, Wise, 1992). The system described by Gitchell and Tan (1999) converts the source program into token strings, and then compares the strings to detect the degree of plagiarism. The other approaches tokens the control structures and compares the programs accordingly. There also exists the approach using the physical profile of a program is the key to detect the percentage of similarity.
In this study the main aim was to develop a fully automated system for marking and plagiarism detection modules for C/C++ programming language. This paper presents combined approaches of physical and logical profile of a program to detect the degree of similarity. It also uses fuzzy rules to detect the similarity in programs. This is an extension of previous work by Ghosh et al. (2002) with application of SOM and fuzzy clustering to find the degree of similarity between two students.
The methodology is divided into two parts. The first part is automatic marking process and the second part is plagiarism detection. In automatic marking process students submit the programs in individual student directory. To mark the student assignments the system goes to individual student directory and compiles the program. If the program generates any compilation error it stops further work and marks as zero, else it compares the student output file to the correct output and marks accordingly. The overall process is shown in Fig. 1. The process generates a .res file in individual student directory that holds student's mark and an analysis.
Fig. 1. Flow chart of automated marking process
The second part of the proposed methodology is plagiarism detection. Plagiarism is detected by the degree of similarity between the two programs. To detect the degree of similarity between two programs a physical profile and a logical profile of the programs are generated. The physical profile holds the volume of the program and the logical profile holds the logical flow of the program. The profiles are stored in .pla file in individual student directory. A fuzzy logical boundary is allotted to denote how similar two files are.
The physical profile P describes a program in terms of its physical attributes: number of lines (l), words (w), characters (c).
Physical Profile-
P = (L, W, C)
L-The number of lines in the program
W-The number of words in the program
C-The number of character in the program
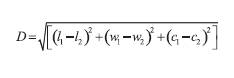
The physical profile is counted using the UNIX word count (wc) command. The closeness of two programs is computed by the Euclidean distance between two profiles. The profiles are normalized before computing the closeness.
If P1 = (l1 ,w1, c1) and P2 = (l2 ,w2 ,c2) represent two physical profiles of two programs correspondingly then the closeness is calculated as in (1).
A pla file represents the control flow of a program. The file starts form the main function and grows gradually. It stores the global variables, the constants declared in the program, the individual functions called in the program and as well as the control statement. To create the pla file the program is scanned twice. Stepwise descriptions are given for generation of .pla file. A simple example is followed in this paper to describe the steps. The example is shown in Fig 2.
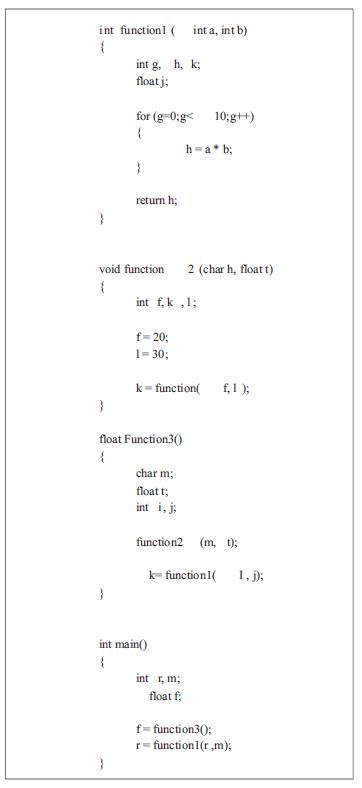
Fig. 2. A Sample Program
Step1: In the first pass a individual function structure (Fig. 3) of the program is created which holds the function identifier (a unique number generated by the program), the input parameters, the variable declared and the control structures used in the program in sequence
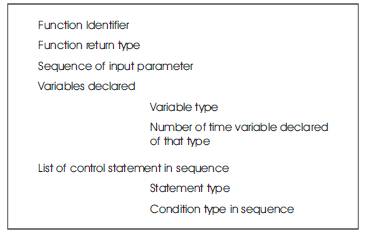
Fig. 3. Information Holds For Individual Function
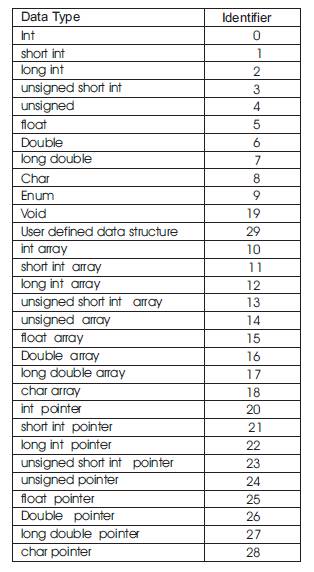
Table 1. Identifier For Data type
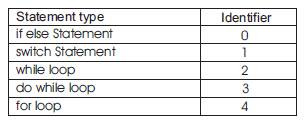
Table 2 Identifier For Control structure
An example of this step is shown in Fig.4.
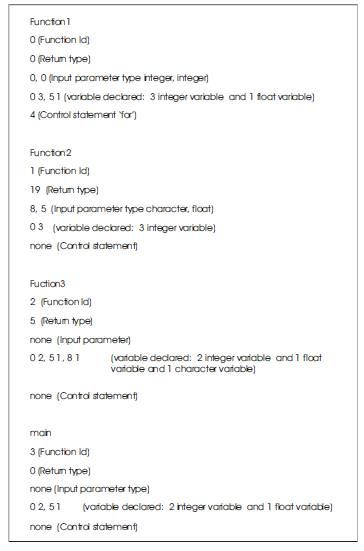
Fig. 4. Individual Function Structure Of The Program
Step2: In the next pass the program file is scanned and a function trace structure is built which stores the identifiers of the sub functions called from the parent. The structure is shown in Fig. 5.
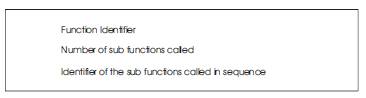
Fig. 5. Function trace structure
An example of this step is shown in Fig.6.
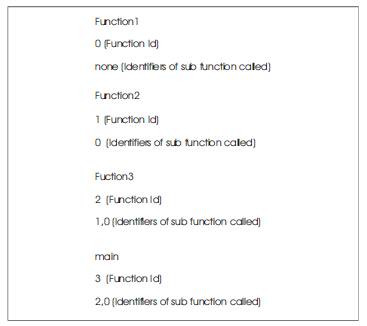
Fig. 6. Example of Function Trace Structure
Step3: With the two temporary structures mentioned above a tree structure is generated. The tree structure holds the logical flow through the functions and sub functions. Each node maps to a function and the node points to its children those stands for the sub function called from that function. The root of the tree is the main function from where the logic flow starts. As for example the tree structure forms from the above example is shown in Fig 7.

Fig. 7. Example of Program Tree Structure
Step4: The tree structure is converted to a program logic alignment file (.pla). The pla file holds the plagiarism tree. The pla file from the tree structure mentioned above is shown in Fig. 8. The plagiarism tree is traversed in depth first way. When possible, a depth-first traversal chooses a vertex adjacent to the current vertex to visit next. If all adjacent vertices have already been discovered, or there are no adjacent vertices, then the algorithm backtracks to the last vertex that had undiscovered neighbors. Once all reachable vertices have been visited, the algorithm selects from any remaining undiscovered vertices and continues the traversal. The depth first traversal holds the entire logic flow of the program.
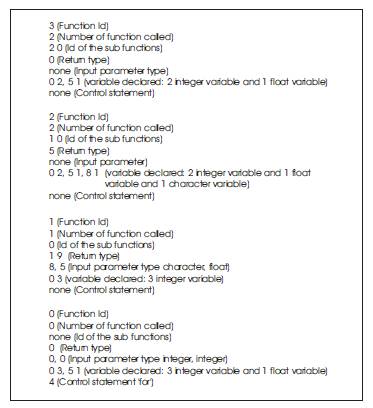
Fig. 8 Pla File
After creation of the pla file of each program the corresponding pla file of two individual programs are compared. The closeness between the two programs is measured by the similarities between the pla files. Three counters are used to measure the similarities one for variable, one for the control structures and the third one for the function prototypes and input parameters. The counters are incremented correspondingly when the corresponding filed in the nodes of each tree matches. These counter values along with the physical profile are used to determine the metrics of similarity.
A combination of physical structure and logical flow of the .pla file is used to measure the degree of similarity between the two programs. The physical structure and the three counter values mentioned above are used as features for clustering.
Clustering aggregates similar input patterns into distinct subsets referred to as clusters. In this paper we are using Kohonen's Self-Organizing Map. Self- Organizing Maps (SOM) were introduced by Kohonen (1995). SOM is an unsupervised neural network that performs clustering of input data and at the same time maps into a two dimensional surface. All neurons compete for each input pattern and the neuron that is chosen for the input pattern wins it. Only the winning neuron is activated (winner-takesall).
Kohonen's SOM is composed of a set of n-dimensional vectors, arranged in a 2-dimensional array. Each vector is surrounded by other 6 (hexagonal) or 8 (rectangular arrangement) vectors, in what is called its neighborhood. Kohonen's SOM, as many other heuristic methods, must be trained on the data it is going to model; training proceeds as follows: .A new vector from the training set (the set of data we want to be modeled) is chosen randomly. . The closest vector in the SOM is computed, and called the winner. All vectors in the neighborhood of the winning vector are updated so that they become closer to the input vector by a factor. Neighborhood and the factor are updated. After a predetermined number of iterations, the algorithm stops. The self-organization in the self-organizing maps comes from the fact that different neighborhoods are updated every time a new vector is presented; besides, it is self-organized in the sense that learning proceeds in an unsupervised way
When clustering of the data set was carried out four clusters are generated. The centroids of the clusters are shown in Table 1.
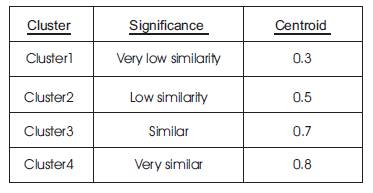
Table 1. Results for Clustering of similarities
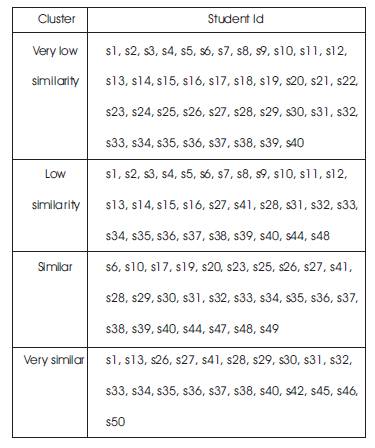
After finding the centroids of the four clusters, similarity values (according to the physical profile and logical counter values) of two students are mapped onto confidence levels for the four clusters. The similarity between the students from the four clusters is calculated. The membership value of the pair in a particular cluster is the deviation from the cluster centroid. It is taken as the smaller the distance, the higher the membership confidence. With the help of these confidence values a fuzzy boundary is allocated for each cluster. The fuzzy boundary is used to determine the degree of similarity. The fuzzy boundaries are: Very low similarity, Low similarity, Similar, and Very similar. The value zero is used to represent complete non-membership, the value one is used to represent complete membership, and values in between are used to represent intermediate degrees of membership. The membership functions are as follows:
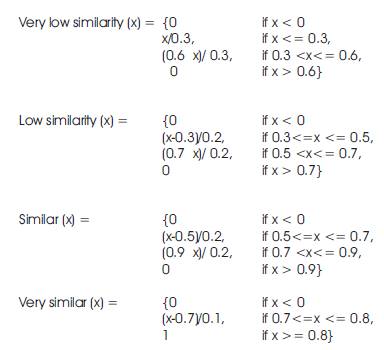
The graph of the membership functions is shown in Figure 4.
clustering. So if a new assignment is submitted we only pass the assignments through the rule base to measure the degree of similarity with other assignments in the group. A decision tree is constructed by looking at the regularities in the data. We have used C4.5 to generate the tree. A decision tree is a hierarchy of if-then statements. It is searched sequentially for an appropriate if-then statement to be used as a rule. A decision tree is an arrangement of tests that prescribes an appropriate test at every step in an analysis. In general, decision trees represent a disjunction of conjunctions of constraints on the attribute-values of instances. Each path from the tree root to a leaf corresponds to a conjunction of attribute tests, and the tree itself to a disjunction of these conjunctions. An instance is classified by starting at the root node of the decision tree, testing the attribute specified by this node, then moving down the tree branch corresponding to the value of the attribute. This process is then repeated at the node on this branch and so on until a leaf node is reached. Once a decision tree has been constructed, the tree is converted into an equivalent set of rules. An example of a simplified decision tree is shown in Figure 5.
Once a decision tree has been constructed, it is converted into an equivalent set of rules. To generate the rules, trace each path in the decision tree, from root node to leaf node, recording the test outcomes as antecedents and the leaf-node classification as the consequent. With the decision tree generated from our assignment data rules were extracted. 41 rules were generated. 33 rules have more than a 95 % confidence value. An example of a rule is as follows:
Rule 10: If number of words <= 0.157343
And if number of character <= 0.186439
And if Variable Counter > 0.276596
And if Control Counter > 0.324324
And if Control Counter <= 0.576577 Then it is Very Similar.
The experiments were conducted for the C language with 50 assignments. The results are only presented for the case of a 30% weighting for the physical profile and 70% for the logical profile. The percentage of students in each cluster is shown in the following figures (Figure 6 Figure 9). Figure 6 shows how the results fall into the fuzzy cluster boundaries under cluster 1. It is shown that the most of the results are for the Very low similarity - Low similarity (29%) and Very low similarity - Low similarity Similar Very Similar (26%).
Figure 7 shows how the results fall under cluster 2. It can be seen that most of the results are for the overlapping part of Very low similarity - Low similarity (40%) and Very low similarity - Low similarity Similar Very Similar (35%).
Figure 8 shows how the results fall under cluster 3. It can be seen that the most of the results are for the Very low similarity - Similar (19%) and Very low similarity - Low similarity Similar Very Similar (41%).
Figure 9 shows how the results fall under cluster 4. It can be seen that the most of the results are for Very low similarity - Low similarity Similar Very Similar (52%), and Very Similar (19%).
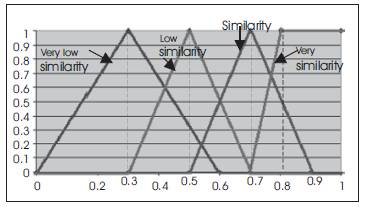
Figure. 9. Function trace structure
The following table (Table 2) shows the confidence value of the rules extracted from the results. A total 41 rules are extracted. Among them 8 rules are formed for Cluster1, 11 rules are formed for cluster 2, 8 rules are formed for Cluster 3 and 11 rules are formed for Cluster4. All the rules have got confidence value greater than 95%.
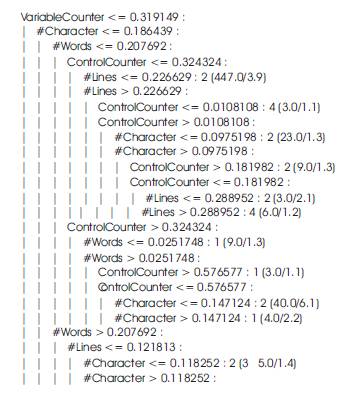
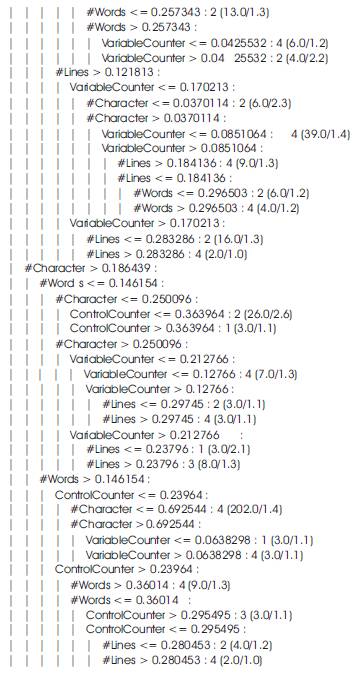
Figure. 10. Simplified Decision Tree
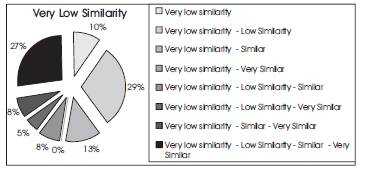
Figure. 11. Distribution in Cluster 1
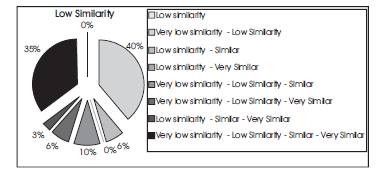
Figure. 12. Distribution in Cluster 2
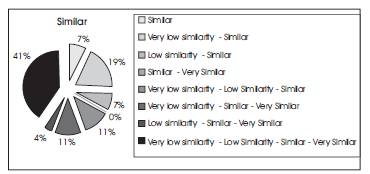
Figure. 13. Distribution in Cluster 3
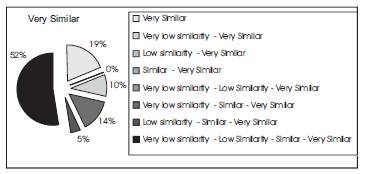
Figure. 14. Distribution in Cluster 4
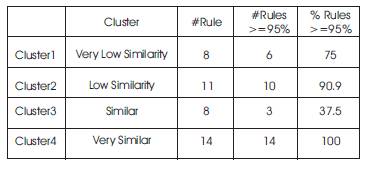
Table 2. Confidence of rules extracted
In this paper we have described a system for plagiarism detection that measures similarity of student programs based on a weighted combination of the physical and logical profiles for the programs. An earlier implementation of this approach showed good agreement with human judgement of plagiarism. In this earlier approach the detection system required tuning by the setting of some thresholds for similarity. In this new approach the use of fuzzy clustering avoids the need for setting these thresholds and further automates the process. Furthermore the fuzzy clustering can be used to generate rules for automatically determining a degree of plagiarism for any new student program. This new approach has shown an improvement in agreement with human ratings of plagiarism for this group of student programming tasks.