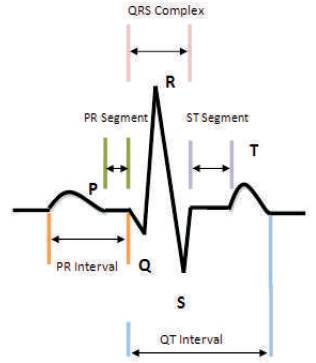
Figure 1. Simplified Waveform of an ECG Signal
The clinical importance of the ECG signal in cardiology is well established. Since noise is embedded with signal during acquisition it has to be filtered out in order to deliver accurate fast and reliable estimation of clinical parameters. The Rpeak is an important fiducial point. In the present paper an efficient and straight forward R-peak detection algorithm has been proposed. This leads to formulation of heart rate from accurate RR interval time series. The heart rate is calculated for various ECG records and then compared with original values. The records have been taken from MIT/BIH database to validate the efficiency of the proposed method. Simulation is carried out in MATLAB environment.
There is growing demand for the systems capable of continuous and long term monitoring of people's biomedical signals as they go about their normal daily lives without obstructing or annoying them. Electro Cardio Gram (ECG) monitors provide particularly useful information on vital signs,and it being the most commonly recorded physiological signal.
An ECG is generated by a nerve impulse stimulus to heart. The most important ECG signal features in a single cardiac cycle are labeled as shown in the Figure 1.
Figure 1. Simplified Waveform of an ECG Signal
Abnormal patterns of ECG may be due to pathological states or occasionaly they may be due to various types of artifacts [7]. Among these artifacts the power line interference and the baseline wandering are the most significant and can strongly affect ECG signal analysis. Signal conditioning for base wander correction and noise suppression is typically the first step in the analysis of ECG signal.
Of the many morphological markers of the ECG, the QRS complex and the R-peak are the most significant ones with the contribution of R-peak to R to R interval being a driving factor. The number of R peaks in a specified time interval gets translates to the heart rate (in beats per minute).

Seema et al (2012) [8] have emphasized that filtering is the most important issue as the signal voltage level is as low as 0.5 to 5 mV and is susceptible to artifacts that are larger than it.
In 1986 Hamilton and Tompkins [1] examined QRS detection rules. They proposed and also implemented optimized QRS detection algorithm in real time in which RR interval estimator was used. Sachin et al (2010) [2] measured RR interval using Pan-Tompkins algorithm – a real time QRS detection algorithm. Choy & Leung (1988) [11] suggested in literature the real time microprocessor based 50 Hz notch filter for ECG. Chavan et al (2006) [12] have advised the use of Kaiser window to design digital filter for the removal of baseline wander, power line interference and encephalogram in ECG. Shayesteh & Mahdi (2009) [13] have developed a new window for designing FIR(Finite Impulse Response) filters. Mbachu et al (2011) [16] have discussed filtration of artifacts in ECG signal using rectangular window based digital filters. Ravindra Pratap et al (2013) [14] have used low pass filter with various window techniques for the reduction of noise from ECG signal. Sivakumar et al (2012) [15] have shown the way for the extraction of cardiac component like QRS complex by rejecting the background noise with the help of filtering techniques. Ashwini et al [9] have determined bradycardia and tachycardia from ECG signal using wavelet transform. One of the steps to be followed is the detection of RR intervals. Gautam et al [10] have opined that the most important interval to be used for the determination of cardiovascular abnormality condition is RR interval (normal value is 600-1200 ms). Sahil et al [5] have suggested efficient RR interval time series formulation for heart rate detection. Shogo Nakaya & Yuichi Nakamura [4] have improved adaptive sensing method for ECG signals by incorporating RR interval prediction. Prakruti et al [3] have developed a peak detector algorithm to detect the R-peaks of the smoothened ECG waveform which is free from baseline wandering.
ECG signal processing can be roughly divided into two stages by functionality, that are pre-processing and feature extraction. The pre-processing stage removes or suppresses noise from the raw ECG signal and the feature extraction stage extracts diagnostic information from the ECG signal. The Figure 2 depicts the layout of the process.
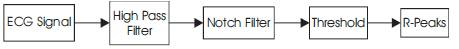
Figure 2. Process Layout
This filter reduces baseline wander in the ECG. The data is sampled at 128 Hz. A 9th-order high pass Butterworth filter with cut off frequency of 0.5 Hz is used to remove base line wander from all the five records. Figure 3 shows the zoomed view of Power Spectral Density(PSD) indicating the effectiveness of the filter.
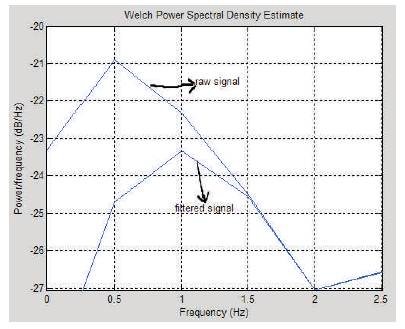
Figure 3. Zoomed View of PSD around 0-2.5 Hz
This filter reduces the power line interference. An IIR(Infinite Impulse Response) notch filter removes a 60 Hz component from a signal sampled at 128 Hz. Q(Quality) factor for the filter is set to 35 and it is used to specify the filter bandwidth. IIR notch filter (wo, BW) turns a digital notching filter with the notch located at wo, and with the bandwidth set at -3 dB. Figure 4 shows the zoomed view of the Power Spectral Density.
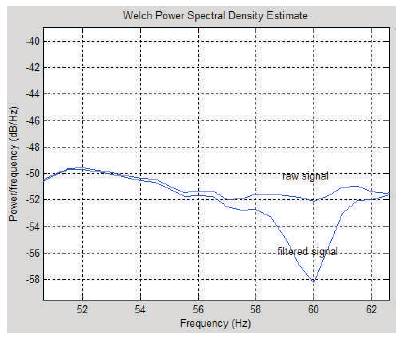
Figure 4. Zoomed view of PSD
An appropriate threshold is selected by empirical search to detect R-peaks successfully.
The detection algorithm is applied to ECG records from MIT/BIH (Massachusetts Institute of Technology/Beth Israel Hospital) database [6] in order to verify its efficacy. Five ECG records (number 16272, 16420, 16483, 16773 &16786) have been chosen. The R-R interval and the heart rate have been determined for each record-once without filtering the ECG signal and then denoising the signal. The results have been compared against the values as cited in the reference [5].
Table 1 and Table 2 show the comparison of RR interval and heart rate respectively determined by the algorithm suggested by Verma & Vashistha and the proposed algorithm against the original values [5]. The results in the form of histogram shown in Figure 5 and Figure 6 validate both the algorithms. As it is evident the results will improve with better filtering techniques. Furthermore, the results obtained by the proposed algorithm, though simple, straight forward and easy to implement, match closely with the results obtained by the algorithm suggested by Verma & Vashistha.
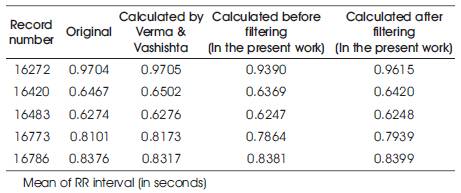
Table 1. R-R Interval as determined by different algorithms for five records
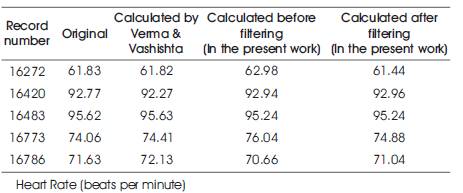
Table 2. Heart rate as determined by different algorithms for five records
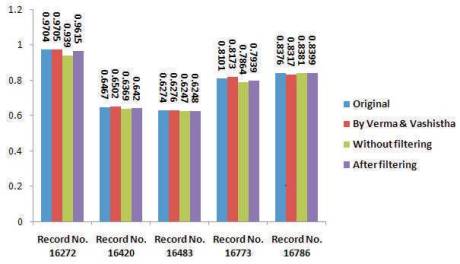
Figure 5. Histogram of R-R interval
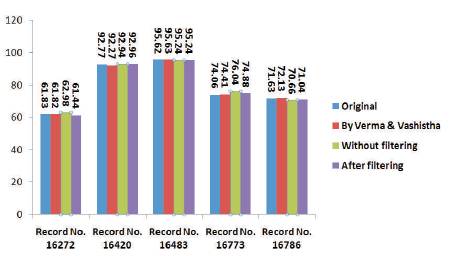
Figure 6. Histogram of heart rate
The analysis of ECG as a diagnostic tool is relatively an old field and it is therefore often assumed that the ECG is a simple signal that has been fully explored. But the ECG signal processing in an embedded platform is a challenge which has to deal with several issues. There is no denying that the care must be taken to nullify the artifacts which corrupt the original ECG signal that may lead to wrong diagnosis. As it is evident from Table 2 showing the results, there is scope of improvement, so that more accurate and reliable prediction of the heart rate can be made. The aim is to find an efficient method for the analysis of ECG signal which is simple and has good accuracy and less computational time. For better extraction of features in ECG signals focus is to be given towards independent component analysis, adaptive filtering and empirical mode decomposition method. Moreover Labview may be employed as an effective tool for the study and analysis of ECG signal.