
Figure 1. Major Dimensions of the Single Manifold Tract
Figure 1 illustrates the major dimensions of the single manifold tract used in a fluid filled analysis project (Page 2004). This manifold tract is in essence a fluid filled structure used to investigate the interaction of the fluid with polymer component. Such dimensions formed part of the constraints for the bracket concept evaluation which is detailed in this paper. The views shown in Figure 1 provide dimensions of the component under investigation.
2. The Single Manifold Tract Component

Figure 2. The Single Manifold Tract Component
Figure 2, shows a photograph of the single manifold tract component. As can be seen, the component comprises a single tract, a hollow curved tube, with a mounting flange at one end and a closed-off plenum at the other, essentially forming a box. The component was moulded as two separate pieces, one a top section and one a bottom section, which were then welded together to create the final part. Although the component was originally intended to evaluate the weld strength of different materials, it was an perfect component for this project due to it being a simple, enclosed part with discreet modes of vibration below 2000Hz. The overall form of this component is design to resemble that of an automotive fluid-filled structure.
3. The Shaker Rig Table
The shaker rig table has 37 positional stainless steel inserts of M9 x 1.25 pitch. These have been included to provide both vibrational rigidity and to provide for flexibility in mounting of the manifold tract. The shaker rig has been designed in such a way that components such as the manifold tract can be securely located in a variety of orientations to achieve a spectrum of vibration frequency. Their positions are shown in Figure 3.

Figure 3. The Positions of the 37 Mounting Points on the Shaker Rig Table
4. The Shaker Rig Set Up

Figure 4. The Final Set-up of the Single Tract and Bracket on the Shaker Rig Table, ready for testing
Figure 4, shows a photograph of the tract component and bracket mounted to the shaker rig table ready for dynamic testing. Two wires provide connection between the two accelerometers and the computer in order to record the response of the tract component and to ensure that the shaker table is vibrating at the correct frequency. This model was used many times for different analyses, the first was unfilled with constraints in the mounting holes, used to correlate to the results of the first shaker rig test, where the unfilled component was mounted onto the test rig and harmonically tested. The second time it was used, the model was again unfilled, but the constraints were changed to represent the bracket used to hold the mounting flange, simulating the shaker rig set-up. The final time was similar to before, with the bracket constraints, but this time the plenum section was meshed with FLUID80 elements, to simulate the component filled with 733ml of water. The fluid elements were given the properties of water, for the last analysis, whilst the tract was given the properties of the polymer at each of the four temperatures, for the first analysis.
5. Bracket Design and Evaluation Using Corner Mounting Points
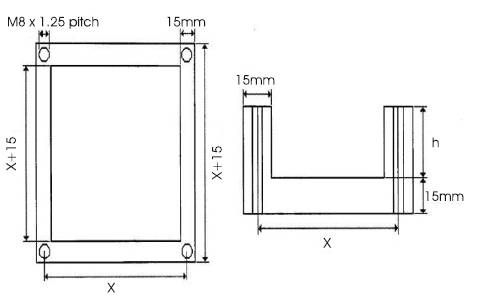
Figure 5. The Constraints Applied to the Bracket Design Utilising Mounting Holes in the Corner Positions
This section considers the evaluation of brackets with corner mounting points. With reference to Figure 5, and the known X = the distance between the centre of the mounting holes then:
X + 15 can't be more than 311.1 mm, and
X - 15 can't be less than 110 mm.
Furthermore, the volume of the bracket must be no less than 840,000 mm3.
Using this information, created by the hole position constraints of the shaker table, the following table (Table 1) of information can be generated:
With this information the brackets outer dimensions (X + 15) by (X + 15) by (h + 15), and the volume of the interior, h((X-15)2), can be calculated. It is important to note that the dimensions have been rounded-up so as to reduce the design tolerance for manufacture(Table 2).
Although all the concepts have an interior volume greater than the 840,000 mm2, concepts 1 and 2 are eliminated because both X-15's are less than the 110 mm constraint. This leaves concepts 3, 4 and 5 as suitable brackets for the testing.

Table1.The Dimensions of the First Five Concepts, (all values in mm)

Table 2. The Rounded-up Dimensions of the First Five Concepts, (all values in mm)
6. Bracket Design and Evaluation Using Middle Mounting Points

Figure 6. The Constraints Applied to the Bracket Design Utilising Mounting Holes in the Middle Positions
This section considers the evaluation of brackets with middle mounting points. Using Figure 6, and the known X = the distance between the centre of the mounting holes then:
X + 15 can't be more than 311.1 mm, and
X - 15 can't be less than 110 mm
Furthermore, the volume of the bracket must be no less than 840,000 mm3.
Using this information, created by the hole position constraints of the shaker table, the following table (Table 3) of information can be generated.
With this information the brackets outer dimensions (X + 15) by (X + 15) by (h + 15), and the volume of the interior, h((X-15)2), can be calculated. It must be noted that these dimensions have been rounded-up to reduce the design tolerance for manufacture (Table 4).
Although all the concepts have an interior volume greater than the 840,000 mm3 constraint, concept 6 is eliminated because X - 15 is less than the 110 mm constraint. Concepts 9 and 10 are eliminated because both X + 15's are greater than 311.1 mm. This leaves concepts 7 and 8 as suitable brackets for the testing.

Table 3. The Dimensions of the Last Five Concepts (all values are in millimetres).

Table 4. The Rounded-up Dimensions of the Last Five Concepts (all values in mm).
7. Modal Analysis of the Bracket Concepts
Taking the results from the concept evaluation technique of setting constraints, the suitable brackets were modelled within ANSYS, and modal analyses run. The first mode of each bracket must be over 2000Hz, as any lower would affect the results of shaker rig testing over the range 0Hz - 2000Hz. The results in order of modal frequency are as follows:As can be seen in Table 5, concepts 4 and 5 have their first modal frequencies below 2000Hz, and so are unsuitable for the testing. This leaves concepts 3, 7 and 8 as suitable brackets for the testing. A point of note is that the first mode frequency increases as the base surface area of the bracket decreases, (along with an increase in bracket height).

Table 5. The Modal Analysis Results of the Concepts.
8. Final Evaluation of Brackets
After measuring the single manifold tract, it became clear that not all of the concepts are of a reasonable size to allow the tract to be mounted within the interior. From the dimensions measured, the following constraints were defined: X - 15 must be greater than 110 mm h must be less than 53.5 mm. Concepts 3 and 7 can therefore be eliminated because of the 'h must be less than 53.5 mm' constraint, leaving concepts 4 and 8 as suitable brackets for testing. With only a choice of two concepts left, the simple technique of 'choose the bracket with the higher first mode' was used to select concept 8 as the bracket to use.
9. The Tract Clamps Design and Evaluation
The clamps ensure that the mounting flange of the tract doesn't lift up during the shaker rig testing. During the first round of testing, the mounting flange did lift up, and if this happens when the tract is filled with fluid then the fluid will obviously come out of the tract and into the bracket. So the requirement of the clamps is simply to stop the mounting flange lifting up during testing. Three designs were originally developed, with the third being a hybrid of the first two. The first design, shown in Figure 7(a), is designed to hold the front section of the mounting flange down, as only the front section lifted up during testing. The second design, see Figure 7(b), was designed to be mounted between the tract and the bracket, thereby sealing off the bottom of the tract, which should prevent any fluid possibly from escaping. The final design, see Figure 7(c), was simply a hybrid of the first two designs, whereby the bottom of the tract was sealed off, and both sides of the flange were held down. The cross-sectional view of the clamp is like two C-shapes back to back.

Figure 7. The Three Basic Clamping Designs
10. Modal Analysis of the Basic Clamp Designs
Using the bracket that was selected from the concept evaluation, each of the clamp designs were added to the bracket model in turn, and modal analyses run. Three sets of modal analyses were run, one with just the base plate, one with just the L-Shaped clamps, and one with both the clamps and the base plate. Two different sizes of clamps were analysed, and these are shown in Figure 8.

Figure 8. The Two Sets of L-shaped Clamps, Showing Dimensions
The base plate had the dimensions 110mrn x 40mm x 10mm, and is shown in Figure 9 when modelled with the L-Shaped clamps. The clamp is designed to permit the mounting flange of the tract to slide into the component, and then be mounted to the shaker through the holes of the base plate, and the bracket.

Figure 9. An Overhead View of the Base Plate with the Attached L-Shaped Clamps.
It was decided to reject the use of the base plate only, as this would just be the same as mounting the tract straight onto the bracket, allowing the possibility of the front mounting flange lifting up again. This factor is again relevant for the base plate & clamps concept, in that the base plate would appear to be redundant due to the fact that it is just acting like the bracket base itself. This meant that the clamps only concept would appear to be the best choice. As the these results show, in Table 6, Clamp B produced higher first modes than Clamp A, and so this concept was chosen along with the fact that they are also stronger and stiffer due to their increased thickness.

Table 6. The Modal Analyses Results for the Clamp Designs with the Bracket
11. The Final Bracket Design
It was agreed that the bracket should have eight mounting holes, using a hybrid of the basic concept designs of the corner and middle mounting points as it would make sure that the bracket wouldn't lift up in places like the mounting flange of the tract had done during testing. The inner dimensions of the bracket were taken from one concept, and the outer dimensions taken from another. The inner dimensions of concept 8 were taken along with the outer dimensions of concept 4, which were the final two concepts to be chosen. The basic design of the hybrid bracket is shown in Figure 10, utilising the rounded-up dimensions, which caused the wall thickness to be constrained to 21.5 mm.

Figure 10. The Hybrid Bracket Design, with Dimensions
12. The Modal Analysis of the New Bracket Design
The final tract design was modelled and meshed within ANSYS FEA package, see Figure 11, and after constraining the model around the mounting points, a modal analysis was run. The first mode occurred at a frequency of 2807.4 Hz, and the second mode occurred at 5124.9 Hz, both of which are well above the 2000Hz minimum required for the testing. The Finite Element Model Figure 11(a), shows the meshed finite element model of the final bracket design. The model was constrained inside the eight mounting holes, to simulate the bolts that would be used to mount the bracket to the shaker-rig table. The nodes used to simulate the vibrating shaker-rig table were selected from the bottom of each of the mounting holes, as this is how the shaker-rig would vibrate the bracket. Figure 11(b), shows the un-meshed model of the final bracket design, shown to aid the reader in visualising the meshed model, as the elements can disguise the shape of the model.

Figure 11(a). The Meshed Bracket Model. (b). The Un-Meshed Bracket Model.
After the finite element analysis of the bracket model proved successful, the component was manufactured using aluminium. As can be seen from Figure 12, the bracket was assembled from seven separate pieces, one base, four side walls, and two L-Shaped clamps, fixed by bolts. Figure 13, shows the single manifold tract clamped to the aluminium bracket, ready to be mounted onto the shaker rig table.

Figure 12. The Aluminium Bracket used for Testing Purposes.

Figure 13. The Single Manifold Tract Clamped to the Aluminium Bracket.
Conclusions-Finite Element Analysis Correlation
This section details extra information relevant to finite element analysis, and the project as a whole, as well as useful information for anyone using or about to use finite element analysis packages. Correlation errors can occur in many areas of the analysis process. The main areas in which an engineer can check for problems are: Problem Definition - has the right analysis type been chosen? The FE Model - has the model been created and meshed properly, with the correct boundary conditions applied? The Results - do the results look reasonable? An engineer should have an idea of what results to expect before the analysis is run. The first task is to determine what analysis results are required. This involves a decision of which analysis type to run, several may be needed, or none may be needed at all as hand calculations could be quicker (Fagan 1997).
A finite element analysis will only produce the correct answer if the model is both valid and accurate. Validity depends on how faithfully the physical problem is represented in the computer, while accuracy depends on how close the model is to convergence. Clearly the answer will only converge to the solution of the computer's representation of the problem. The following general model verification should be undertaken:
- Appropriate finite element mesh density in areas of expected or known high-stress.
- Correct real-constant property values assigned to elements, e.g. wall thickness, beam cross- section, etc.
- Correct material property values added to elements, including temperature-dependant properties and non-linear relationships if necessary.
- Appropriate and correct boundary conditions applied to the model.
- Warped or high aspect ratio elements should be subdivided or re-arranged.
The following model verification checks are relevant for ANSYS, and have been developed during the course of this work.
- Check that all the elements and nodes are properly connected, and are not overlapping.
- Make sure that a reasonable mesh density has been used, especially in and around corners, curves, holes, etc.
- The volume, mass, and density should be checked from the output window, to confirm that the geometry and material properties are represented correctly.
- Check that the real constant and material property values are in appropriate units.
- Make sure that the boundary conditions are applied to the correct nodes and/or elements, rotating the. model during and after the selection process can help.
- When running dynamic analyses, make sure that displacements of zero value are not added in the direction of the acceleration, unless they are required to do so.
- When using Master Degrees of Freedom's (MDOF's), make sure that enough are being used, this can be done by comparing the results to a full analysis.
- If an analysis is being run to investigate fluid-solid interaction, make sure that any MDOF's being used are not placed on the fluid nodes, and only on nodes representing the solid structure, or the fluid-solid interface
- If gravity is being used, make sure that it is added as a reaction force acting in the positive axis.
- When running an analysis that uses a hydrostatic pressure, make sure that a gravity reaction force has not been applied as well, as this will cause ANSYS to double the acceleration due to gravity acting on the model.
- When using mass elements, for example MASS21 elements, make sure that the real constant density values are included for all of the axis, i.e. ux, uy, and uz.
- Use the prrf (within ANSYS) command to list all reaction forces in order to check that the reaction forces seem reasonable.
If the elements are formulated correctly, then as the mesh density of a model increases, and thus the size of the individual elements decreases, the solution should converge to an accurate answer.
The Results
After making the above preprocessor checks, the results should be verified.
- The results produced can help identify any problem area with the model. The reaction forces can be checked; the sum of all the reaction forces should equal the applied forces.
The results should be consistent with the problem formulation. For example, for a linear static analysis the displacements should be small.
- Unusually low stresses in a known high-stress area may indicate a need for local finite element mesh refinement.
Finally, it must be emphasized that finite element analysis is an approximation technique, and the results produced will not produce exact correlations. A correlation difference of 5% is a suitable value to aim for, and to be expected from accurate analyses