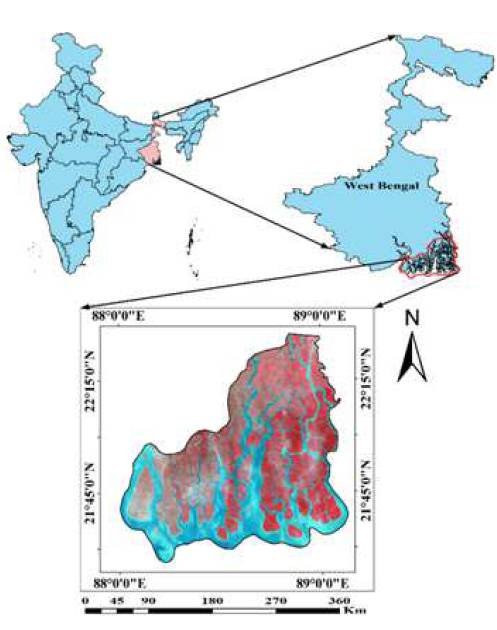
Figure 1. Location Map of Indian Sundarban Delta (Area of Interest) in False Colour Composite (FCC) Derived from Landsat TM and Area of Interest were Manually Digitized using Topographical Sheet
Sundarban ecological unit is a well-known world's major mangrove ecosystem, prolonged over Bangladesh and India across the deltaic formation of Ganga, Brahmaputra, and Meghna rivers. Indian Sundarban Delta (ISD) is located over Ganges and Brahmaputra rivers’ delta in West Bengal, India. In the existing epoch, sundarbans delta is prone to ecological pressure caused by various natural as well as anthropogenic activities. The mangroves ecosystems of ISD have been critically disturbing via climate changes such as Sea Level Rise (SLR), gales, flood, shoreline erosion, salinity intrusion, population pressure etc. Aforesaid issues are apprehension for the mangroves forest and can create more socio-economic complications for the local mankind and wildlife of the ISD. The present study has essentially focused on the analysis and assessment of temporal deviation in the spatial pattern of Indian sundarbans delta using chronological satellite imagery since 1972-2017. Digital image processing of multi-temporal Landsat-series satellite data of 1972s, 1987s, 2002s, and 2017s were carefully performed in Geographic Information System (GIS) environment. Loss of Mangroves cover and Land Use / Land Cover (LU/LC) transformation were accomplished using two image processing techniques; Supervised Classification (Random Forest Classification) and Soil Adjusted Vegetation Index (SAVI), and accuracy assessment of the derived LU/LC map was done by preparing a confusion matrix. The impact of climate change on ISD and socio-economic impact of mangrove ecosystem on shelters has also discussed.
The deltaic formation of Ganges and Brahmaputra rivers in eastern coast of West Bengal (India) is famous as Indian sundarban delta. It is an enormous mangroves forest in the coastline province of the Bay of Bengal. The name “Sundarban” may have been derived from Sundari mangroves trees, which is a local name of mangrove species ‘Heritiera fomes’. Sundari trees are the most exquisite kind of mangrove species found in large extent across sundarban delta. In 1987 than 1989, Indian sundarbans are accredited as “World Heritage site” as well as “Biosphere Reserve” by United Nations Educational and Scientific Cooperation and International Union for Conservation of Nature (Pramanik, 2015). Indian part of sundarbans shield metropolis city, Kolkata from frequently originating hurricanes. Presence of mangroves timberland acts as a safeguard that tolerates the cyclones and swerve it away from the human residence. Mangrove ecosystems have a significant role in preserving wealth of species, genetic diversity, storing and recycling of nutrients, sustaining pollution free environment, etc. Likely, mangrove environment helps in conserving coastal regions of intertidal regions to mitigate the influence of tides and gales to protect shorelines from erosion (Raha et al., 2014, Thomas et al., 2014).
Number of studies have revealed that Indian sundarban is under threatened of various natural and anthropogenic intentions. Sundarban ecosystems are humiliating along with mangrove degradation due to innumerable anthropogenic and natural causes. Expanding in tourism, business, trade, industries, human population growth, and migration etc. are foremost reasons for deterioration of sundarban environment (Mondal and Bandyopadhyay 2014; Ranjan et al., 2017). Natural influences such as climate change, sea level rise, sea surface temperature, rise in global temperature, cyclone, flood, increase in salinity, shoreline changes etc. are affecting sundarban environment. One of the major threats to the Sundari mangroves is higher salinity intrusion due to rise in sea level and cyclone. The Global Mean Sea Level is projected to increase ~0.28-0.98m in 2100s; however the rise in local sea level might be more than the expected value (Thomas et al., 2014). As per Intergovernmental Panel on Climate Change (IPCC) Assessment Report 4 (2007), global sea level rise is estimated to be ~0.59 m in 2090s due to climate change (Pachauri and Reisinger 2007). Indian sundarban is often being affected by frequently originated gales from Bay of Bengal. Recently, it was exaggerated by Odisha (India) cyclone 1999, North Indian Ocean cyclone 2003, Sidr cyclone 2007, and Aila cyclone 2009. These cyclones badly damaged the mangroves forest, local habitants, faunas etc. by strong surges, flood, and salinity intrusion.
Human activities have continuous impact on sundarban ecosystem due to heavy population pressure, tourism activities, and other unsustainable development activity (Kanga et al., 2013). So, it is crucial to study about the changes in land use/ land cover pattern in these areas to assess the environmental penalties due to such modifications (Foody, 2002; Giri et al., 2005; Singh et al., 2017a).
Current scenario geospatial technology is playing an exciting role as a real time application in monitoring, mapping and management of natural resources (Giri et al., 2005; Ranjan et al., 2016a, Ranjan et al., 2016b; Singh et al., 2017b). Remote sensing imagery is a viable source for obtaining accurate information about the land cover at local, regional, and global scale (Ranjan et al., 2017; Singh 2016; Kanga et al., 2014; Kanga et al., 2011). Its specific capability of higher spatial resolution, repetitive coverage, and temporal coverage are endorsed for better and reliable use of satellite data. In mid of 1970, the United State Geological Survey (USGS) established an arrangement for land use/land cover change detection with remotely sensed satellite data, which are still being employed (Singh and Pandey, 2014). On account of advancement of higher resolution satellite imagery, it becomes easier to keep up-to-date the spatial information (Kanga and Singh, 2017). Integration of Remote Sensing technology with GIS environment has revolutionized the world for M-3 movement, which is employed for monitoring, mapping, and management of natural resources (Singh, et al., 2017). This cost and time effective technique has been broadly used to update and retrieve the land use/land cover information across Indian Sundarban delta since 1972 to 2017. Present study has focused to understand and analyse the transformation in land use / land cover pattern along with the destruction of mangroves forest within sundarban ecosystem. Also the impact of climate change and socio-economic impact of sundarban delta has been discussed based on the earlier studies.
Present research work is carried out over the eastern shoreline of India in the southern part of West Bengal state, well known as Indian Sundarban delta. It is geographically situated between latitude 21°13´ to 22°40´ North and longitude 88° 05´ to 89° 06´ East (Figure 1). Wide-ranging Indian Sundarbans are extended over an area of 9630 2 km out of overall area of sundarban delta which is 25500 2 km (Mondal and Bandyopadhyay, 2014). The rest part of the delta is stretched across Bangladesh, which is circumscribed in the middle of river mouth of Hugli on the West and Ichamati-Raimangal in the East (Bay of Bengal). In comparison of 180 km coastal length of West Bengal- India, the fruitful coastal length in Bangladesh is about 710 km. Out of the total 180 km coastal length of West Bengal, it has a shore length of 130 km. Indian sundarbans are spread across two districts; North 24-Parganas and South 24-Parganas having 6 blocks and 13 blocks respectively. Out of the 102 islands of Indian sundarbans, 48 islands in southern range are declared as Reserve Forest (RF) which is banned for human abode (Pramanik, 2015). Rest 54 densely inhabited islands are protected by 3500 km long embankment, from intrusion of saline water throughout high tide. Heritiera fomes is a leading mangrove species in sundarban, which is locally famous as Sundari. Within Indian Sundarbans, Anderson et al. (1976) explained 24 species of true mangroves belonging to nine families. Out of these, Rhizophoraceae presented extreme wealth at each of the generic and particular categories.
Figure 1. Location Map of Indian Sundarban Delta (Area of Interest) in False Colour Composite (FCC) Derived from Landsat TM and Area of Interest were Manually Digitized using Topographical Sheet
The study areas are conquered by cyclone, and are prone to flood; many of the years it was badly affected by cyclone (i.e. 1999, 2003, 2007, 2013, etc.). The tides of study area are semi-diurnal which show a discrepancy in different areas in the course of different seasons (Giri et al., 2005). These tides are influenced by the ocean at the entrance of Hugli River, also via the Ganga and Brahmaputra estuaries.
On account of accessibility of satellite imagery, four multispectral satellite data of Indian sundarbans were acquired from United State Geological Ser vice (http://glovis.usgs.gov/) which provides satellite imagery without any cost. Topographic maps at a scale of 1: 250000 were taken from library of Texas (http://www.lib.utexas.edu/map.ams/india/). All satellite imagery used were of Landsat series; imagery of 1972 belongs from Landsat MSS with 60 m of spatial resolution whereas imagery 1987, 2002, and 2017 belongs to Landsat Thematic Mapper (TM), Enhanced Thematic Mapper Plus (ETM+), Operational Land Imager (OLI), respectively with spatial resolution of 30 m as shown in Table 1. The spectral band of Landsat data ranges from visible (red, green, blue) to near infrared wavelength. During acquisition of satellite imagery, the attention was taken that all the data should belong to the same seasonal time period. Satellite imagery of 1972 is not covering entire study area; due to lack of data for same time period, that data were used. Some portion of the upper region is uncovered in 1972s data.
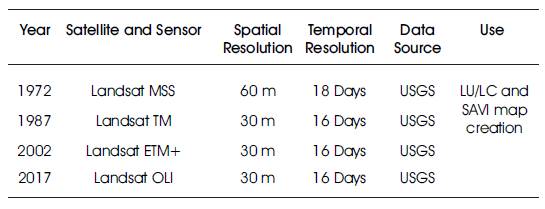
Table 1. Satellite Data used in the Present Study
Methodology of the present research work is broadly classified in to three phases; (a) Image Pre-processing: which consists of layer stacking of each band into single image file and creation of AOI (Indian sundarban), (b) Image Processing: it includes two digital image processing techniques. They are Random Forest Classification technique and Soil Adjusted Vegetation Index (SAVI). Random Forest Classification was done to assess the land use and land cover pattern along with mangroves destruction, whereas SAVI indices were used to assess the vegetation cover status over the study area, (c) Analysis and Assessment: this section comprises exploration and valuation of acquired information from image processing section. Entire image processing of satellite data were done in SNAP 5.1, ArcGIS 10.4, and ERDAS imagine 2014 software. The flow chart of the adopted methodology is presented in Figure 2.
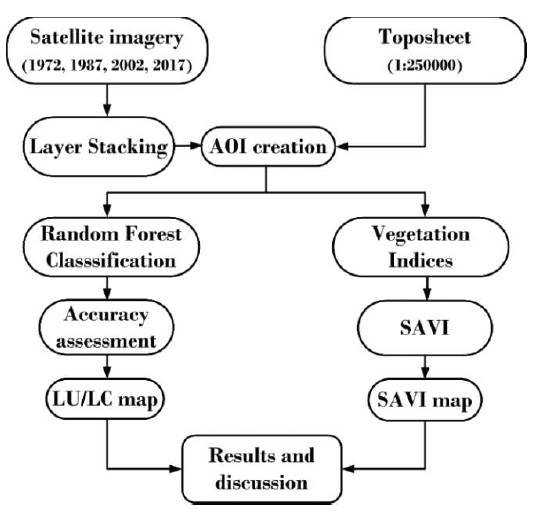
Figure 2. Flowchart of the Methodology used in the Present Study
A number of image processing techniques are being used for change detection analysis i.e. Conventional Image Comparison, Image Ratio, Principal Component Analysis (PCA), Multi-date Image Classification, Post Classification Comparison, Onscreen Digitization, Vegetation Indices (i.e. Normalized Difference Vegetation Index (NDVI), Enhanced Vegetation Index (EVI), Soil Adjusted Vegetation Index (SAVI)), etc. Present study incorporates two image processing techniques; Supervised Classification and SAVI (Indices). In supervised classification, Random Forest Classification technique was done using SNAP software for consistent mangroves zonation and LU/LC variation assessment whereas, SAVI were derived from red and NIR band in ArcGIS software, using raster calculator tool.
Random forest is a powerful and robust machine learning method being used for classification. Random forest algorithm is the supervised classification algorithm which uses the sets of decision tree as shown in Figure 3. It studies the training sets of each class and forms a classified raster for identical reflectance as output by averaging multiple deep decision tree. The random forest classification presents many advantages in remote sensing application i.e. it runs efficiently on large data, can handle thousands of inputs variables without deletion of variables, it is robust, and accurate to noise etc. Five land use/ land cover classes were categorized; mangroves, flooded area; mud flat or sandy area, water body, vegetation/agricultural land, and bare land/others. Training samples collection for each and every class were done based on the Google Earth experience of the study area. Ten numbers of the training samples were imitative based on the thumb rule. As there are five land use/land cover classes, the that total sample size is computed as 5*10*5=250 pixels. Further, the number of sample size for each class was determined by using ratio calculation (Table 2). All the five land use/ land cover classes were assigned a rank in ascending order of their total area. Hence, every single rank was divided by the total of the rank (i.e. 15). Finally, it was multiplied by the total number of pixel (i.e. 250) to compute the sample size for each class as shown in Table 2. The training samples were collected through on-screen digitization based on the visual interpretation experience.
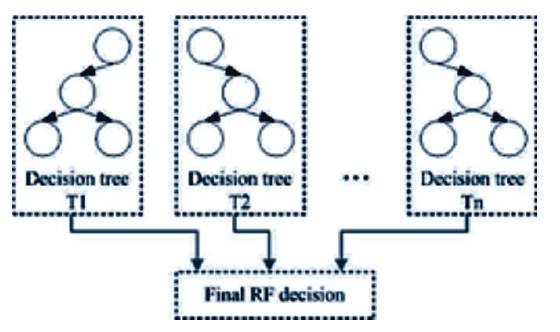
Figure 3. An illustration of Working Principle of Random Forest Classification Technique
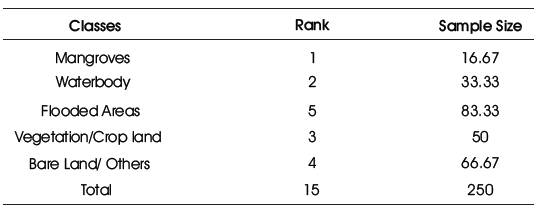
Table 2. Sample Size of the Test Point
Mapping of vegetation was accomplished using popular vegetation indices; Soil Adjusted Vegetation Index (SAVI). SAVI is a transformation technique, which was developed by A.R. Huete in 1988 as a modification of Normalized Difference Vegetation Index (NDVI) to suppress the influence of soil brightness. In the present study, SAVI has been preferred on account of “areas where the soil brightness, shadow or organic matter, and roughness variation are considerable; there will be influence of soil on vegetative index value”. SAVI is quiet similar to NDVI, but it is modified with addition of soil brightness correction factor. It reduces the brightness of soil and enhances the vegetation cover.
SAVI = [(NIR-R)/ (NIR+R+L)] x (1+L)
where, NIR represents the reflectance value of near infrared band and red is reflectance of the red band. L shows the soil brightness correction factor which lies between 0 to 1. Usually, L=0.5 is ideal in most of the cases and when L=0, then SAVI will be equal to NDVI.
Accuracy assessment is very important for reliable image classification results. Till now, a number of approaches have been established for validation. The geographical data precision is soundly presented by United States Geological Sur vey (USGS) in 1990 as: "Accuracy assessment or validation is a vigorous phase during the dealing of remote sensing data. It provides the information of resultant data for its reliability. Dynamic application of geo-data is feasible if the data excellence is well-known. Accurateness of classified map may be corroborated by paralleling the locations of points by matching with determined points. Therefore, without an accuracy assessment the output results are quiet little (Singh et al., 2017; Ranjan, et al., 2016b). To validate the result of land use/land cover classification, an error matrix has been prepared (Table 3). During accuracy assessment, a satisfactory result has been found from the classified image. Overall Accuracy (A ) of 1972s, 1987s, o 2002s, and 2017s has been obtained as 86%, 86%, 88%, and 86%, respectively (Table 3). With having a fair overall accuracy (A ), the image classification endorses for a o reliable land use/land cover classification outcome.
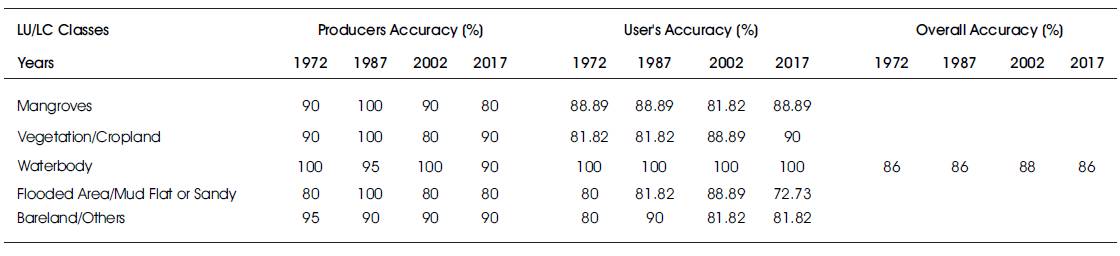
Table 3. Accuracy Assessment Table for the Classified LU/LC Classes Derived from Confusion Matrix
Mangrove forests are one of the major susceptible ecologies in the world. Due to increase in anthropogenic pressures and climatic variability along the coastal area, they are in the edge of demolition. Sundarbans ecosystem is located in the climatic hotspot, susceptible to climate change, sea level rise, salinity intrusion, and other natural calamities (Barik and Chowdhury, 2014; Chatterjee, et al., 2015). Mangrove wetlands of Indian sundarbans are being degraded due to increase in anthropogenic activities as well as natural disasters. Conversion of mangrove wetlands into aquaculture, agriculture land, destruction of mangrove forest for timber, etc. are identified as major human influences for mangroves destruction. Besides, the mangrove forests are being affected by local people in the last few years due to the lack of management (Banko, 1998) whereas, sea level rise, gales, floods, shoreline erosion, salinity intrusion, rise in global temperature, etc. are identified as major natural influences. Odisha cyclone (1999), North Indian Ocean cyclone (2003), tsunami Havoc (2004), Sidr cyclone (2007), and Aila cyclone (25 may 2009), etc. had caused the destruction and defragmentation of mangrove ecosystem in intertidal zone of Indian sundarban delta (Adam et al., 2013). Similarly, it is being frequently affected by the cyclones, originated from Bay of Bengal. Some authors have put their own opinion for mangroves destruction in sundarban delta. Ardil and Wolff (2009) stated “the administration system is poor for the management of ecosystem and generally local habitants are dependent on the mangrove ecosystem”. Likely, Ellison and Stodart (1991) reported that the mangrove forest in Sundarban area is destructing due to the unsustainable growth of shrimp farms. The present study tried to incorporate the existing spatial coverage of Indian sundarban delta based on the interpretation of satellite imagery. Four satellite images (i.e. 1972s, 1987s, 2002s, and 2017s) of study area have been processed through two well-known image processing algorithms. Using satellite imagery, it is difficult to accurately identify some spatial features when they have relatively same spectral reflectance. Hence, this study do not support any strong transformation in land use and land cover features.
Throughout the analysis of land use/ land cover maps, significant variation has been analysed as presented in Figure 4. Spatial distribution of different LU/LC features since 1972-2017 have shown a crucial relation between them. By observing the prepared land use/ land cover map, the changes in land use/ land cover pattern in study time are clearly realized. Except the Reserved Mangrove Forest (south-east), significant losses in mangroves cover can be noticed. Flooded or mud flat area and Bareland/others have been significantly increased over the years while, reasonable variation has been detected in vegetation cover / cropland and water body. Vegetation cover and cropland has been put in to same class due to complication in classification. Without field visit, it tough to differentiate with coarse resolution satellite data.
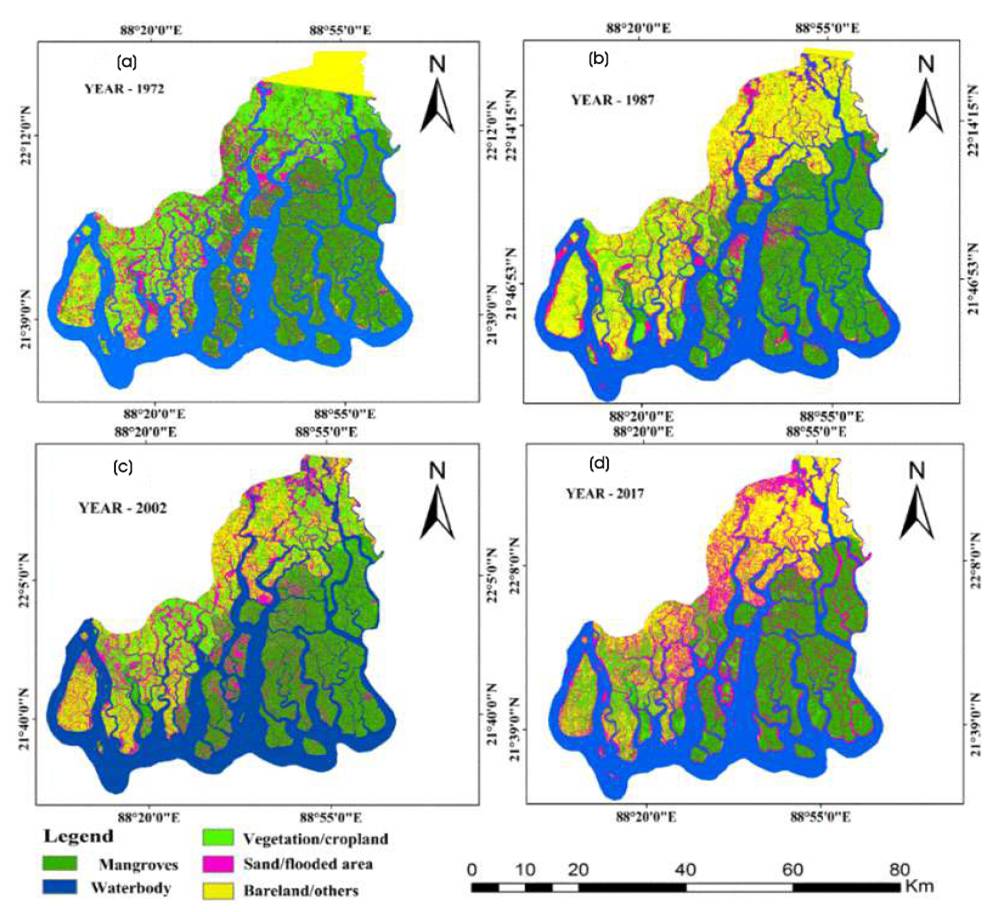
Figure 4. LU/LC Map of ISD for the Study Year (a) 1972, (b) 1987, (c) 2002, and (d) 2017
Due to lack of satellite data, map of 1972 is not covering the entire study area; top of the study area is uncovered, so it is showing as Bareland/others. Flooded/sandy area has gradually increased within study area. In 1972, it was only in fewer amounts in NW-SW portion of the study area; while it has smoothly increased towards RF in fair amount. In 2017, flooded area or mud flat is found in large amount in northern portion as well as in entire ecosystem with fewer amounts (in RF zone, it is noted in low lying areas). This drastic increase in flooded area/ mud flat may be due to flood or cyclone originated from Bay of Bengal in 2007 (Sidr cyclone) and 2009 (Aila cyclone). Similarly, it is noted as large amount in the map of 2002, which may be due to the effect of Odisha cyclone in 1999. For better analysis and assessment, statistics of all these features with their remarks has been presented in Table 4.
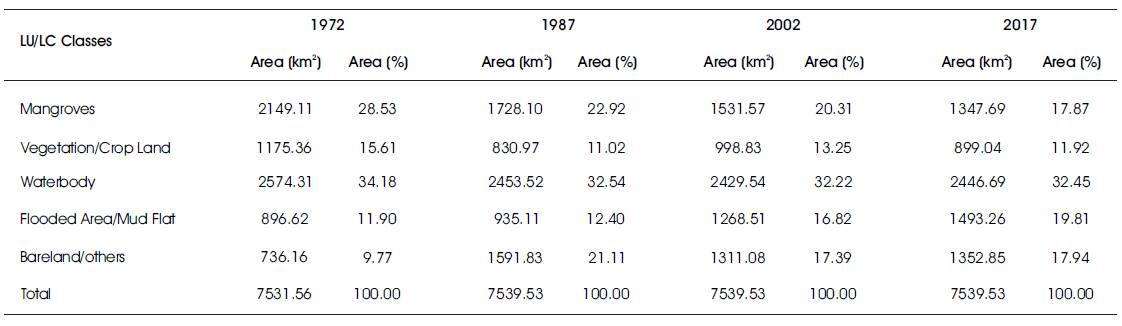
Table 4. Spatial Distribution of LU/LC Features over the Study Year
During analysis it is noted that, mangroves cover area has gradually decreased and transformed to other features i.e. cropland, vegetation or Bareland. In the year of 1972, 2 mangroves area was ~2149.11 km (~28.53%) which decreased to ~1728.10 (~22.92%), ~1531.57 2 (~20.31%), and ~1347.69 km (~17.87%) in 1987, 2002, and 2017, respectively (Figure 5). This figure points toward the destruction of mangroves area in great percentage, which is ~0.24% per year of the total study area. Loss in mangroves cover area can be easily noticed in prepared land use/ land cover map (Figure 4). These mangroves areas are converted into vegetation/cropland or Bareland/others due to anthropogenic activity or floods activity, as earlier discussed.
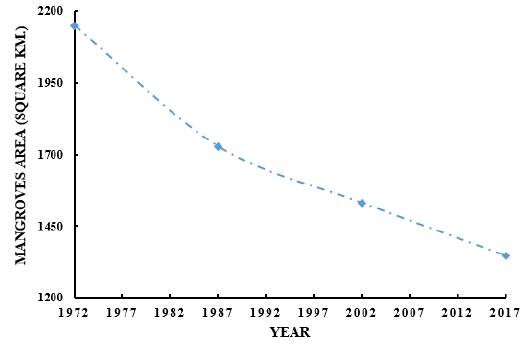
Figure 5. Graphical Representation of Dynamic Mangroves Destruction Trend across the Indian Sundarban Delta Over the Study Years
During 1972-1987, there was an extreme destruction of ~421.01 km areas in mangroves cover, which is ~5.6% of the study area. Likely vegetation cover/ cropland and 2 water body also have a decrement of ~344.39 km and 2 ~120.79 km respectively, which is ~4.59% and ~1.64% of total study area (Figure 5). These areas got converted into Bareland/others or flooded /mud flat area. In this time period, Bareland/others area increased in great 2 percentage that is ~11.34% (~855.67 km ). Similarly, flooded / mud flat area has shown a slow increment of 2 ~0.5% (~38.49 km ). Such variation in mangroves cover, vegetation/cropland covers, and water body is quite difficult to admit. Especially loss in mangroves covers, vegetation cover, and increment in Bareland/others has shown a dramatic variation. These variations may be due to seasonal variation in the study area or due to classification error. Overall accuracy (A ) for the year 1972 0 and 1987 was 86%, whereas users’ accuracy (A ) for u mangrove classification was 88.89% in 1972 and 1987 (Table 3). Vegetation/cropland and flooded /mud flat area have user's accuracy (A ) of 81.82% and 81.82%, u and, 80% and 81.82% in 1972, and 1987, respectively.
Throughout the years 1987-2002, a reasonable loss in mangroves cover as well as in Bareland area has been 2 noticed. Loss in mangroves cover was ~196.53 km 2 (~4.58%), and ~280.75 km (~3.72%) Bareland area has loosed whereas, as drastic increase in flooded / mud flat area has been recorded, which expanded to ~333.46 2 km (~4.42%) within the study area. These variations show the impact of anthropogenic activity as well as natural influences. In this time period, there may be a small increase in human population which affects the ecosystem to fulfil their basic needs as natural influences such as sea level rise, upswing in global temperature, shoreline erosion, gales, etc. have sensible impact on this ecosystem. In the time inter val of 1987-2002, a detrimental cyclone (November, 1999) had stroke in coastal zone of Odisha which is known as odisha cyclone. This may also be an important reason behind the destruction of mangrove area in large amount, and increase in flooded or mud flat area in excessive amount. Odisha cyclone was recorded as the most strong and destructive tropical cyclone in the North Indian Ocean. It caused several losses of human life, animals, and other natural properties.
In the period of 2002-2017, mangrove area and 2 vegetation cover decreased to ~2.44% (~183.88 km ) 2 and ~1.33% (~89.79 km ) of the total area whereas, a reasonable increase in flooded /mud flat area has been 2 seen; approximately ~2.99% (~224.75 km ) area has been increased. These reasonable variations in mangroves area, vegetation cover and flooded / mud flat area, show the impact of Havoc cyclone (Dec. 2004), Sidr cyclone (Nov. 2007) and Aila cyclone (May. 2009). Except these most vulnerable cyclones, some less vulnerable tsunami/ cyclone (with respect to loss in ISD) had taken place during 2002-2017. These are Cyclone Giri (Oct. 2010), Komen (July, 2015), Viyaru (May, 2016), etc. which have also contributed to increase flooded / mud flat area in fewer amount. Loss in mangrove cover th also points towards the influences of human activity in 20 century i.e. population pressure, conversion of mangrove area into aquaculture, and cropland, etc.
Throughout the comprehensive analysis of land use /land cover pattern, it is observed that mangroves ecosystem consistently decreased with the rate of ~0.24% of total area whereas, vegetation cover/ cropland area has shown a mixed variation. From 1972-1987, it decreased to ~4.59% with the rate of ~0.31% per year. While, it increased to ~2.23% during 1987-2002 with an increment of ~0.15% per year. Again vegetation cover reduced to ~1.33% with decrement of ~0.09% per year. On other hand, waterbody had no significant variation to notice. But, in the period of 1972-1987 it was decreased to ~1.64% with the rate of ~0.10% per year. Further, flooded / mud flat area have also shown a reasonable increment of ~7.91% (~0.18% per year) since 1972-2017. Similarly, mixed variation has been noticed in bareland/others. During 1972-1987, drastic increase was found which may be due to seasonal variation or classification error as discussed earlier (Table 3). In this period, bareland was increased to ~11.34% at the rate of ~0.77% per year, which shows a great increment. While it decreased to ~3.72% during 1987-2002 at the rate of ~0.25% per year. After that there was a slight increment of ~0.55% with ~0.04% per year. All these variations since 1972-2017 in different land use/land cover features can be seen in bar diagram (Figure 6).
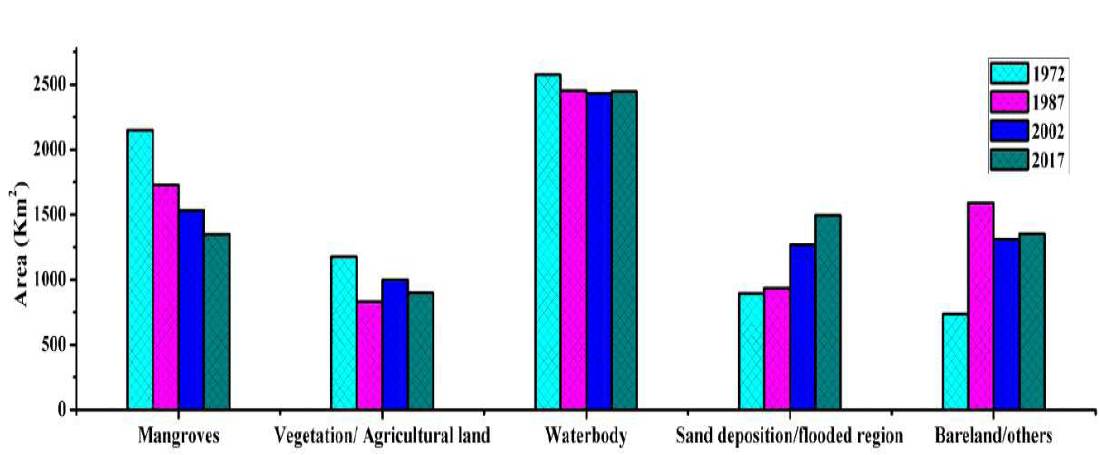
Figure 6. Graphical Representation of LU/LC Class Variation for Study Years over Indian Sundarban Delta
Four SAVI maps of study area have been prepared in equal interval of 15 years, which is 1972s, 1987s, 2002s, and 2017s (Figure 7). Using natural breaks, SAVI value has been categorized into five respective classes i.e. waterbody, flooded / mud flat area, bareland, low dense vegetation, and high dense vegetation. These classes are categorized in ascending order from negative value to positive value as presented in Table 5. Throughout its assessment, some significant changes has been noted i.e. loss in greenness value over the year. Range of SAVI value in 1972 was recorded as -0.67 to 0.61, whereas it was -0.53 to 0.57 in 1987, -0.57 to 0.54 in 2002, and -0.54 to 0.48 in 2017. It is crucial to see that higher SAVI value is gradually decreased over the years. Fall in positive value shows the loss in greenness of vegetation, due to stress of various anthropogenic as well as natural activities.
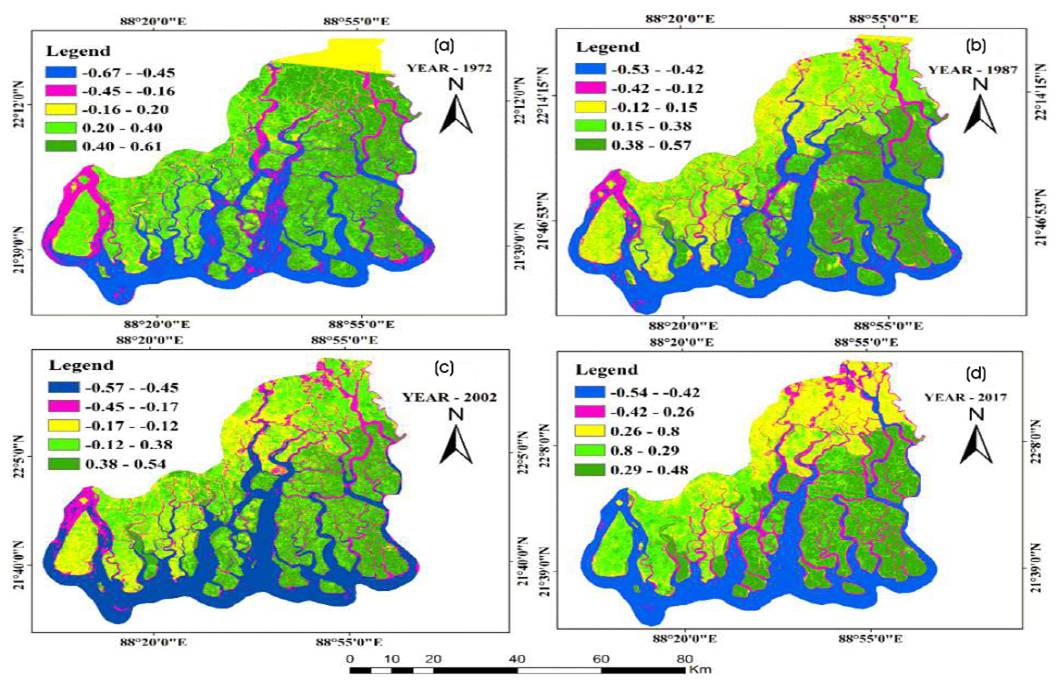
Figure 7. SAVI Map of Study Area over the Year (a) 1972, (b) 1987, (c) 2002, and (d) 2017 and the SAVI Ranges were Classified based on the Natural Breaks
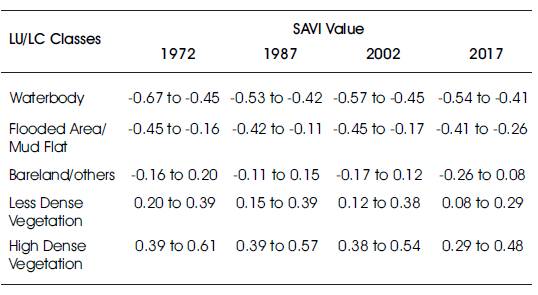
Table 5. SAVI Value for individual Features and Categorized using Natural Breaks
The spatial pattern and condition of healthy mangrove or vegetation is different in different classification periods. By observing Figure 7 (a), the large spatial extent of dense vegetation as well as less dense vegetation can be easily understood whereas, lesser spatial coverage of bareland, flooded area or mud flat has also been observed. While, condition of less dense vegetation and high dense vegetation has little degraded in 1987 as compared to 1972 (Figure 7 (b)). In 1987, bareland/other have increased in north-west portion at greater amount. In this year, effect of climate change and effect of anthropogenic influences can be experienced. Further, condition of vegetation has degraded in greater amount in the year of 2002 as shown in Figure 7(c). SAVI value of highly dense vegetation also comes down to 0.54; these values can be experienced in Reserve Forest portion only. In 2002, both the highly dense vegetation and less dense vegetation features are decreased with increase in bareland area. Similarly, in 2017 the spatial extent of highly dense vegetation and less dense vegetation has decreased and area extent of bareland and mud flat has increased (Figure 7(d)). These negative variations in vegetation cover and increment in bareland, flooded area, and mud flat shows the impact of various natural as well as anthropogenic influences. This signifies that the mangroves are directly or indirectly influenced by climate change and their related effects over the periods.
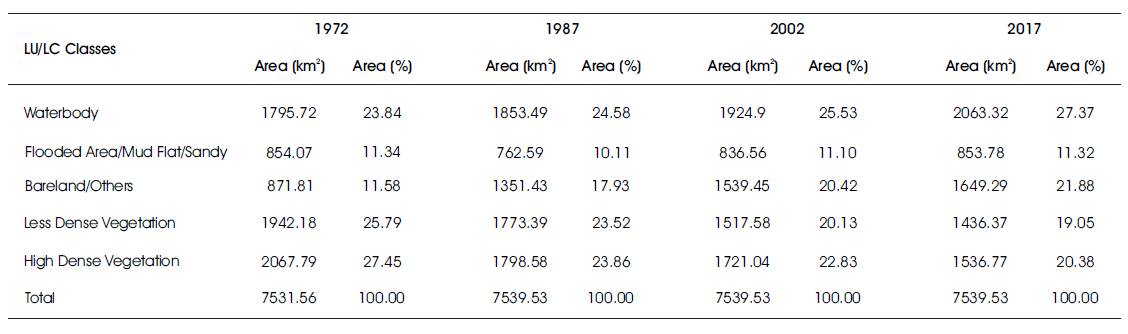
Table 6. Area Coverage of the Individual Spatial Features over Indian Sundarban Delta with Respect to Study Years
The spatial distribution of various features over the different study year is well shown by pie diagram (Figure 8), which will make easy to understand the area coverage by various features in particular year.

Figure 8. Pie Diagram of the LU/LC Classes with their Spatial Coverage Percentage for the Years (a) 1972, (b) 1987, (c) 2002, and (d) 2017
The Indian sundarban covers 102 small islands extended over ~9630 sq. km in which 54 island covers 5370 sq.km with human population of 4.2 million as per the census 2011 whereas, rest 48 islands covers reserved mangrove forest across ~4260 sq.km and these islands are restricted for human settlement. The peoples of the sundarban delta are mostly allied on agriculture activity for economic purpose. Rice, sugarcane, jute, betel nuts, and coconut are the primary agricultural practices in sundarban which contribute the rural economy as well as economy of South 24 Paraganas. People are also allied on fishing, honey collection, and timber collection from forest. In the lack of alternating occupation people are highly dependent on the mangrove forest to earn their livelihood for timber wood, firewood, honey collection, etc. Hence, a strong relation can be seen between sundarban mangroves and socio-economic of the local human beings.
The sundarban delta is already pretentious through the climate change by rise in sea level, intrusion of salinity, and extreme meteorological events i.e. rise in Sea Surface Temperature (SST), air temperature, cyclone, gales, storms, flood, etc. Especially, sea level rise is the foremost reason for coastline erosion and submergence of landmass which influence the physiographical changes to restructure the ecosystem whereas, cyclone affects the sundarban through wind damage, storm surge, and sedimentation. The sediments transported by storm surges are dumped on the forest base as the surge retreats, which origins the plant mortality by intrusive with root and soil gas interchange, leading to eventual loss of the floras. Storm surges shrink the feasibility of seeds, seedling germination, and seeding recruitment. In the last 100 years, the frequency of cyclone in the Bay of Bengal has increased to ~26% which may increase the escalating of El Nino in the upcoming days. Some recent cyclone activity which has affected the sundarban ecosystem are listed in Table 7.
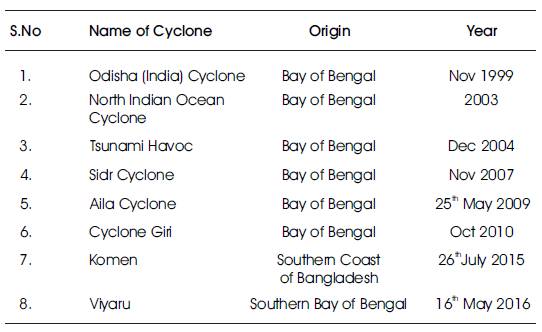
Table 7. List of Cyclones which has affected the Sundarban Delta
Due to the higher salinity intrusion, the Sundari mangroves trees are being deteriorated, although altered salinity pattern would endorse the changes in the habitat of many plant species, wildlife, and fishing activity etc. Similarly, human deeds (cutting of mangrove tree for burning material, transformation of mangrove area to aquaculture, agriculturall and, unsustainable development activity, tourism activity, population pressure, etc.) are also responsible for local climate change within the study area.
Roy et al. (2011) have shown that 7% dry land of the sundarban delta would be submerged in 2100s due to rise in sea level up to ~88 cm and rise in sea level will lead to higher salinity intrusion. The low saline area (0-1 ppt) would decline from ~10.8% in base state up to ~4% with 88 cm Sea Level Rise (SLR) by 2100s. In a study by Zoological Society of London (ZSL) in 2012 revealed that Sundarban coast was disappearing up to 200 m (660 ft) in a year. Around 17, 179 hectares area of mangrove has been destroyed by agricultural activity within three decades (1975-2010) and ~7554 hectares area has been destroyed by shrimp cultivation. A report by Haq (2010) has stated that by the end of 21 century the rise in sea level up to ~45 cm combined with other form of anthropogenic stress on the sundarban may lead to the destruction of 75% mangroves.
A study by the researchers of the School of Oceanographic Studies, Jadavpur University estimated that, in the year of 2010 the annual sea level rise to be ~8 mm, and it has caused the submergence of ~7500 hectare area of mangrove forest. This tied with ~1.5 °C rise in sea surface temperature with increased salinity level which caused the trouble for the survival of the local habitants. In such an adverse condition, the fish species may migrate which will affect the economy of local people. The Sundari trees are the most vulnerable to salinity; as a result, Sundari trees are being vulnerable with destruction. Damage of the mangrove forest will affect the protecting biological safeguard against cyclone, tsunami, floods, etc. This transformation can place the surrounding seaside societies in danger situation. The submergence of land mass have rendered ~6,000 families homeless and ~70,000 individuals are instantly susceptible with the same (CEGIS 2006). Hence, the impact of climate change would influence the physiographical changes which would slowly re-shape the sundarban mangrove ecosystem. Subsequently the climate change has direct adverse impact on the income level, occupation, and the economy of the local people (Cornforth et al., 2013; Wikramanayake et al., 1998; Sinha et al., 2014).
The present study tried to bring up a qualitative and quantitative spatial status of Indian sundarban delta since 1972 to 2017, in an equal interval of 15 years. Based on the two image processing techniques, land use/ land cover change analysis, and vegetation monitoring has been done. Throughout its analysis and assessment, some significant changes in mangroves ecosystem and land use pattern are assessed. During the analysis of land use/ land cover change, mangroves area was found to be under stress. Mangroves cover area has degraded at the rate of ~0.24% of the total area during the study year. While flooded / mud flat area has shown an increment at the rate of ~0.18% of total area during the study year. Cropland/ vegetation and bareland have shown a reasonable mixed variation within Indian sundarban delta. Loss in mangroves area and rise in mud flat or flooded area shows the effect of strong gales, which is frequently originated from Bay of Bengal. Land use/ land cover pattern of Indian sundarban is transforming in dramatic way due to various natural as well as anthropogenic activity i.e. SLR, rise in global temperature and sea sur face temperature, shoreline erosion, population pressure, tourism etc. The lowland coastal regions and higher population with larger mangrove compactness are maximum vulnerable, because there are minor social and financial adaptations. Thus, the sustainability of mangroves is typically reliant on locational physical characteristics and durable thoughts along with commercial deeds.
Similarly, during analysis of SAVI maps it was noticed that vegetation cover of Indian sundarban delta is under threat due to various anthropogenic and natural activity. SAVI value for highly dense vegetation and low dense vegetation gradually came down over the study year due to numerous stresses on vegetation. As per SAVI analysis, highly dense vegetation and low dense vegetation have decreased at the rate of ~0.16% and ~0.15% respectively in study year whereas, bareland/others have shown an increment with the rate of ~0.22% of total area. Thus, the study discloses that mangroves are one of the most vulnerable ecosystems in Indian sundarban delta which are in the verge of destruction owing to continuous anthropogenic stresses and climatic variability. An anthropogenic deed has created more threat to mangroves when compared to sea level rise. However, it may encompass a considerable quantity of projected loss of mangroves in future.
Authors extend their sincere thanks to United State Geological Survey (USGS) for providing Landsat satellite data in free of cost. Authors also thank the anonymous reviewers for their constructive and valuable suggestions to enhance the quality of the manuscript.