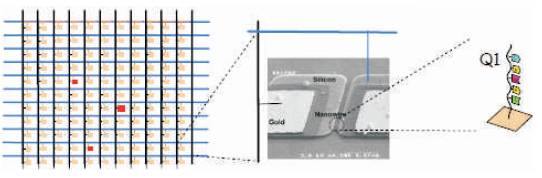
Figure 1. Nanosensor array and DNA sensor [11]
In this paper, the mathematical models required to describe the functionality of nanodevices have been reviewed. Based on these mathematical models sensor equivalent circuits have been developed. An experimental setup is developed to analyze the characteristics of IS Field Effect Transistor (ISFET), nanowire and nanosphere devices. The impact of geometrical properties on device performance is estimated based on the experimental setup. Settling time and surface analyte concentration graphs obtained using the experimental setup is used in designing a nanobio sensor for disease detection. Based on the test results, a mathematical model has been developed in Matlab to model nanodevices. The sensors modeled can be used for automated drug detection and delivery unit.
Exhaustive studies and developments in the field of nanotechnology have been carried out and different nanomaterials have been utilized to detect cancer at early stages [1]. Nanomaterials have unique physical, optical and electrical properties that have proven to be useful in sensing. Quantum dots, gold nanoparticles, magnetic nanoparticles, carbon nanotubes, gold nanowires and many other materials have been developed over the years. Nanotechnology has been developing rapidly during the past few years and with this, properties of nanomaterials are being extensively studied and many attempts are made to fabricate appropriate nanomaterials [2-4]. Due to their unique optical, magnetic, mechanical, chemical and physical properties that are not shown at the bulk scale, nanomaterials have been used for more sensitive and precise disease detection. For developing a system to detect disease, software modeling is one of the major requirements. Matlab environment is predominantly used for developing software reference models. Various sensor models (electrical and mechanical) are already inbuilt in Matlab and are readily available for development of automotive and mechanical system [5-7]. There are a large number of nanobio sensors that are being used for medical applications in disease detection. There is a need for a mathematical model of nanobio sensor for developing a software reference model in disease detection using Matlab. Thus in this work, the authors developed a mathematical model for nanowire, that is used for cancer detection. Section I discusses the geometrical and mathematical models of nanowires. Section II discusses the diffusion capture model that is used for modeling nanosensor, section III presents the experimental setup for simulation of nanowire sensors and design of biosensors. Section IV presents the Matlab models developed based on the simulation results obtained.
Human genomes have billions of DNA base spheres to sense the DNA sequence. Arrays of sensors are used for genome sensing. Nanobio sensor consists of X-Y array of elements. These elements further consist of pixels called as electronic components [1]. Each component is a sensor that can be a nanowire transistor, carbon nanotube, planar transistor etc. Each element has a unique and known DNA sequence (genome) bound to the sensor. As in Figure 1, Q1 is one such sequence consisting of ACGAT [8-10] molecule arranged in an order. Each location in the X-Y array has a known sequence attached to it. Figure 1 shows the array of sensors, and the corresponding DNA sequence attached to the sensor.
Figure 1. Nanosensor array and DNA sensor [11]
When an unknown DNA sequence is introduced into the XY array, the unknown sequence finds its conjugate in the XY array and binds with the DNA sequence present on the array as shown in Figure 2. Since the DNA sequence at every location along the XY array is known, the binding of unknown sequence with known DNA sequence modulates the current in the corresponding element in the XY array.
Thus by detecting the amount of current change, the corresponding concentration of unknown DNA sequence in a given electrolyte is detected. This is the basic principle of detection in nanobio sensor. Figure 2 shows the change in conduction of sensors due to detection of unknown sequence. There are different kinds of nanobio sensors such as Chem FET, IsFET, Nanowire, Nanosphere, Nanodots and Carbon Nano Tube [CNT]. Sensitivity is one of the major parameter that needs to be considered to select an appropriate sensor for drug delivery. Sensors consist of source and drain regions placed above a gate. Gate consists of receptors that capture the unknown molecules that diffuse across the target molecules. Figure 3 shows the two basic kinds of sensor (ISFET and Nanosensor).
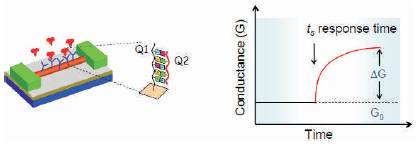
Figure 2. DNA strand and sensor response time [11]
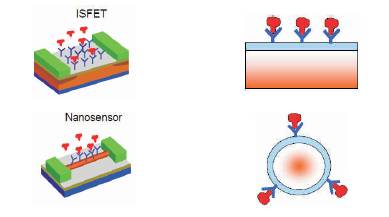
Figure 3. ISFET and Nanosensor [11]
Current flows between source and drain, and the molecules that are bound to the sensor determine the source-drain current. The sensitivity of such sensor is found to be between molar and few micro molar (10-6 M) [11]. This is a very small value. It is therefore essential that sensors should have higher sensitivity for diseases detection. To improve sensitivity of a sensor for bio applications, CNT were introduced. The sensitivity of CNT sensors compared with nanosensor is increased by several orders of magnitude (femto molar) for biomedical applications. In order to further improve sensitivity, nanodots can also be used. It is found in the available literature that the cylindrical or nanowire sensors are much better than planar sensor. The reason for this lies in the geometry of electrostatics. In a nanowire, the unknown molecules surround the gate consisting of receptor molecules as compared to a planar transistor where the receptor molecules are on top of the plane. Thus there is a higher sensitivity in nanowire. The currents in nanowires are in tens of nanometer dimension, which is very large. The cross section of nanowire sensor is shown in Figure 4. The nanowire is immersed in water or pH containing material and the DNA molecules are swimming around in the electrolyte.
In order to understand or model sensor for use in drug delivery applications, it is essential to analyze the working principle of nanowire sensor and develop mathematical relationships that can be used in sensor design. A sensor consisting of numerous receptors is shown in Figure 4. The unknown molecules (target) are captured by the receptors as they diffuse along the surface of receptors, only when the unknown molecule has s conjugate sequence compared to the receptor sequence. It is essential to establish the relationship between number of molecules detected, current, time involved in detection and concentration of molecules.
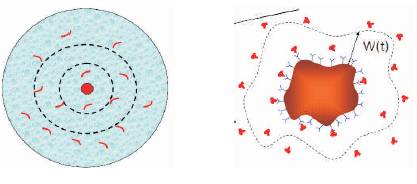
Figure 4. Diffusion region and sensor detection boundary [11]
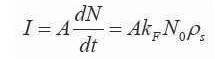
There are two equations that explain the diffusion-capture activity in a nanobio sensor. The capture equation is as shown in (1):
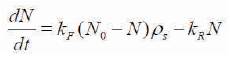
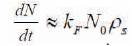
N is the number of conjugated molecule, N0 is the initial number of molecules (receptors, blue y shaped). The numbers of conjugated molecules are proportional to number of unconjugated molecules and are determined by (N0 -N), where kF is reaction constant. There are possibilities of molecules that are bound to deconjugate due to chemical reaction. The second term kRN represents the number of deconjugated molecules (kR is reverse reaction constant). Deconjugation is very weak in nanobio sensors, and hence the diffusion equation can be approximated to the equation as shown in (2):
ρs is the surface concentration of the captured molecules. As the molecules present in the electrolyte diffuse across the receptors, the diffusion equation is given in (3),
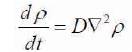
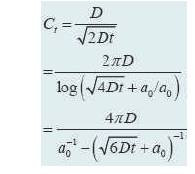
D is the diffusion coefficient; ρ is the concentration of molecules. This equation defines that the molecules have to diffuse around the sensor surface before they could be captured. It is essential to establish an analytical solution for the above two equations in order to understand the sensitivity of sensors. The diffusion-capture equation [12- 14] needs to be solved to understand the behaviour of the sensor. Consider the Figure 5(a). It consists of a cylindrical sensor (red) at the centre, and the outermost red circle is the area of constant density. It is necessary to find the number of molecules per unit time that will be captured by the sensor, if uniform density is maintained within the outermost circle.
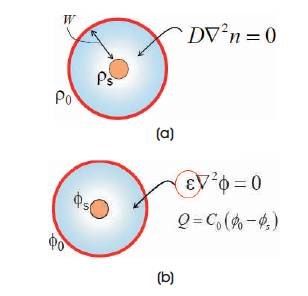
Figure 5(a). Diffusion boundary (b). Electric field boundaries
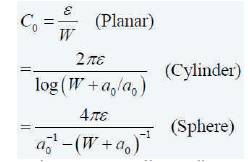
ρ0 is the concentration at the boundary at a distance of W from the sensor, and ρs is the concentration of molecules at the sensor surface. Howard burg [15] in 1960 equated this problem with a coaxial capacitor problem as shown in Figure 5(b) considering a capacitor with central field Фs and boundary potential of Ф0 at a distance, W the electric field and the potential is related using poisson equation. Diffusion constant D is equated with є in a capacitor.
As per poissons equation, the charge Q is related to capacitance and potential is given in (4),
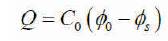
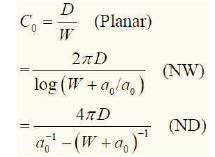
The capacitance Co is given by the equations (5) for various geometries of capacitors.
By using the above equations, the solution for a nanowire sensor is given in (6)-(7):
Electrostatic constant i.e. the dielectric constant є is replaced by diffusion constant D. Consider equation 6, solving for this equation, the rate of change of number of molecules captured changes the flux and is given by the equation (8) (substituting for dN/dt).
Solving the equations (6)-(8), gives the solution for number of molecules captured and is given in (9)
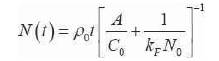
The equation (9) is used to compute the number of molecules that have been captured for a certain period of time. The capacitance Co is chosen based on different kind of sensor being used. Thus it can be seen that the dimensionality of sensor influences the number of molecules captured, thereby affecting the sensitivity of the sensor. The above analysis is carried out assuming steady state analysis, i.e. the concentration of diffusion is constant within the outer boundary. In order to model the sensor behaviour in transient state, Figure 6 shows a sensor at the centre, and the analyte with unknown molecules (blue). The sensor captures the molecules closer to it and as the distance increases the analyte concentration increases, and the molecules closer to the sensor are being captured (white).
As the boundary of diffusion changes and is time dependent, the factor W is time dependent. The boundary surface increases with time as in Figure 7.
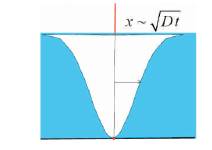
Figure 6. Diffusion changes
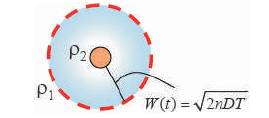
Figure 7. Variable diffusion boundaries [15]
Thus the diffusion concentration is varying with time and the modified equations for N(t) is given in equation in (10).
For different sensors as shown in Figure 8, the factor W changes with the geometry.
Based on the mathematical models developed for different sensors, the mathematical models have been validated with numerical simulation results.
From the results obtained and given in Figure 9 it is found that the planar sensor is less sensitive compared to nanosphere sensor.
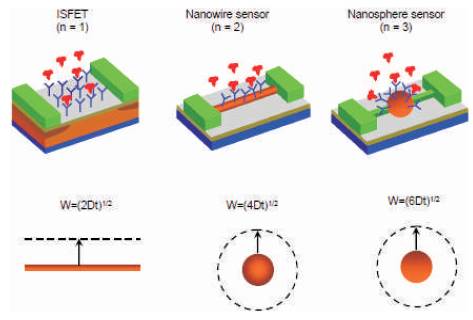
Figure 8. Different types of sensors [15]
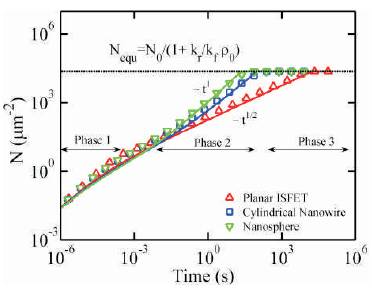
Figure 9. Analyte concentration variations [15]
Based on the mathematical models discussed, biosensor tool available in Nanohub.org is used for simulation of ISFET, nanowire and nanosphere. For a biosensor the most important parameters that are required are:
Based on the above parameters, the parameters in the biosensor lab is developed and the models available in the sensor lab are simulated. Figure 10 shows the experimental setup using the biosensors lab for simulating three different sensors.
Figure 11 shows the simulation results for three different sensors, and their characteristics based on the design parameters.
Figure 11 shows the graph of surface analyte concentration variation with time (ISFET – green, Nanowire-Red, Nanosphere-Blue). From the results, it is found that the analyte concentration dips largely for nanosphere at 1E0 time, indicating the detection of targets by the receptors in a given analyte. Thus, nanosphere has good sensitivity compared with nanowire and ISFET.
Figure 12 shows the conjugated receptor density against time. It is found from the graph that there exist linear relationships amongst all the three sensors. As the surface analyte concentration is reduced (Figure (11)), the conjugated receptor density also gets affected. Figure 13 shows the settling time for all three sensors. As the concentration increases, settling time has large variation for nanosphere compared to nanowire and ISFET, thus nanosphere is more sensitive to concentration of target ions. From the results obtained, nanosphere is found to have higher sensitivity to analyte concentration. Thus diseases are detected with higher accuracy. However, the construction of nanosphere is quite complex. In this work, nanowire is selected for sensor modeling.
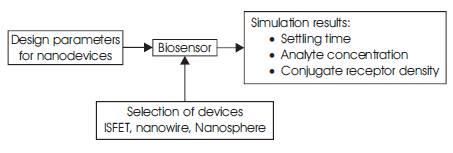
Figure 10. Experimental setup for sensor characterization
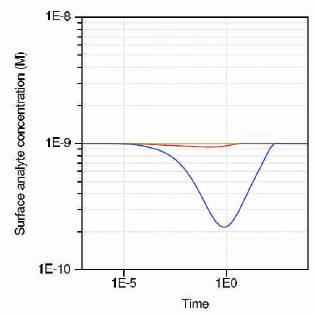
Figure 11. Surface analyte concentration of three sensors
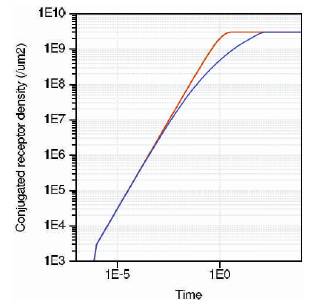
Figure 12. Conjugated receptor density
A silicon nanowire is developed with the following parameters, the VI characteristics of the nanowire is simulated using the biosensor tool. Sensor parameters: Diameter of silicon nanowire: 10nm, Oxide thickness: 5nm, Gate length: 50nm, Channel doping: 1 e+21 /cm3. Analyte concentration parameter is varied from 0.1 to 1 nmol/L and corresponding changes drain current in the nanowire sensor is determined. Figure 14 shows the graph of concentration vs. device current characteristics for nanowire sensors.
Table 1 shows the equivalents in terms of voltage samples for various sets of iterations carried out. The results have been obtained using Matlab simulations.
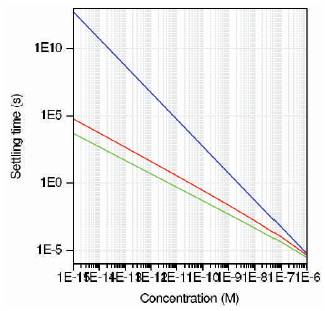
Figure 13. Settling time vs. concentration plot for three sensors
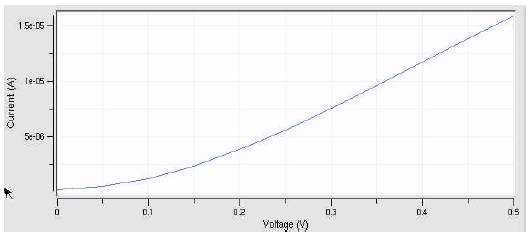
Figure 14. Concentration vs. device current
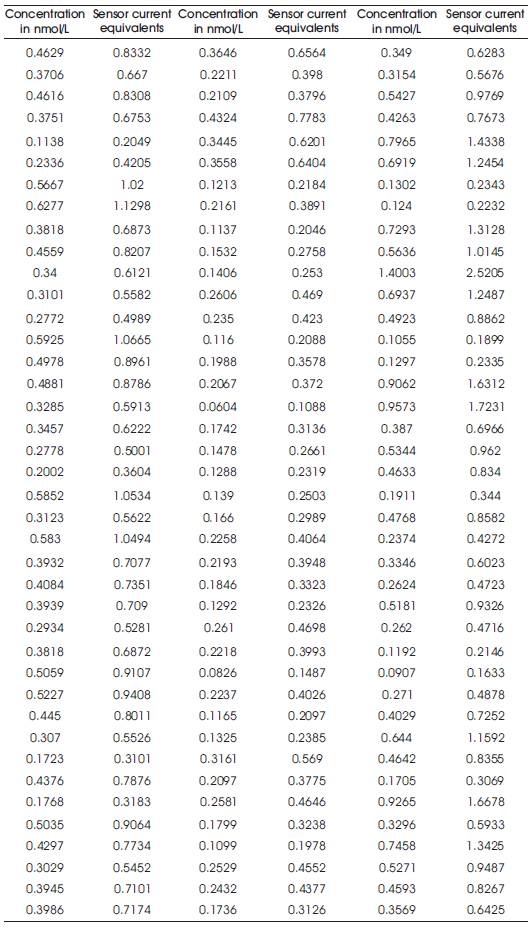
Table 1. Sensor Equivalents
From the results obtained using biosensor lab, a Matlab model is developed for silicon nanowire. The Matlab model is based on the results obtained in Table 1. The experimental setup developed using biosensors lab is used to identify the equivalent current values that flow in the drain of nanowire sensor with changes in analyte concentration. During the experimental setup, 135 different values of analyte concentration are set to identify the variations in drain current. The analyte concentration is varied from 0.1 to 0.5 mmol/L and corresponding drain currents are identified and recorded. The Matlab model is a look up table of these values obtained in the biosensor lab. Figure 15 shows the top level diagram of Matlab model for nanowire sensor.
The Matlab model developed is used in developing system level design of disease detection unit using nanowire sensors. In order to validate the developed Matlab model with biosensor model, an experimental setup is used to compare the performance of Matlab model with the biosensor model. Figure 16 shows the results of the two sensor models.
From the results obtained it is found that the Matlab models (red), have the same variations as that of biosensor models (blue), but the numerical values of both the models have a maximum deviation of 1.2. The Matlab models developed follow the variations of biosensor models, but have an error of 1.2. It is therefore recommended that during system development this error needs to be addressed during signal processing.
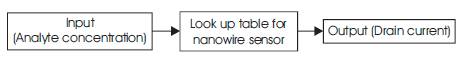
Figure 15. Matlab model developed using look up table

Figure 16. Matlab simulation results
In this paper, the authors have analyzed the mathematical models for nanowire sensors and the variation in sensor properties with geometrical parameters. Experimental setup is developed to simulate three different nanosensor (ISFET, nanowire and nanosphere). Sensitivity of nanosphere is found to be better than nanowire and ISFET, however, it is practically difficult to realize nanosphere. Thus nanowire sensor is selected for system level design (disease detection), nanowire sensor is simulated and its response to variations in analyte concentration is identified. The developed mathematical model is validated against biosensor model, the results shows that both the models have linear variations for changes in analyte concentration, but there is an error of 1.2 (maximum), between the drain currents of biosensor model and Matlab model. This can be minimized by developing accurate results using the biosensor model for large number of analyte concentration. The mathematical model developed can be used to model different sensors using Matlab. The sensors can be interfaced with signal conditioning circuits and control unit for automated disease detection and drug delivery.
The authors would like to acknowledge Nanohub.org for providing permission to access the biosensor labs simulation tools and to carry out the experiments. The authors also acknowledge the support and guidance provided by Cyril Prasanna Raj P., MSR School of Advanced Studies, Bangalore. His inputs and timely guidance has helped us to carry out the experimental analysis.