(1)
In this paper, an image fusion technique in spatial domain using an image variance as a focus measure has been demonstrated and discussed. The Image Variance (IV) is used as a focus measure to measure the depth of field in the images. Then it is applied in the fusion process of fusing images in diverse focuses. The experiments were performed on a set of left and right focused images and the fused results were evaluated with various equal sub block sizes of the images.
Image fusion is a process of combining or fusing images that is acquired using various sensors. As the images are obtained from various sensors, it is very difficult for the users to get the information from the single image. So, it is necessary to fuse the images for better information content. In this paper, the image fusion process is applied to the images which are obtained with different focal settings. This happens when the cameras suffer from the problem of limited depth of field.
The fusion of images with diverse focuses is referred as multi-focus images fusion. It is a kind of image fusion, which is a sequel to data fusion. A number of image fusion techniques have been found in the literature for fusing images with different focuses. The image fusion methods for such techniques were categorized into spatial domain methods and frequency domain methods[2]. A sufficient work has been done in frequency domain methods. But very few approaches were found in the spatial domain methods. In this paper, an approach using spatial domain method which measures the information level or activity level in an image is suggested. The computation of focus measures is a type of spatial domain method.
The computation of focus measures does not involve complex operations and the fusion process which uses these measures are computationally simple and can be applied in real time applications. Several focus measures were studied as the measures of image clarity, in the field of multi-focus image fusion[3, 4, 6]. A multi-focus image fusion scheme using quality assessment of spatial domain and genetic algorithm is studied in [7]. The following sections discusses about the multi-fusion image fusion algorithm using image variance and its evaluation.
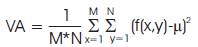
Multi-focus image fusion is a process of combining images, which are acquired in different focal settings. These images are obtained due to the limited depth of field of the optical lenses. In this paper, an image fusion using a focus measure in spatial domain has been studied and demonstrated. The focus measure is defined as the one, which is used to measure the depth of field in an image. It generally decreases as the defocus increases. The characteristics of the focus measures are uni-modal, independent of the image content, minimal computation, robust to noise etc, [3]. In this paper, an image variance has been used as a focus measure. The variance [3, 5] is the simplest focus measure and it is expressed for the M*N image f(x,y) as follows.
where μ is the mean value and it is given as
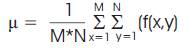
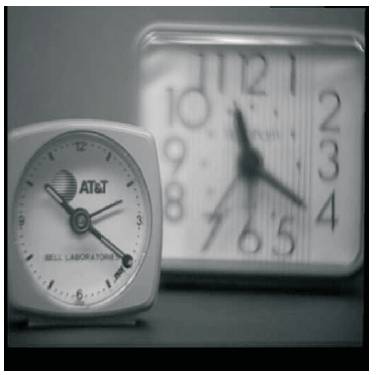
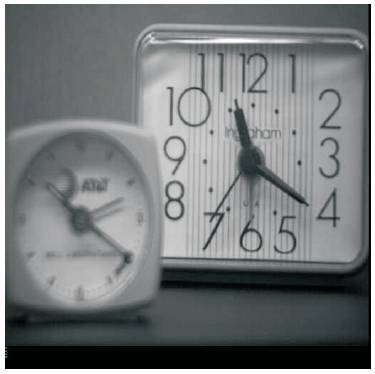
The diagrammatic representation of the fusion process is given in the Figure 1. The images, which are partly focused and partly de-focused were used as an input to the fusion process.
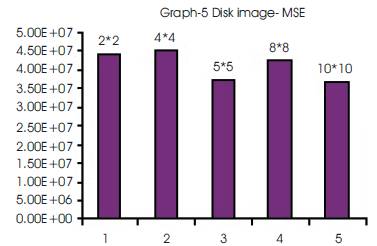
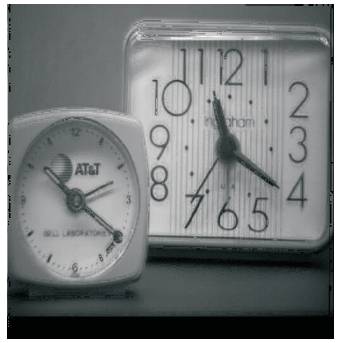
The source images are divided into sub-blocks of equal sizes and variance is calculated for each sub-block of the source images. The variance of the corresponding subblocks is compared and the one with higher value is used to form the resultant image. The fused results were evaluated with a spatial frequency (SF) [1, 5] and mean square error(MSE) [5]. The spatial frequency measures the activity level in an image and it generally increases with increase in image clarity. The mean square error is zero, if the reference image and constructed image are equal.
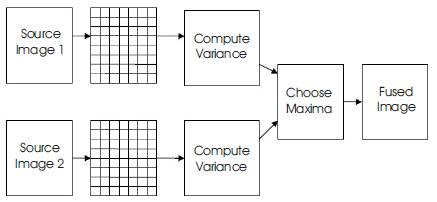
Figure 1. Fusion process using variance
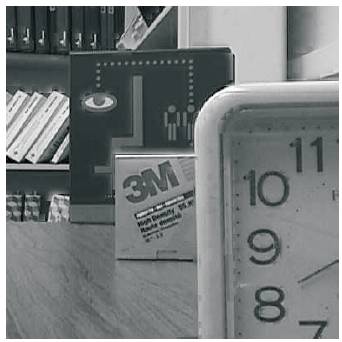
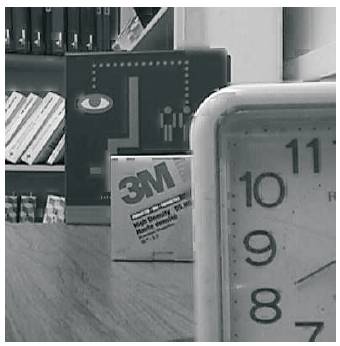
The experiments were conducted on four set of images each of which is partly focused and partly defocused. The input source left and right focus images were given in the Figure 2(a) & (b),4(a) & (b),6(a) & (b) and 8(a) & (b). The fused results using the various block sizes were given in Figure 3 (a) through (e), Figure 5(a) through (e), Figure 7(a) through (e) and Figure 9 (a) through (e). The Tables 1,2,3 and 4 shows the Spatial Frequency (SF) values and the Mean Square Error(MSE) values of the fused results with various block sizes. The graph-1(a)&(b),2(a)&(b),3(a)&(b) and 4(a)&(b) reveals the change of those values with different equal sub-block sizes of the source images.
From the Figure 3, Table 1 and the graph-1(a)&(b) it is clear that the fused result obtained from choosing 4*4 and 5*5 as a sub block size in the source images is found to be visually better than the other images. But the quantitative analysis shows that the subblock size of 2*2 has the higher Spatial Frequency (SF) value and the sub-block size of 5*5 and 10*10 shows the minimum MSE value. Here the fused result obtained with the sub-block size of 5*5 can be considered as a better image because of its minimum MSE value and the average spatial frequency.
(a) Left focus
(b) Bight focus
Figure 2. Source images Enlarged
(a) 2*2
(b)4*4
( c ) 5*5
(d) 8*8
(e)10*10
Figure 3. Disk
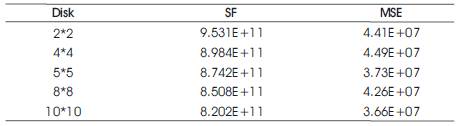
Table1. Disk SF and MSE Values
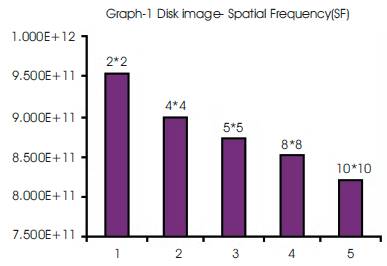
Graph 1(a). SF Values
(b). MSE Values
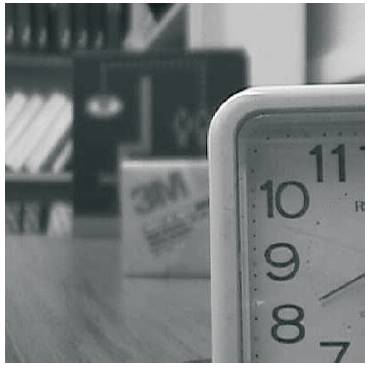
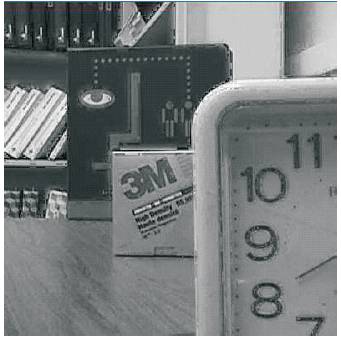
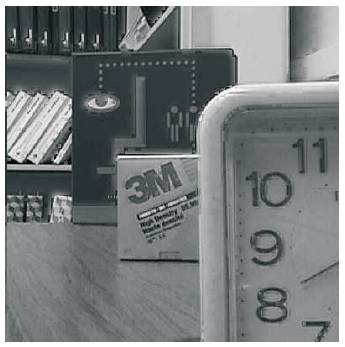
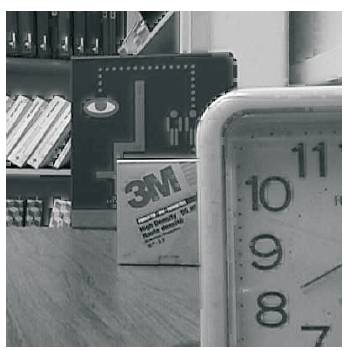
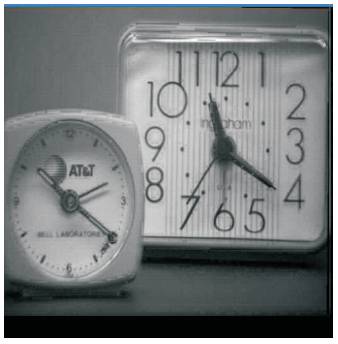
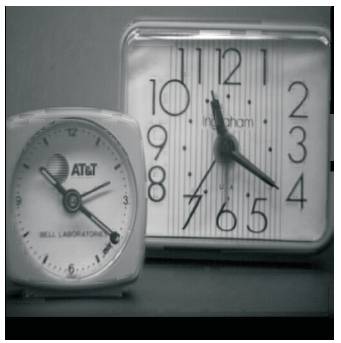
(a) Left Focus
(b) Right Focus
Figure 4. Source images Enlarged
(a) 2*2
(b)4*4
( c) 8*8
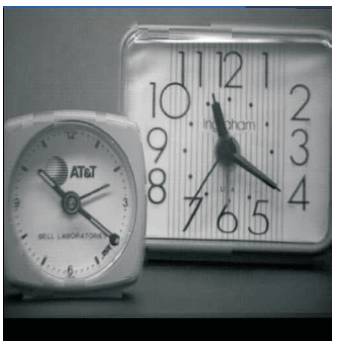
(d)16*16
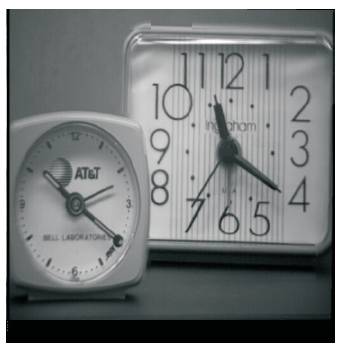
(e) 32*32
Figure 5. Clock
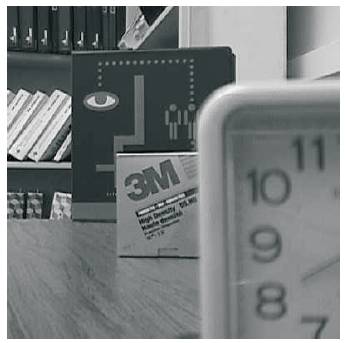
From the Figure 5, Table 2 and the graph 2, the fused result is quantitatively better in the fusion process, which uses 2*2 as a sub-block size. In this Spatial frequency (SF) value is high and the MSE value is also found to be minimum.
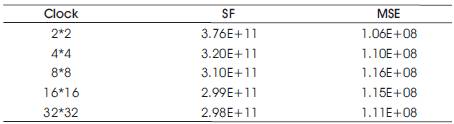
Table 2. Clock SF and MSE values
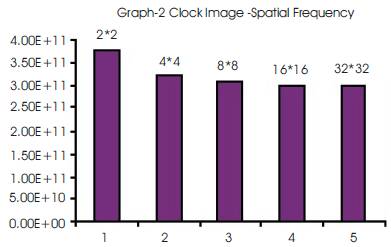
Graph 2(a). SF Values
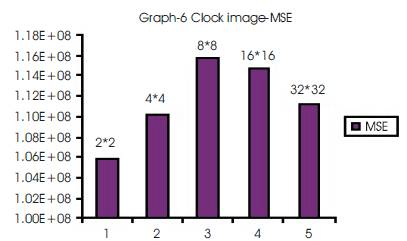
(b). MSE Values
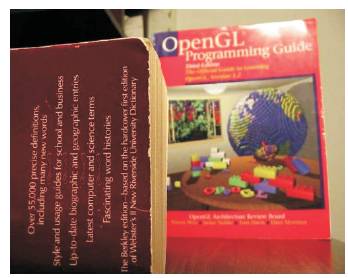
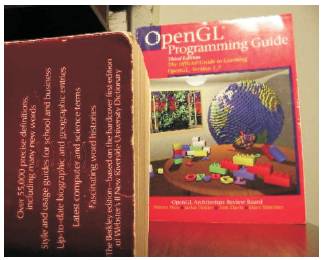
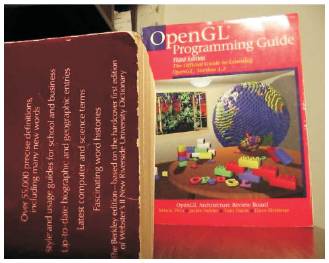
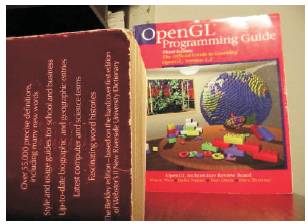
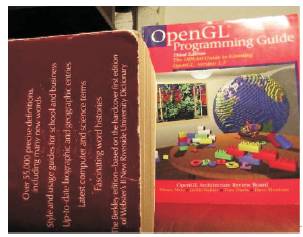
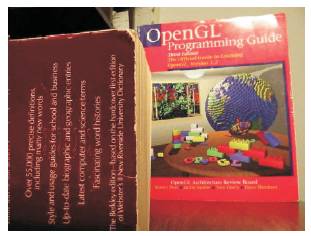
(a) Left focus
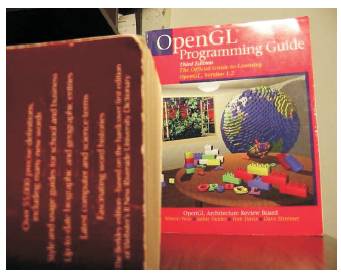
(b) Right focus
Figure 6. Source images Enlarged
(a) 2*2
(b) 3*3
(c ) 4*4
(d) 5*5
(e) 6*6
Figure 7. Book
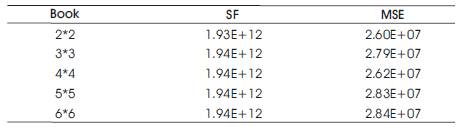
Table 3. Book SF and MSE values
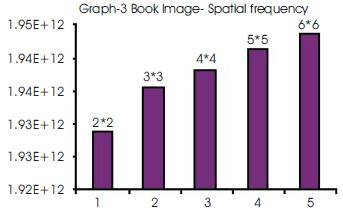
Graph 3(a). SF Values
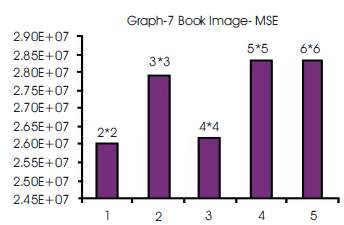
(b). MSE Values
From the Figure 7, Table 3 and the graph 3, the constructed image with the subblock size of 4*4 can be considered, because of its minimum MSE value and the average SF value.
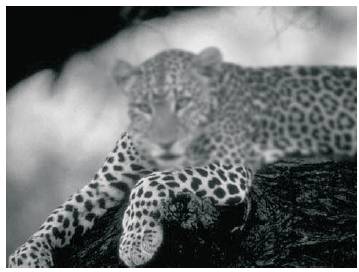
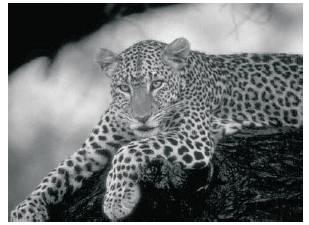
(a) Left focus
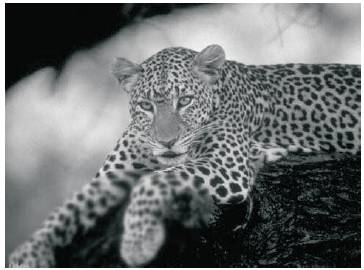
(b) Right focus
Figure 8. Source images Enlarged
(a) 2*2
(b) 3*3
( c) 4*4
(d) 5*5
(e) 6*6
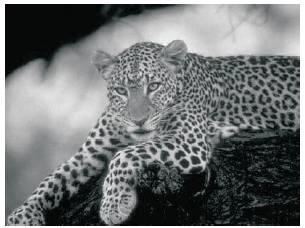
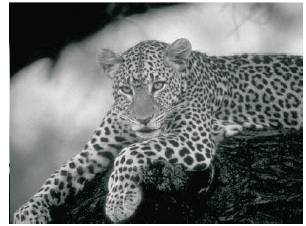
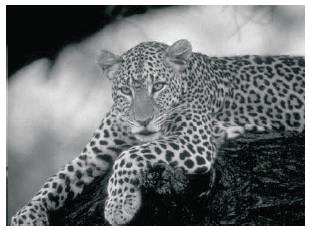
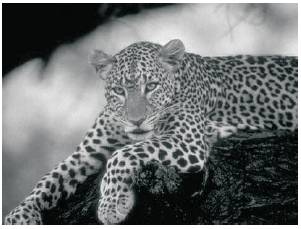
Figure 9. Leopard
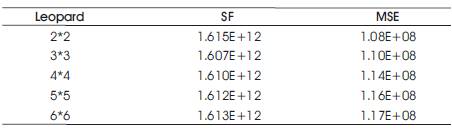
Table 4. Leopard SF and MSE values
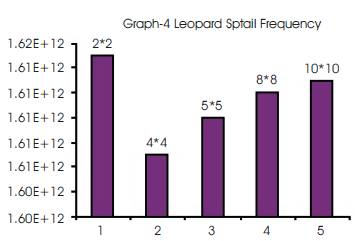
Graph 4(a). SF Values
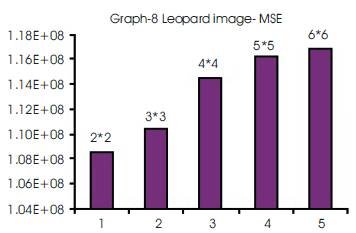
(b). MSE Values
From the Figure 9, Table 4 and the graph 4, it is observed that the fused result with the sub-block size of 2*2 has higher Spatial Frequency (SF) value and lower MSE value. So this is found to be the better fused result than the other images qualitatively and quantitatively.
In this paper, the fusion process is performed with a variance as a focus measure to estimate the depth information in defocused images for equal sub- block sizes in the images. The effect of block size in the fusion performance has been studied. It is observed that an optimal block size has to be chosen based on the subjective and objective analysis. It is also found that if the block size increases the quality of the image decreases. In estimating the fusion performance the objective measures guides in decision making. The fusion process can also be done with different sub block sizes and analyzed.