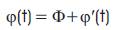
Reynolds Averaged Navier Stokes (RANS) equations are derived from general Navier Stokes Equations along with the statistical assumption above. Hence;
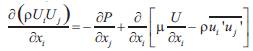
where as μ is the dynamic viscosity and ρ is the fluid density and assumed as a constant while fluctuations of fluid density insignificantly shows up and possesses unimportant effects on the flow up to around Mach number 3-5 [7]. Since in this particular case of the research, as investigating subsonic flow over a car, i.e. much smaller than Mach number 1, the density does not importantly fluctuate, thus indeed the fluctuation is assumed as zero and the density as a constant. The correlation between the density and both velocity fluctuation components is named as Reynolds stress and is non-zero while two fluctuations of the velocity components are statistically dependent on one another. Therefore Reynolds stress term is an additional unknown and needs to be solved to obtain the resolution of the RANS equations. Boussinesq's assumption is suggested to relate the Reynolds stress to constant turbulent viscosity by the following equation,
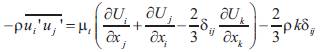
Where k represents the kinetic energy per unit mass and the equation below defines k as the half of the production from the correlation between two velocity fluctuation components,

The mean flow features along with the effects of turbulent fluctuations averaged out the turbulence through Reynolds stress  . The various models have been developed regarding turbulent flows employing RANS in the range from the one-equation turbulent models to Reynolds-stress model. RANS models enable users to obtain sufficiently promising resolution rapidly and do not require too much power consuming process. Therefore RANS equation is chosen for this particular inverted rearwing project and the methods are further discussed in the later sections.
2.2 Two-Equation Turbulence Models
In order to include the effects from history of flow and to predict wake length, two transport equations are derived from Navier-Stokes equation. If two transport equations are included in the model, it is called two-equation turbulence model and many kinds of two-equation turbulence models have been proposed over the past a few decades and one of them shall be present in this section.
2.2.1 k- ε Two-Equation Turbulence Model
The models need to be adjusted at different levels of flow such as from wall-bounded to free-shear flows, i.e. flow over a trailing edge of an airfoil [8]; Therefore, the more accommodating model to various kinds of flows is, the more universal model is, particularly in this research, for separated flows over an airfoil, transport effects on the turbulence length scale shall be taken into account. Two equation turbulence models are generally based upon Bousiness q approximation [8].
The second order accurate upwinding discretization scheme and SIMPLE algorithm are chosen to approach the solution.
The turbulent kinetic equation in Cartesian coordinates for two dimensional flowfields is as the following;
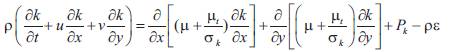
where,
Pk is the production of turbulence and 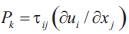 .
.
The dissipation rate equation in Cartesian coordinates in two dimension is;
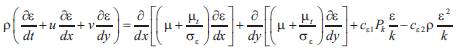
where,
the constants are σk =1.0 σε=1.3 σε1 =1.44 σε2 =1.92 and μt is the turbulent viscosity and 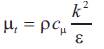 in relation with ε and with cµ =0.09[9].
3. Geometric features of the airfoils and computational domains and flow properties
The airfoils utilized in this study are NACA 2414 cambered (asymmetric) and NACA0015 asymmetric airfoils and the point data files identifying the shape of the airfoils are obtained from UIUC Airfoils Coordinates Database at the web page link http://www.ae.uiuc.edu/m- selig/ads/coord_database.html. The chord of the both airfoils c is 1000 mm and the angle of attack determined is 0,4,8,12, and 16 deg as the features of the airfoils are indicated in Figure 1. The origin of the Cartesian coordinate system is located right in the most front point of the leading edge of the airfoil. The structured mesh of boundary layer region and the unstructured mesh are also demonstrated in the Figure 1.
The Reynolds number based on chord length is determined 2.01x10⁶ along with the baseline freestream velocity of 30 m/s in both cambered and symmetric cases.
In Figure 2, the x, y coordinate of the computational domain corners are given corresponding to the values given by Kieffer et-al.
A velocity inlet boundary condition for the upstream boundary and an outlet vent boundary condition for the downstream boundary are set at a uniform velocity profile of 30 m/s for the baseline simulation and the gauge pressure is set zero and slip boundary condition is imposed.
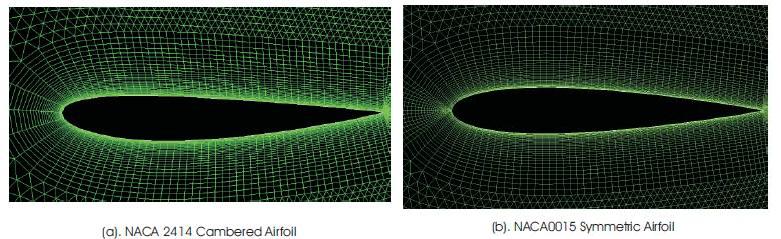
Figure 1. Geometry of the Airfoils (a). NACA 2414 Cambered Airfoil (b). NACA0015 Symmetric Airfoil
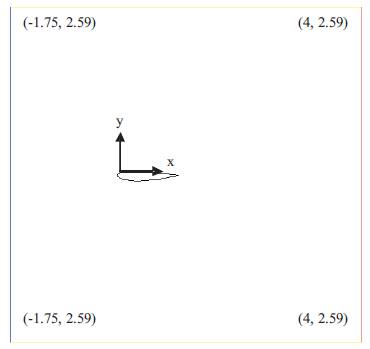
Figure 2. Geometry of the Computational Domain for NACA0015 correspond the Values from [13].
4. Validation of the Computational Process
As a preliminary study the Spallart-Allmaras method had been utilized, it can be said that the Spallart-Allmaras oneequation turbulence model can be employed to capture only the major changes in the surface pressure features along the surfaces of the symmetric airfoils. The cambered airfoil possesses enough complexity in terms of its feature for the turbulence model employed not to be used to capture sharp pressure diversity such as stagnation pressure on the leading edge and the suction peak along the suction surface (lower one in the inverted case). Consequently it was decided to use the k-ε turbulence model as a two-equation turbulence model since the two equation model provides more accurate results in comparison to the one-equation model, Spallart-Allmaras model.
The validation process has also been carried out via the realization of a simulation of the symmetric airfoil at zero angle of attack.
The Figure 3 of pressure coefficient plots obtained from the simulation of the airflow over NACA0015 symmetric airfoil can be used as well as the velocity magnitude plots to verify the computational method utilized. The distribution of the value points of the pressure coefficients on both the upper edge and lower edge should be conflicting with fully agreement along the chord length due to the symmetry of the airfoil and the absence of an angle of attack. Since the two curves are in very close agreement with only negligible fluctuations in the region nearby the leading edge and with even more little ones in the vicinity of the trailing edge, one can conclude that the turbulence method, the scheme, and the algorithm chosen provided proper and applicable results from which more conclusions can be drawn. The similar observation can be carried out on the plot which depicts the velocity magnitude distribution of the same symmetric airfoil at zero angle of attack.
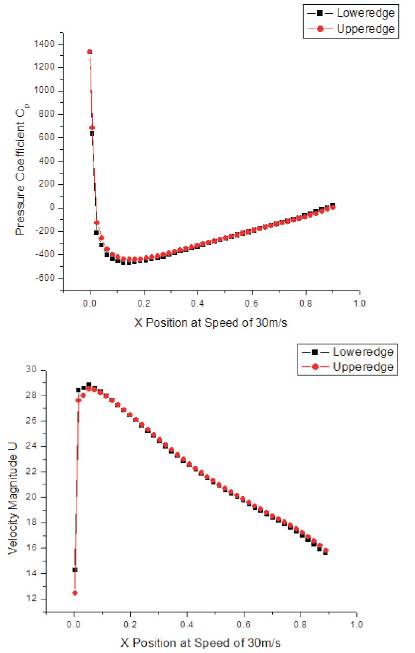
Figure 3. Pressure Coefficient and Velocity Magnitude plots of NACA0015 at AOA=0.
5. Results and Discussion
A qualitative evaluation of the comparison of two airfoils was conducted to have better understanding of whether a contribution exists via the cambered airfoil to desired pressure distribution. The most outstanding contribution might happen in the vicinity of the trailing edges since significant flow phenomena such as separations, transition to turbulence starts to form about the trailing edge and wake is also generated in the downstream domain led by the trailing edge. Moreover, since some significant airflow phenomenon also occurs about the leading edge such as suction peak and stagnation pressure. Suction peak was defined as the value of maxium suction along the lower surface of the inverted airfoil in [9] by Mahon et-al. Stagnation pressure may be defined as a static pressure at stagnation point that is in the front of the leading edge where the local velocity of the flow is zero thus the static pressure has its maximum magnitude. Suction peak and subsequently stabilized surface pressure along the suction surface of the NACA 0015 symmetric airfoil was captured as -1042 by the turbulence model approximately at x/c of 0.027 as can be seen in Figure 3. Suction peak value of Cp of the cambered airfoil was larger than that of the symmetric airfoil and appears at further location in x direction over which the distribution of Cp smears away. A pressure gradient on the suction surface of the NACA 0015 is in the inclination form in the downstream of the leading edge whereas the pressure increase is more likely linear along the suction surface of the NACA 2414 airfoil.
The distributions of the values of the pressure coefficients of the two airfoils appear to be in close agreement along the pressure (upper) surface. They appear at the largest values and begin sharply decreasing up to zero of Cps at the stagnation point however the pressure declination of that of the cambered airfoil is sharper. One can realize that there exists only a slight difference, as decreasing, between the Cp distributions of NACA 0015 and NACA 2414. However, on the suction surfaces, a large discrepancy occurs. The large variety on the Cp distribution along the suction surface draws attention and a contribution of the cambered airfoil in terms of higher magnitude of downforce (inverse lift) and more stability can be presumed through this diversity. Therefore, the pressure difference between the upper and lower surfaces of the symmetric airfoil is significantly less in comparison to that of the cambered airfoil (Figure 4). Consequently, it is evident such that the cambered airfoil causes more downforce than the symmetric one in the same angle of attack of 4 degree as might be desired for the stability concern of the car.
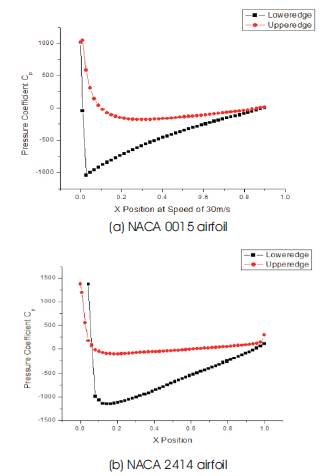
Figure 4. Distribution of Pressure coefficient versus position along the lower and upper surfaces of (a) and (b) at AOA =4 degree
Pressure gradient with respect to X position along the chord length of NACA0015 at angle of attack of 4, on Figure 5, reaches the smallest value between 0.2-0.3 on the upper edge at the speed of 50m/s. In the same interval of X position along the length, the discrepancies also appear where the pressure value decreases as the airflow accelerates. The pressure values at all speeds of airflow happen to meet about Cp of zero at X position of 0.85 on both lower and upper edges where the turbulence flow starts to be generated. The reverse pressure gradient phenomenon is also to start at the same time, which forces the velocity magnitude to dramatically decrease. This phenomenon can also be observed on the plot which demonstrates the velocity magnitude along the upper edge of the same symmetric airfoil. The decrease in velocity and reversed pressure result in separation and the boundary layer around the trailing edge turns into wake generated right behind the trailing edge. The thickness of the generated wake became larger as the airfoils were set at the higher angle of attacks. The more speed the airflows over the both airfoils have, the lower surface pressure exists along the suction edge until the region nearby the trailing edge. The pressure values at different speeds match up about zero pressure in the vicinity of the trailing edge of the both airfoils. The negative pressure values on the suction surface avail the airfoil to fulfill the generation of the downforce that will be used for more stability when the car speeds up. When one who takes a look at the Figure 6(b) could easily understand that the pressure values are even more lowering down to ≈ -2500 Pa on the plot which belongs to the cambered airfoil, NACA2414 when the car speeds up to 50 m/s so then this also shows that the cambered airfoils enable an aerodynamicist designer to obtain higher downforce mounting a cambered rearwing behind the car.
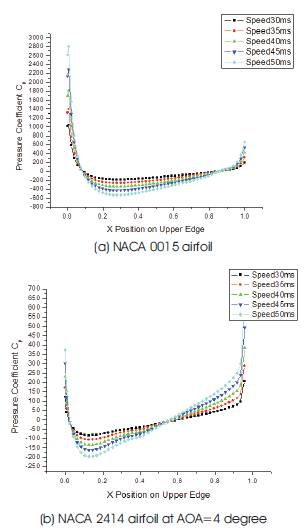
Figure 5. Distribution of Pressure coefficient versus position along the upper surfaces of (a) and (b) at AOA =4 degree
The analysis of velocity magnitude was assessed by the simulation over the both airfoils as well. As already mentioned on the discussion of the pressure diversity, the velocity magnitude of the flow over the airfoils also varies as seen on Figure 7. As always referred to Bernoulli equation while explaining the relationship between pressure and velocity, also herein, the diversity in velocity can be explained through the same relationship concluding the change in velocity magnitude along the upper and lower edges are strongly related to the corresponding pressure change. Figure 7(a) highlights the concept illustrating that the velocity increases on the pressure surface while the velocity on the suction surface decreases up to the x position of 0.1 so that the largest discrepancy appears in the upstream gradually shrinks along the leading edge of the symmetric airfoil down to the x position of 0.2. The velocity magnitude at that point was captured as 26 m/s. Downforce was, as postulated, generated by the difference in pressure, hence, indirectly by the difference in velocity i.e. the lower velocity along the pressure side and the higher velocity along the suction side there exist, the higher downforce can be generated. Therefore, the downforce was evaluated at its highest value at the most front of the leading edge and decreases down to zero and since the difference in velocity increases along the chord length as depicted on Figure 7(a), the downforce also increases upto the trailing edge.
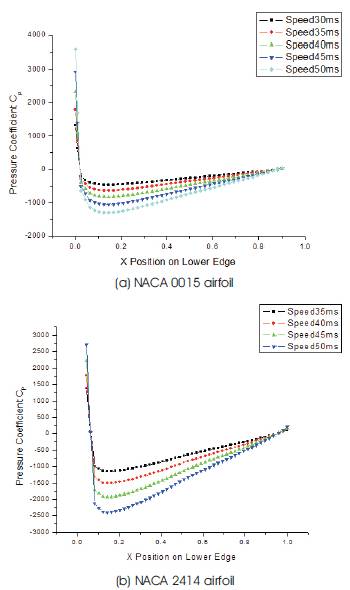
Figure 6. Distribution of Pressure coefficient versus position along the suction surfaces of (a) and (b) at AOA =4 degree
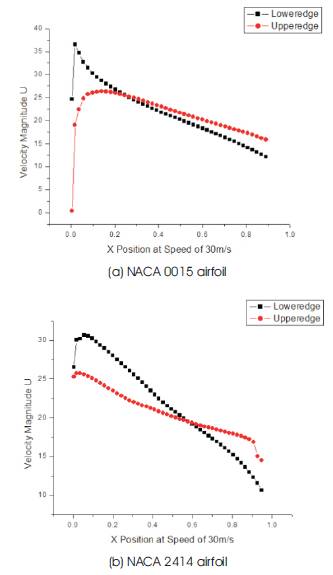
Figure 7. Distribution of velocity magnitude versus position along the lower and upper surfaces of (a) and (b) at AOA =4 degree
The feature of NACA0015 is more curved on the leading edge in comparison to that of NACA2414; therefore the velocity of the airflow over NACA0015 is higher than the velocity of the airflow over NACA2414, especially on the leading edge. However, the discrepancy between the pressure and the suction surfaces of the cambered airfoil is larger in comparison to that of the symmetric airfoil. As it can be concluded that the downforce generated along the chord length of NACA2414 is higher, in most of the region, with comparing to the downforce magnitude along the NACA0015. For instance, the inverse lift (downforce) coefficient was assessed on the points in the vicinity of the trailing edges of both airfoils. The data regarding downforce and drag coefficients are on Table 1. Since the discrepancy became larger due to the camber; as a result, the cambered airfoils contribute better to the stability due to the generation of the higher downforce.
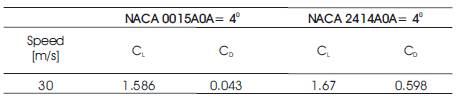
Table 1. The data Regarding Drag and Inverse Lift Coefficient of both Airfoils with an Angle of Attack of 4° at the Speed of 30 m/s
The camber also causes, as can be obviously seen on the table, higher drag coefficient which is not the desire of a designer since it results in lower performance due to the resistance against the airflow in road conditions. The higher drag may also be a cause of more gasoline consumption. This increase in drag coefficient should also be taken into account with the sustainability concerns in design concept and one might consider the optimization with respect to drag and inverse lift coefficients.
As discussed earlier, the distribution of the velocity magnitude which can be seen on the Figure 8 is symmetric on the both upper and lower edges of NACA0015 at angle of attack of zero so that there exists no downforce along the chord length. At the most front point of the leading edge in this zero AOA and symmetric airfoil case, the stagnation pressure point where the velocity magnitude is zero can be obviously realized.
The symmetry in the distribution of the velocity magnitude disappeared when the AOA was switched to 4 degree. The stagnation point on the leading edge slid upright as the wake thickness in the downstream led by the trailing edge was enlarged. The improvement of the wake thickness is evidence that the separation which is still nearby the trailing edge occurred earlier i.e. turbulence flow was generated earlier as compared to the airfoil in the lower angle of attack. The velocity magnitudes are in very low levels around the stagnation point on the leading edge and in the wake generated in the downstream domain. Beside that, the velocity values remained at the highest level, as expected, about the most curved region of the lower edge. The angle of attacks of the higher values than 8 degree resulted in the distribution of velocity beyond the desires such as lift force instead of downforce. The AOA up to 8 degree caused the generation of downforce since the velocity distribution over the upper and lower edges differed from one side to another. The separation started in the closer region to the leading edge as the airfoil was set at over 8 degree and the airflow over the lower edge kept decelerating in the bigger zone due to the growth of the wake in terms of length and thickness. This phenomenon arisen by increase of AOA over 8 degree may result in lift force instead of downforce as can be observed in Figure 9. The same incidence that was called stall condition by Kieffer et-al in [10] might be observed on the demonstration of the cambered airfoil set at the corresponding angles of attack. The same conclusion could be drawn regarding the cambered airfoil since fundamentals of the incidences occurring in both cases should be the same even though the location or the sizes of the wake and velocity distribution might be slightly different.
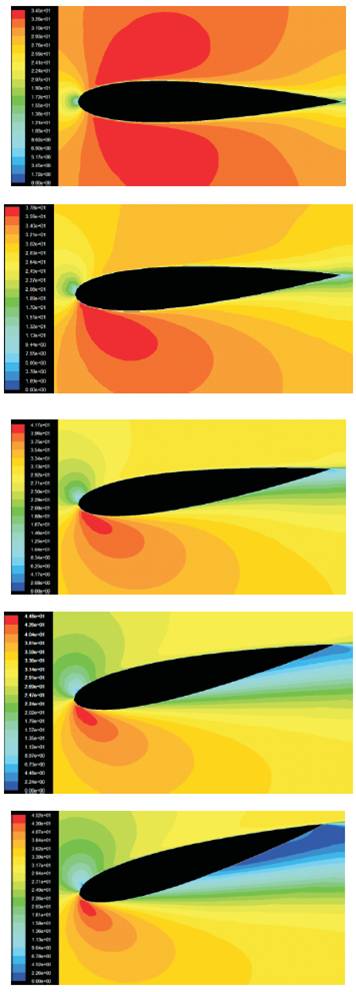
Figure 8. The Distribution of the Velocity Magnitude of the Airflow at different Angle of Attacks
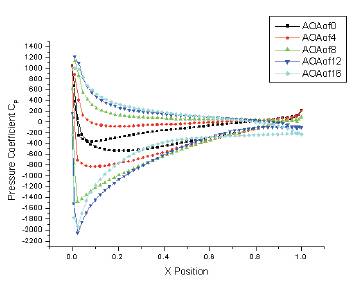
Figure 9. The Distribution of the Pressure Coefficient along the Airfoil NACA2414 at different Angle of Attacks
Conclusion
The symmetric airfoil NACA0015 and NACA2414 are simulated at different speeds and at different angles of attack through the commercial airflow simulation software Fluent. The velocity and pressure distributions were obtained and plugged in the plots shown comparing the differences regarding the cambered feature and the symmetric feature of two types of the airfoils. Consequently, first of all, the downforce generated along the chord length of NACA2414 was higher, in most of the region, with comparing to the downforce magnitude along the NACA0015. Second of all, since the discrepancy became larger due to the camber the cambered airfoils contribute better to the stability of the overall car due to the generation of the higher downforce which will affect the rear axis of the car and make the cornering and speeding under better control.
The incidence of stall condition was explained via the contour plots that depict velocity magnitude distribution. This phenomenon arisen from the increase of the angles of attack of 8 and over 8 degree may result in lift force instead of downforce. The same conclusion could be drawn regarding the cambered air foil since fundamentals of the incidences occurring in both cases should be the same. The camber also causes higher drag coefficient which is not the desire of a designer since it results in lower performance due to the resistance against the airflow in road conditions. The higher drag may also result in more gasoline consumption. This increase in drag coefficient should also be taken into account with the sustainability concerns in design concept and one might consider the optimization with respect to drag and inverse lift coefficients as a future work.