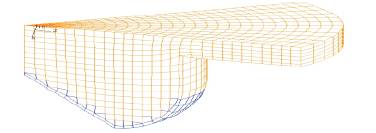
Figure1. Computational Sector Mesh used in the engine simulation at TDC
In direct injection (DI) diesel engines the fuel spray characteristics have high influence on engine performance as well as exhaust gas emissions. The fuel spray orientation plays very important role in fuel air mixing. A single cylinder four stroke DI diesel engine with fuel injector having multi-hole nozzle injector is considered for the analysis and a computational fluid dynamics (CFD) code, STAR-CD is used for the simulation. In the present study, various fuel spray orientations are considered for the analysis. It is shown that there is an optimal orientation for the fuel spray and the wall wetting area influences on the emission formations. Results are reported for distribution of fuel spray for different spray orientations and discussions are made with the profiles of pressure, temperature, number of droplet parcels, turbulent kinetic energy (TKE)., and exhaust gas emissions.
It is well known that the optimization of Diesel engine operating parameters is critical for engine manufactures to meet the output performance as well as upcoming emissions mandates. Major diesel engine problem is achieving sufficiently rapid fuel-air mixing rates to complete the fuel-burning process [6,7,8,9] in the appropriate time. With the current status of central processing unit speed and model development, multidimensional engine simulations have become an important and useful tool to aid researchers and designers in the understanding of the complex in-cylinder processes [1,2,3,4,5]. With stringent emission regulations on diesel engine, understanding the fuel spray penetration and its behavior [10,11,12,13] and combustion process [14] in a Diesel engine has become more imperative. Many engine parameters affect the combustion process. The fuel injection and mixing of the fuel and air influence the combustion process and effect the pollutant formation and engine performance.
The purpose of this paper is to predict the spray penetration and fuel air mixing in a DI diesel engine with various injection orientations. Commercial CFD code STAR-CD is used, which is based on the finite volume approach. STAR-CD contains built-in capabilities for modeling the behavior of special-purpose atomizers for internal combustion engines. The injection process being modeled includes the flow in the nozzle hole and atomization. The latter gives rise to a fuel droplet spray represented by a set of computational parcels, each containing a number of droplets with the same properties. These properties are calculated on the basis of various atomization models. The histories of the computational parcels are obtained from the Lagrangian conservation equations of mass, momentum and energy in the normal way.
In the present work, 45o sector is taken for the analysis due to the symmetry of eight-hole injector in the model. The computational mesh when the piston is at Top Dead Center (TDC) is shown in Figure1. The computational domain comprises of the combustion chamber with piston crown. The number of cells in the computational domain at TDC is 10608. Piston bowl dimensions are given in Figure 2. Engine details are given in Table 1 and fuel and injection details are given in Table2.
Figure1. Computational Sector Mesh used in the engine simulation at TDC
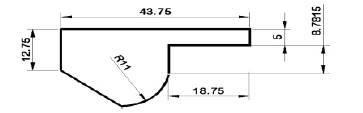
Figure 2. Geometric dimensions of Piston Bowl
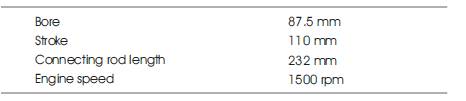
Table 1. Engine Specifications
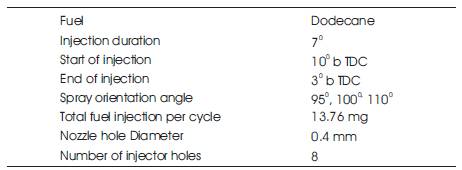
Table 2. Injection Parameters
It is important to study the in-cylinder fluid dynamics during the later part of combustion and initial part of expansion strokes in DI diesel engines. Analysis is carried out from 40o before TDC (bTDC) to 80o after TDC (aTDC), as fuel injection combustion and pollutant formations are taken place during this period.
The initial swirl is taken as 2m/s and the constant absolute pressure and temperatures as 9.87 bar, 583 K respectively. The turbulent model has the Intensity-Length scale as 0.1 and 0.001 respectively and it shows no traces of fuel and exhaust gases. The initial surface temperatures of combustion dome region and piston crown regions are taken as 450 K and the cylinder wall region has temperature of 400 K.
Optimizing the spray orientation angle is one of the key parameter in the multi-point fuel injectors for the fuel air mixing in DI diesel engine fuel engine system. It influences the combustion process inturn engine performance as well as exhaust gas emissions.
The fuel injection parameters as listed in Table.1 are considered for the analysis. Different spray orientation 0 0 0 angles considered are 95o , 100o and 110o . As part of analysis, 3-D plots of fuel spray distribution at 4o bTDC (6o after fuel injection starts) is presented in Figure 3 and it is difficult to present all the information hence, it is selected that at this crank angle position fuel injection orientation, spreading and distribution are found to be clear.
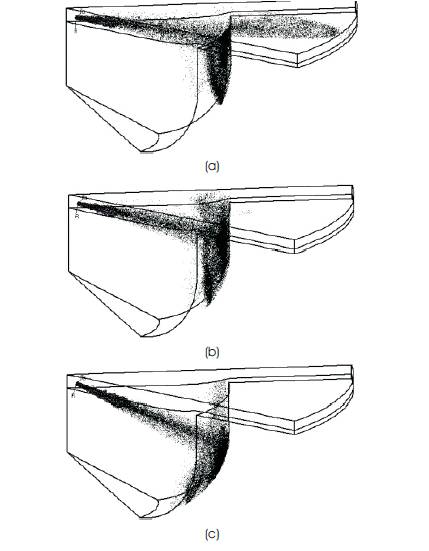
Figure 3. Fuel Spray Distributions in Combustion Chamber at 2o aTDC with Injection Orientation Angles of (a) 95o , (b)100o , (c)110o
At the initial stages of fuel injection the in-cylinder fluid velocities does not seem to effect the spray penetration. At almost 4o after the fuel injection the jet is to be strikes the bowl surface. Later it spreads along the bowl surface and gets diverted to the other parts of the bowl simultaneously gets evaporated. It is observed that the spread of fuel droplets is more in case of 100o spray orientation than the other two cases. It is also observed that in case of 950 orientation the wetting area is increased due to the spray spreading into the squish region. For further insight into the fuel spray evaporations, it is essential to study by way of number of droplet parcels that are present vs. crank angle.
It is observed that similar trends of sharp increase in the profiles of number of droplet parcels are noticed from 0 beginning of the fuel injection to 4o CA after start of fuel injection i.e. the fuel spray breakup distance. Later the fuel stream breaks into the fine particles of the fuel spray. This is due to that a stream of fuel emerges from the nozzle hole encounters aerodynamic resistance from the dense air present in the combustion chamber and breaks into a spray. The numbers of droplet parcels in the combustion chamber are found to be at this stage around 27,000 in all the three cases.
Figure 4 shows 7o bTDC onwards the number of droplet parcels remain constant in case of 100o orientation for the next 4o CA (up to 3o bTDC). It is to be noted that the fuel injection is in progress during this period. The constant number of fuel parcels means that the rate of liquid fuel droplets entering is equal to the rate of fuel droplets evaporated. At the same time (7o bTDC to 3o bTDC) the number of droplet parcels is increasing in case of 95o orientation. This indicates that the rate of evaporation is lower than the rate of fuel entering in to the combustion chamber. In case of 110o orientation the number of droplet parcels is appeared to be increasing after 7o bTDC. This is mainly due to the longer path taken by the fuel jet. The number of droplet parcels at this stage are 32261, 26697, 31056 in 95o , 100o and 110o spray orientations respectively.
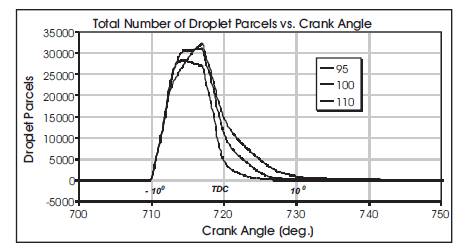
Figure 4. Comparison of Total Number of Droplet Parcels vs. Crank Angle Profiles for the Three Spray Orientations
From the above discussion it can be concluded that the fuel air mixing and fuel evaporation is better in case of 100o orientation as compared to the other two cases.
TKE is an important parameter in diesel engine combustion chambers fluid dynamics. The turbulence in the flow ensures rapid mixing of air and fuel because, the local fluctuations in the flow field results of molecular diffusion. The turbulent flows are always dissipative. The deformation work done on the fluid due to viscous shear stresses increases its internal energy at the expense of its TKE.
Figure 5 shows the variation of TKE with crank angle. A noticeable increase in the TKE is observed at 100 bTDC, indicating the start of fuel injection. From this point, within a very short variation of crank angle the TKE is increasing very sharply indicates high velocity fuel injection. The maximum value of TKE is noticed at the near end of fuel injection i.e. at 30 bTDC. The sudden rise in the TKE can be attributed to the high velocity fuel injection in to the combustion chamber. During the evaporation period the TKE shows a decreasing trend. Very sharp fall in TKE is noticed at the beginning of evaporation due to expense of in-cylinder energy (endothermic reaction) and there after a gradual fall is noticed after commencing of combustion. The peak highest TKE can be predicted with 1000 spray orientation. The peak TKE predicted is around 48m2 /s2 , 52m2 /s2 and 40m2 /s2 . At 724o aTDC a small fluctuation is noticed, which indicates a bulk of fuel combustion taken place.
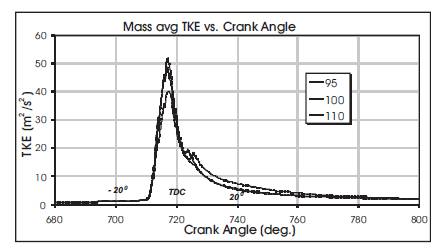
Figure 5. Comparison of TKE vs. Crank Angle Profiles for the Three Spray Orientations
Pressure data of the in-cylinder fluids can be used to calculate the work-transfer from the gas to the piston. Pressure vs. crank angle (P-) diagrams for the three spray orientations are presented in Figure 6. A smooth and gradual pressure rise due to compression is noticed from 400 bTDC to 100 bTDC. The rate of pressure rise is found to be decreasing at 100 bTDC. This can be attributed to the evaporation of injected fuel at the expense of the in cylinder fluid energy (endothermic reaction). This result in a slight drop in temperature and hence pressure.
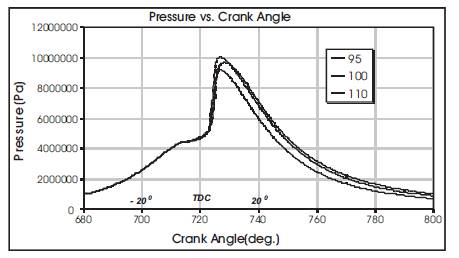
Figure 6. Comparison of Pressure vs. Crank Angle Profiles for the Three Spray Orientations
A sharp rise in pressures is noticed after TDC, due to the combustion. The predicted peak pressures are 9.7MPa, 10MPa and 9.15MPa for 95o , 100o and 110o spray orientations respectively. From the above observations it can be conclude that 100o spray orientation gives higher output performance than the other two cases.
In DI diesel engines the process of combustion is unsteady, heterogeneous and three-dimensional, because fuel is injected into the cylinder just at end of the compression stroke where high temperature, high pressure compressed air present. Figure 7 represents the comparison of mass-averaged temperature vs. crank angle profiles for the three spray orientations.
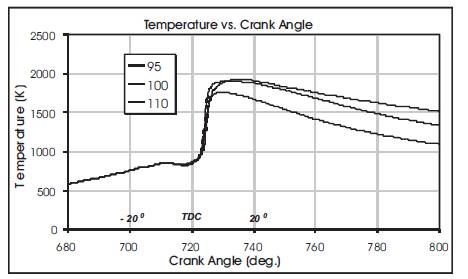
Figure 7. Comparison of Mass-averaged Temperature vs. Crank Angle Profiles for the Three Spray Orientations
It is observed that the mass-averaged temperatures rise gradually from 583K to 845K, till the start of fuel injection. This is mainly due to compression of in-cylinder fluids. Once fuel injection starts at 100 bTDC, a slight drop in temperatures is noticed till the end of injection i.e. up to 3o bTDC. This is due to the evaporation of fuel (endothermic reaction). A steep rise of mass-averaged temperatures is noticed after 2o aTDC. Which indicates the initiation of combustion.
The peak mass-averaged temperatures attained are observed to be around 1930K, 1911K and 1764K in cases of 95o , 100o and 110o spray orientations respectively. The values of peak mass-averaged temperature attained positions are relatively same in case of 100o and 110o spray orientations. Whereas in case of 95o spray orientation, a little delay in attaining of peak mass average temperatures by 2o crank angles than the other cases. It indicates the extended tail combustion phase.
Diesel engines generate undesirable emissions during the combustion process. The major causes of these emissions are non-stoichiometric combustion, dissociation of nitrogen and impurities in the fuel and air.
Formation of NO takes place during high temperature burned gases within and behind the flame through the chemical reactions involving nitrogen and oxygen atoms and molecules, which do not attain chemical equilibrium. Higher the combustion temperature the higher is the rate of NO formations.
Figure 8 presents mass of NO vs. crank angle for three spray orientations, it is noticed that NO formations are taking place in between 3o aTDC and 23o aTDC. This is mainly due to the maximum combustion generated temperature occurring during this period. A small drop in NO is noticed due to decomposition of NO where the required temperatures are available for decomposition. The NO formations after decomposing are noticed as 0.16mg, 0.19mg and 0.15mg in case of 95o , 100o and 110o spray orientations respectively. Highest NO predicted in case of 100o spray orientation, can be attributed the combustion generated temperature is higher due to better fuel air mixing intern better combustion has taken place.
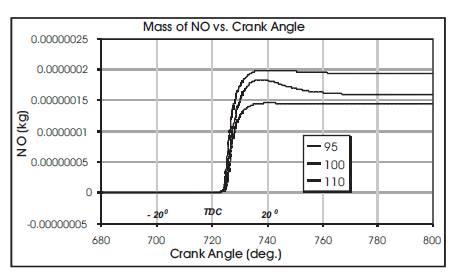
Figure 8. Comparison of Mass of NO vs. Crank Angle Profiles for the Three Spray Orientations
In the fuel rich zones, there is insufficient oxygen to burn all the carbon present in the fuel into CO2 during the combustion, resulting formation of CO. This is due to the heterogonous nature of diesel combustion.
From the Figure 9, sharp rise in CO formations are noticed within the short span i.e. from 2o aTDC to 8o aTDC as this is the period where combustion of fuel that has taken place. Later a gradual decrease in CO is noticed, this is due to oxidation of the existing CO by gradually mixing with other corners of oxygen and formation of CO2 will take place till favorable temperatures are available. In case of s 95o spray orientation the CO formation is higher than the two cases. This indicates the oxygen availability is insufficient to complete combustion at selected pockets during peak combustion. Beyond 80o aTDC, the effect of oxidation process is negligible. It is noticed that at 80o aTDC formation of CO are 0.08mg, 0.013mg and 0.008mg in case of 95o , 100o and 110o spray orientations respectively. In case of 95o CO is noticed higher than the other two cases because of more wetting area the squish region where lesser temperatures are prevailing (Figure.3.a).
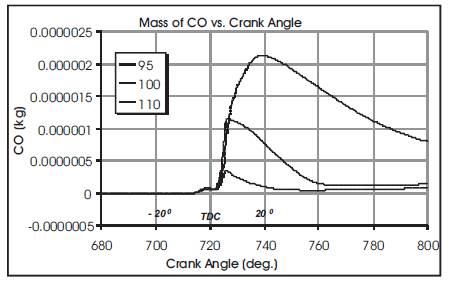
Figure 9. Comparison of Mass of CO vs. Crank Angle Profiles for the Three Spray Orientations
It is obvious that soot formation is a non-equilibrium combustion process, pyrolysis and thermal cracking of fuel molecule. At lower temperature, an aromatic hydrocarbon can produce soot via condensation of the aromatic rings into graphite like structure. These fragments that polymerize to form large unsaturated molecules that ultimately produce soot molecules.
Temperature, fuel composition and impingement of the spray on the hot surfaces have a pronounced effects. Soot inception is observed only when local temperature exceeds a critical value.
Figure10 gives comparison of mass of soot vs. crank angle for the three spray orientations, it is observed that soot formation is commences from 5o aTDC onwards because of combustion commences from 5o aTDC onwards. It is observed that at 80o aTDC the net soot formations are 0.03mg, 0.018mg and 0.01mg in case of 95o , 100o and 110o spray orientations respectively. In case of 95o orientation angle is noticed highest soot formations than the other two cases which is mainly attributed that the fuel wetting area is more in this case.
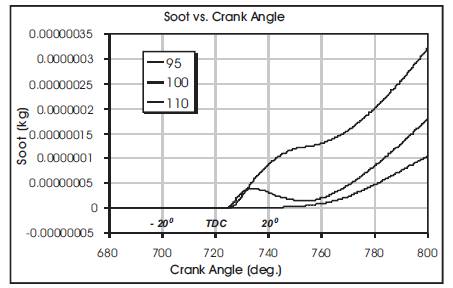
Figure 10. Comparison of Soot vs. Crank Angle Profiles for the Three Spray Orientations
It is noticed that the spray orientation angle is influencing the engine output performance as well as exhaust emission. It is noticed that fuel air mixing and fuel evaporation rates are better in case of 100o orientation angle and mass-averaged turbulence kinetic energies are higher in this case. It is also observed that in case of 100o orientation, the output performance is considerably higher and the exhaust emissions of CO and soot are reasonable, though the NO emission is little higher due to better combustion. It is observed that due the increase in surface wetting area, CO and soot emission formations in case of 95o spray orientation is increased. From this study it is concluded that the 100o spray orientation angle may perfectly be matched for this piston bowl configuration.