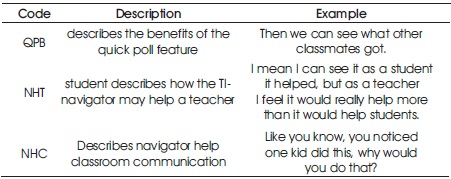
Table 1. Examples of Coding Units, Descriptions and Examples
Educational technologies can enhance both learning and teaching. Potential benefits of such technologies are documented in the literature. The use of educational technologies in teacher education classroom is highly recommended by educational researchers and national education associations. Teacher education programs can play a critical role in promoting pre-service teachers to effectively integrate technology into their future classrooms. In doing so, teacher education programs face obstacles; time is one crucial obstacle. During this mixed methods study, we interviewed two pre-service teacher groups who used a Student Response System for different instructional time lengths. Coded interview data were compared both qualitatively and quantitatively. Quantitative analysis revealed that there is no statistical difference between the two groups' ability in identifying the functionality of the system and its' benefits towards teaching and learning. Comparison of qualitative data between the two groups compliments quantitative analysis. Implications of the findings towards teacher education programs and future work are discussed.
The use of technology in mathematics classrooms in USA and around the world is on the rise. The National Survey of Science and Mathematics Education (NSSME) continues to support that availability of educational technologies (computers, calculators, Wi-Fi, etc.) in USA is increasing (Banilower et al., 2013; Banilower et al., 2018; Greenhow et al., 2009; Lim et al., 2010). The effects of such technologies, particularly Information and Communication Technology (ICT), on students' learning and factors that influence teachers' use of such technologies in teaching are investigated both qualitatively and quantitatively (Chen, 2010). Goals and standards are set by many of the national education associations to promote pre-ser vice teachers' appropriate use of technology to enhance students' understanding (Bell, 2001).
Student Response Systems (SRSs), which are a branch of ICTs, allow students and teachers to communicate in a networked classroom setting. Teachers often find it difficult to get students to answer classroom questions aloud (Duncan, 2006) due to lack of opportunity, socially related fear, or anxiety (Dickman, 1993; Reynolds & Nunn, 1997). However, students can answer classroom questions anonymously through SRSs. There is evidence to support increased student participation (Freeman et al., 2014; Hake, 1998; Pratton & Hales, 1986; Roschelle et al., 2004) and a higher level of mathematical learning when students use SRSs during their classroom activities (Bachman & Bachman, 2011; Bartsch & Murphy, 2011; Brown, 1972; Hegedus & Kaput, 2003; Lucas, 2009; Sinclair et al., 2008). Students also enjoy the classroom answering sessions when they use online polling and SRSs (Premadasa et al., 2016; Tremblay, 2010; Zullo et al., 2011). Pre-service teachers who have used a SRS during their classroom instruction also have positively described the role of SRSs in terms of students' learning, engagement, and classroom communication (Wijetunge & St.John, 2018). The NSSME (2012) reported that about 44% of high school mathematics classrooms have access to SRSs, but the reported level of teachers' use of SRSs for teaching purposes is very low. Despite the evidence of positive effects of SRSs on students' learning and classroom communication, why is their use very low in actual high school mathematics classrooms? Teachers' use of educational technologies and factors that can influence such use by teachers are documented in the literature. In the following section, we will discuss what answers we have for the above question and the development of the research question of this study.
In this section, we will discuss the factors that can influence teachers' use of technology in their classrooms and the role of teacher education programs in preparing future teachers to use educational technologies in their future classrooms. We will also discuss the barriers reported in the literature that teacher education programs face in educating pre-service teachers to effectively use educational technology and how this study can contribute in addressing some of those barriers.
Commonly reported reasons for in-service teachers' lack of technology integration in the classroom are inadequate professional development and training (Ertmer et al., 2012; Lowther et al., 2008; Morehead & LaBeau, 2005). Kafyulilo et al. (2016) reported that while in-service teachers were in agreement that they gained knowledge about technology and how to use it through professional development programs, only some of the participants continue to use such technologies in their classrooms. Studies have suggested that it can take three to five years for teachers to become comfortable in teaching with technology (Dwyer et al., 1991). It is also reported in the literature that the teachers with more experience can potentially have less favorable attitudes towards the use of technology (Blackwell et al., 2013). However, pre-service and beginning teachers' under-use of technology (Dawson, 2008; Kirschner & Selinger, 2003) and their feeling of inadequate preparedness to use ICT (Kay, 2006; Swain, 2006) were also reported. Therefore, providing opportunities for pre-service teachers to develop positive attitudes towards the use of technology can play a critical role. Thus, many educational researchers have investigated what factors can influence teachers to use or not use technology in their classrooms.
Pre-service teachers' attitudes towards ICT play a major role in them using such technologies in their future classrooms (Kavanoz et al., 2015; Kim et al., 2013; Reed et al., 2010; Teo & Milutinovic, 2015; Tondeur et al., 2018; Zogheib, 2014). Ease of use of the technology (Mayo et al., 2005; Tondeur et al., 2018) and pre-service teachers' self-efficacy of using technology (Chen, 2010; Scherer et al., 2015) are other contributing factors towards their future use of technology in teaching. Having more opportunities for pre-service teachers to use technology while they are learning can increase their competent to use such technologies in future teaching (Agyei &Voogt, 2011; Drent & Meelissen, 2008; Mayo et al., 2005; Tondeur et al., 2018).
Cox et al. (2000) describe that regular users of technology are more willing to use such technologies for educational purposes. This further strengthens the importance of incorporating technology in teacher education programs. In a review of the literature, Baubeng-Andoh (2012) reported that teachers' lack of confidence on ICT and lack of pedagogical training are commonly stated as obstacles by the teachers. It is clear that these obstacles are related to their attitudes and self-efficacy. Schrum (1999) suggested that pre-service teachers need to be exposed to various technological tools while they are learning, educated how to use such technologies in specific subject areas, and provided a technology-rich field environment. Thus, it is clear that teacher education programs can play a critical role in positively shaping preservice teachers' attitudes toward ICT and improving their confidence to use such technologies in their future classrooms.
As pre-service teachers' attitudes towards ICT play a critical and influential role in their future use of technology, teacher education programs can provide opportunities to positively shape their attitudes towards technology (Ferneding & Chen, 2003; Hammond et al., 2009; Mayo, et al., 2005). In fact, many studies have supported that it is very important for teachers to develop technologyrelated attitudes during teacher education programs (Ertmer, 1999; Niess, 2005). Developing pre-service teachers with meager ICT skills cannot adequately prepare them to use such technologies in the future (Kalonde & Mousa, 2016; Kirschner & Selinger, 2003) as studies report pre-service teachers have not been exposed enough to pedagogical use of ICT (Brown & Warschauer, 2006; Lim et al., 2010). Many researchers state the importance of integrating technology as well as pedagogical and content knowledge in properly preparing pre-service teachers (Koehler & Mishra, 2009; Thompson & Mishra, 2007).
It can be a challenging and complex process for teacher education programs to positively shape pre-service teachers' competencies to integrate technology in their future classrooms (Agyei & Voogt, 2014; Goktas et al., 2008). Many strategies have been suggested that incorporate technology into teacher education programs (Schrum, 1999; Tondeur et al., 2012) to promote pre-service teachers to successfully integrate technology in their future classrooms. Some of those strategies are the following: using various educational technologies in learning, showcasing pedagogical use within subject areas (Schrum), using teacher educators as role models, reflecting on educational technologies, learning how to use technology by design, collaborating with peers, scaffolding authentic technology experiences, and continuous feedback (Tondue et al.). Kalonde and Mousa (2015) identified that time can play a critical role for teacher education programs in planning to integrate technology in content and methods courses.
The above discussion provides strong evidence to support incorporating technology in teacher education programs so that it can positively shape pre-service teachers' attitudes towards the use of technology and time can play a critical role for both school teachers and teacher educators in incorporating technology in their classrooms. As time can play a crucial role in adopting various technologies and demonstrating their pedagogical use during a methods course, it is important to ask how much instructional time should be spent on a particular technology for pre-service teachers to gain a significant understanding of it and its potential use. The technology used in this study was the TI-Navigator system, which is an instructor-monitored wireless system for TI Nspire CAS calculators. To guide this study, we ask the question: is there a difference in identifying the potentials of a new technology between two groups of pre-service teachers who used the technology for different instructional lengths in time?
The participants of the study were pre-service teachers from a Midwest university in the USA. They were from two sections of a senior capstone course for secondary mathematics teachers that were taught by the same instructor. There were eight (out of 16 students) and seven (out of 15 students) participants from the fall and spring semesters respectively. Participants were recruited directly from the class by providing a brief introduction about the study at the beginning of the semester. They were compensated $10 gift card for their participation in both of the interviews. Participants' information was not shared with the teacher, as the teacher was one of the investigators of this study. All the interviews were transcribed verbatim and assigned code names, such as CGS1 and NGS1 to maintain the anonymity of the participants.
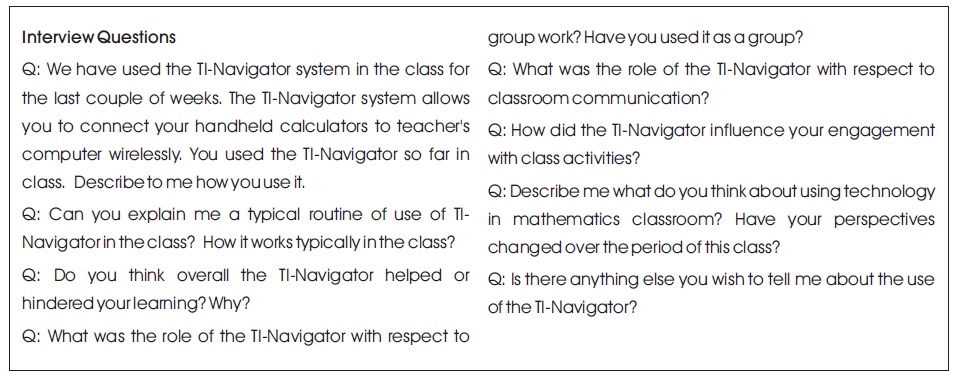
The Navigator Group (eight participants from the fall semester class) used the SRS for 14 weeks whereas the Calculator Group (seven participants from the spring semester class) used the same system for only three weeks towards the end of the semester. Participants were interviewed twice: once at the beginning of the semester before introducing the system and again at the end of the semester. The open-ended interview questions were designed to capture participants' perspectives on the use of the system, features of the system, and their possible use of such system in a future mathematics classroom. All the transcribed interviews were coded in order to identify the emerging themes. To assure the reliability of the coding process (Bogdan & Biklen, 2006), four randomly selected interviews were coded by two individuals independently, and the coding scheme was revised accordingly. Some examples of coding units, their descriptions, and examples of data are given in Table 1. After coding all the interviews by using the revised coding scheme, the individual coding units were categorized to identify emerging themes. Those themes were, Theme 1: the ability to describe the features of the technology, Theme 2: how the system helped their learning, and Theme 3: how the system would help teachers.
Table 1. Examples of Coding Units, Descriptions and Examples
As mentioned previously, the purpose of this study was to investigate if there is a difference in identifying the potentials of the SRS between the two groups. In other words, this study asks the question: does the duration of the use of a particular technology affect pre-service teachers' perspectives on the technology?
To answer this question statistically, qualitative data were quantified by using the frequencies of coding units under each identified theme (see Table 2). Below, the Table 3 summarizes the considered coding units for each of the themes. As the sample sizes were smaller, eight and seven participants in the Navigator group and Calculator group respectively, the Levene's test and the test of Normality Assumption were carried out. For both tests, the null hypotheses failed to be rejected as p>0.05. This implies that there was no difference in the population variances of the two groups and that the Normal Assumption holds for each group across all three themes. Thus, we utilized the independent samples t-test to compare differences between the two groups.
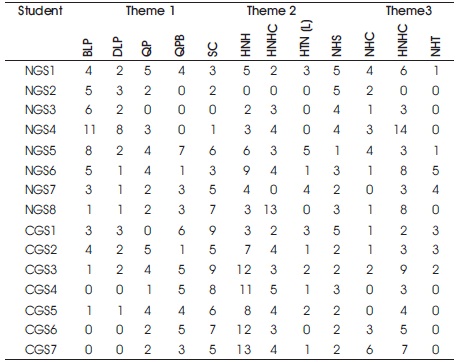
Table 2. Frequencies of Coding Units
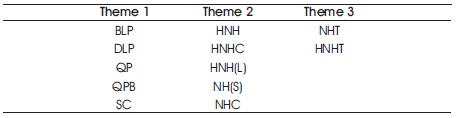
Table 3. Coding Units for Each Theme
The open-ended interview questions were able to capture pre-service teachers' perspectives on the use of technology in general and possible use of the technology in their future classrooms. Three themes, the ability to describe the features of technology, how the system helped their learning, and how the system would help teachers, were identified as relevant to the research question of this study. The independent samples t-test revealed that there is no difference of the mean values between the two groups across the themes (Table 4).
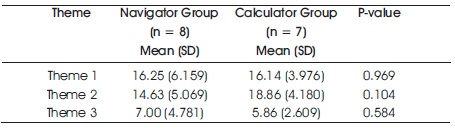
Table 4. Differences Between the Two Groups Across Themes
The participants in the study were able to describe the features Screen Capture (the teacher's computer displays each student's calculator screen), Quick Poll (students can receive questions from the teacher and submit answers to teacher's computer via calculator), Live Presenter (teacher can select a calculator screen and project it to the class), and File Transfer (teacher can send/receive calculator activities to/from students' calculators) of the student response system.
Screen Capture and Quick Poll were the two most described features of the system by the participants (see Table 2). All the participants except NGS3 described the Screen Capture at least once. Except the participant NGS3, all the other participants described the Quick Poll feature or its possible benefits. Three participants from the Calculator Group, CGS4, CGS6, and CGS7, never mentioned the Live Presenter feature while the rest of the participants described the feature or its benefits at least once (see Table 2). The participants described these features when they were describing how the system helped their learning, classroom communication, or how the system can help in teaching. Comparison of participants' responses between the two groups are given in the Table 5. Participants also described how the Live Presenter feature could help students to share their work with the whole class without going to the front of the class, which can be extremely uncomfortable for some students. In both groups, participants not only were able to describe the features of the technology they used but also were able to describe its possible benefits. As the participants were aspiring secondary mathematics teachers, they described how the technology helped their own learning and how it can be helpful in teaching.
During the class, students received their calculator activities through the File Transfer. However, only three participants talked about this feature and its possible benefits. This resulted not more than a total of five code unit count for each group under the codes FT (Student describes the file transferring feature) and BFT (Describes possible benefits of file transfer). Thus, those two code units were not considered in the statistical analysis (see Table 2). Despite the fact that the File Transfer was described only a few times, responses like, “with the file transfer doing it all at once as opposed to having to spend five minutes having come up to your computer or you know plug in their calculators to transfer that way. Like what you just do with the Nspires. It's a time saver.” (CGS3) and “I think that the TI-Navigator system it saves time as I said earlier. Like when you have the octopus it takes a lot of time to transfer files,” (NGS4) indicate that some participants were able to identify the potential benefits of the File Transfer feature.
The qualitative data, including the data given in the Table 5 and the above responses of the participants, and the above statistical results (Table 3) are complementing evidence to support the assertion that both groups were able to identify the features and their benefits regardless of the length of their experience with the system.
As the participants of the study were pre-service secondary mathematics teachers, it is important to investigate not only their ability to identify how a particular technology works but also their ability to understand how it helped or hindered their learning. All of the participants unanimously agreed that the student response system did not hinder their learning. When they described the features of the system, the participants described how it helped their learning and how it can possibly help in their future teaching as well. All participants from both groups described how the Screen Capture feature helped them to compare their work with the others. Responses like “And that would be a really quick way because I can go through, even look at all the screens and see they all have the same number and it also keeps an eye on” (NGS6), “You're a lot more active, sometimes you get off task like me, that's the nice thing about the teacher being able to see the screens, so that if you are goofing off” (NGS5), and “I can see everybody's screens on it, so you could see, instead of having look over your neighbor you can just look up and see if you are doing the same thing as everyone else. So even for me it was a self motivator, oh crap they can see what I am doing” (CGS2) are evidence to support this claim. Participants also identified that knowing the teacher is monitoring their calculator screens encouraged them to stay focused on the classroom activities. All of the participants were seniors, and many of them described that they were self-motivated to actively participate in the classroom activities regardless. However, they learned that the teacher could help them as they need it through the calculator screen monitoring. Responses like “So I feel like it's a really good tool because it allows the teacher to not only watch the students and see if they are actually paying attention but also see if they are discovering it” (CGS7), “And then on the screen the teacher could look at what all of us are working on and make sure we are on the task”(CGS1), “And I think in our case the student still following and still learning but in a middle school classroom or high school classroom, you want all your students to be doing it, so that they will learn how to do it” (NGS3), and “it's a pretty good push to stay on task, because you're like 'Oh, the teacher might see that I'm goofing off instead of doing my work” (NGS5) are evidence to support that participants held positive perspectives on the instructor-monitored classroom environment generated through the student response system. The above qualitative data along with the quantitative analysis summary of Table 3 suggest that there is no difference in participants' ability to describe how the system helped their learning between the two groups. 5.4.3 Theme 3: The Ability to Describe how the System would help Teachers During the interviews, participants described the possible use of the system in their future mathematics classrooms, even when this was not directly asked within the interview question (see appendix 1 for interview questions). Participants considered that monitoring students' calculator activities and checking their understanding within a lesson itself are very important to them. They frequently described the potential use of Screen Capture and Quick Poll in their future classrooms. Participant 7 from the calculator group said, “Like checking for understanding is very difficult in a classroom setting because there are so many students and sometimes students are afraid to raise their hand”. Another participant said, “I think it helps tremendously with checking for understanding throughout the lesson. And a little way to assess how their understanding or check to make sure they are even participating” (CGS4). Participants also explained that through the monitoring, they should be able to address the issues immediately rather than at a later time. Responses like “So you are able to see, you know, where they may be [having] misconceptions or where they may be going on a different path or you know things like that,” (NG01) and “It allows you to check for understanding and see if may be one student hasn't done anything on their calculator. Then you know that they might not know how to do it,” (NGS2) are evidence to support the above claim.
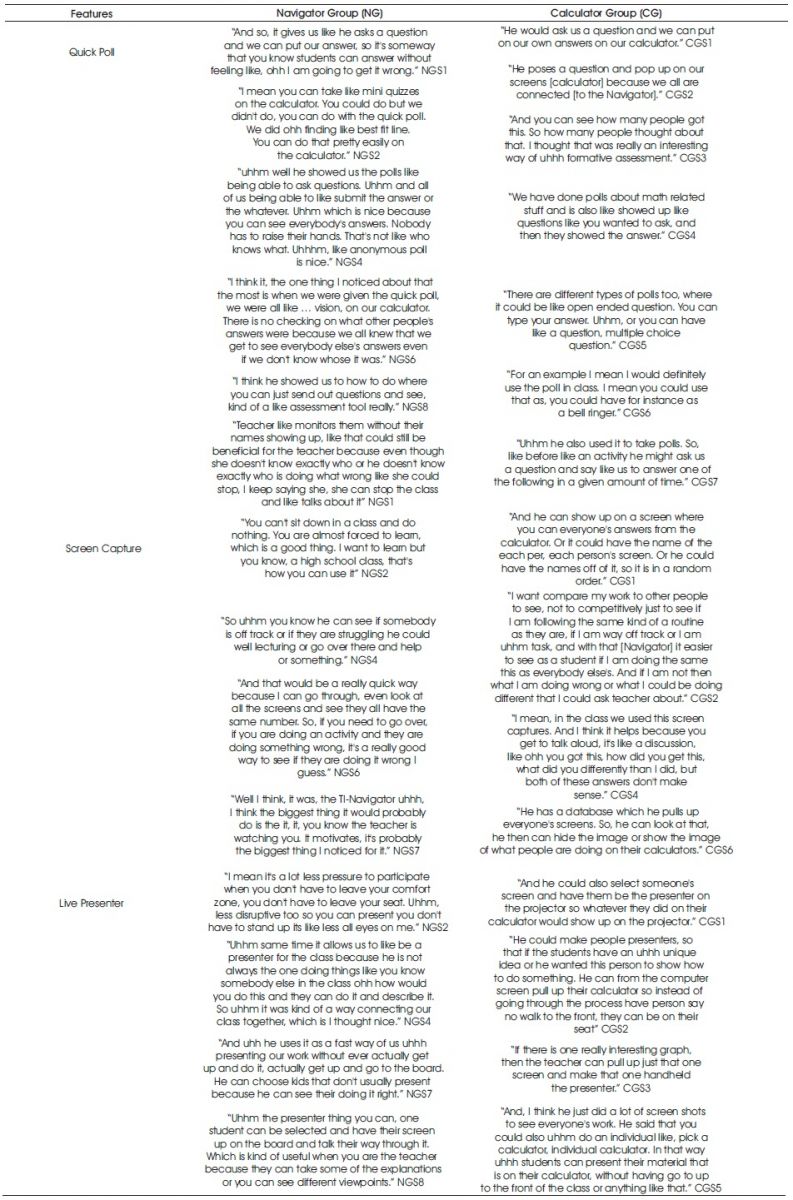
Table 5. Responses of the Participants on the Features of the System and its Benefits
Participants also identified that knowing the teacher is monitoring their calculator screens encouraged them to stay focused on the classroom activities. All of the participants were seniors, and many of them described that they were self-motivated to actively participate in the classroom activities regardless. However, they learned that the teacher could help them as they need it through the calculator screen monitoring. Responses like “So I feel like it's a really good tool because it allows the teacher to not only watch the students and see if they are actually paying attention but also see if they are discovering it” (CGS7), “And then on the screen the teacher could look at what all of us are working on and make sure we are on the task”(CGS1), “And I think in our case the student still following and still learning but in a middle school classroom or high school classroom, you want all your students to be doing it, so that they will learn how to do it” (NGS3), and “it's a pretty good push to stay on task, because you're like 'Oh, the teacher might see that I'm goofing off instead of doing my work” (NGS5) are evidence to support that participants held positive perspectives on the instructor-monitored classroom environment generated through the student response system. The above qualitative data along with the quantitative analysis summary of Table 3 suggest that there is no difference in participants' ability to describe how the system helped their learning between the two groups. 5.4.3 Theme 3: The Ability to Describe how the System would help Teachers During the interviews, participants described the possible use of the system in their future mathematics classrooms, even when this was not directly asked within the interview question (see appendix 1 for interview questions). Participants considered that monitoring students' calculator activities and checking their understanding within a lesson itself are very important to them. They frequently described the potential use of Screen Capture and Quick Poll in their future classrooms. Participant 7 from the calculator group said, “Like checking for understanding is very difficult in a classroom setting because there are so many students and sometimes students are afraid to raise their hand”. Another participant said, “I think it helps tremendously with checking for understanding throughout the lesson. And a little way to assess how their understanding or check to make sure they are even participating” (CGS4). Participants also explained that through the monitoring, they should be able to address the issues immediately rather than at a later time. Responses like “So you are able to see, you know, where they may be [having] misconceptions or where they may be going on a different path or you know things like that,” (NG01) and “It allows you to check for understanding and see if may be one student hasn't done anything on their calculator. Then you know that they might not know how to do it,” (NGS2) are evidence to support the above claim. Participants from both the Navigator group and Calculator group, which used the system for 14 weeks and three weeks respectively, also described how the system could help to create a comfortable environment for students to share ideas, especially for students who might not regularly talk in front of the class for various reasons. Responses like “Leaders of your group will answer and will participate but you are not going to get participation from someone who may be not confident about their math skills. Everyone can participate, it is anonymous” (NGS2), “He can choose kids that don't usually participate because he can see they're doing it right. It's easy to pick on those students who usually wouldn't put themselves out even if they have the right answer” (NGS7), and “especially with students who are shy, don't want to get their answers across, it could be an easier way for them to get their thoughts towards the teacher without being known who it was” (CGS1) are evidence to support this claim. Responses such as “I mean it's a lot less pressure to participate when you don't have to leave your comfort zone, you don't have to leave your seat” (NGS2) and “it's a cool way to have people present, their ideas with the presenter mode. They don't have to get up and go in front of the class” (CGS1) further explain how the system can help students to share their mathematical thinking with the teacher and the whole class. Again, the above qualitative data indicate how the participants from both groups explained the use of technology in their future classrooms and the statistical comparison in Table 3 supports the claim that there is no statistical difference in responses between the two groups.
As we stated earlier, this study investigates whether there is a difference between two groups of pre-service secondary mathematics teachers' ability to identify a functionality of a particular student response technology in relation to the length of the instructional time with the technology. In understanding how the participants would describe the features of the system, as in if it helped or hindered their learning, if they would use such (or similar) technology in their future mathematics classrooms, and why would they use it, we collected participants' responses through interviews. In comparing this qualitative data between the two groups, we compared the frequencies of coding units to utilize a statistical analysis. We have provided substantial qualitative evidence to illustrate in what ways the participants have described the features of technology, its possible future use, and why they would use it. Based on the qualitative evidence and the statistical analysis, we can conclude that there is no difference between the two groups in describing the system and its use, regardless of the length of the use of the system. There is little to no existing research on investigating the effects of the length of instructional time with a particular technology on students' understanding of said technology. Depending on the technology, it can require more or less time for students to learn or identify the key features of that technology. As the literature suggested earlier, many teacher preparation programs identified that time can play a critical role in deciding the content of a course. The findings of this study are raising an interesting question: how much instruction time is to be spent so that students can have a substantial level of understanding of a particular technology? This study cannot suggest the teacher preparation programs to spend three weeks or 14 weeks of instructional time, but it does suggest that based on the technology, the instructional time can be optimized. Thus, the teacher preparation programs can structure such courses efficiently and include variety of educational technologies within a course. Limitations and Future Directions It is evident that the sample size of this study could not be large enough to generalize the findings of the study to a larger population even though the sample satisfied the necessary conditions of the statistical tests we used. Thus, we would like to investigate the effect of the instructional time on a variety of technologies by using a larger sample size; as we argued above, different technologies can require differing amounts of instructional time.