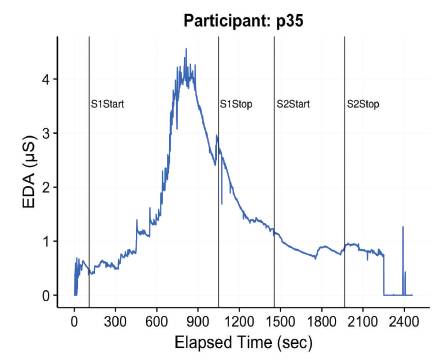
Figure 1. Time series of EDA for Participant p35. Search Task Sessions 1 and 2 Start and Stop Times are Marked by Vertical Lines and Accompanying Labels, S1Start, S1Stop, S2Start, and S2Stop directly to the Right of the Delineating Lines
This paper presents a comprehensive review and a specific example implementation of a minimally invasive technique that can be used to make quantitative measurements of a subject's Electro-Dermal Activity (EDA) in educational technology studies. The Q sensor is a low-cost wireless sensor that can be worn on the wrist to measure a subject's response to various stimuli in both laboratory and natural education research settings. The example application shown here is from a study on presence while viewing two different screen sizes used in a Virtual Reality (VR) system. It is recommended that EDA data be used in conjunction with other data, such as from other types of sensors and from qualitative instruments such as surveys, because human EDA response to a given environment and stimuli is not always consistent. EDA sensors show great promise as an effective tool that can be used in educational technology research.
Research in the field of education, including studies relating to educational technology, can be identified in the broad category of human behavior research. In that role, educational and educational technology research are subject to the issues typically inherent in studies of human behavior. These studies have some unique challenges compared to other disciplines such as those in science and engineering that study machines and processes that typically give consistent and repeatable results to a given set of conditions. This is not typically the case for humans where the response to a given set of stimuli may produce a wide range of results depending on the subjects and environments studied. Another challenge for human behavior studies is making unobtrusive objective measurements that do not influence subjects' responses to affective stimuli.
One of the main challenges in studying human behavior is to quantitatively assess the participants' affective states by measuring their psychophysiological signals in ecologically valid conditions. The quality of the acquired data, in fact, is often poor due to artifacts generated by natural interactions, such as full body movements and gestures (Betella et al., 2014).
The availability of a technology capable of consistent and objective measurement of human affective response would constitute an important contribution to the study of human responses to educational interventions, including instructional media applications. A technology with such capability could provide a valuable tool for extending research in a variety of educational technology areas, including demonstrating effects of new and emerging communication media, interaction strategies, and social/cultural environments.
The working hypothesis for this paper was that such a measurement technology does, in fact, exist; has a demonstrated history of effective use in human behavior research; and has considerable potential for new affective-response research in the field of educational technology. The purpose of this paper is to address this hypothesis by reviewing the technology known as Skin Conductance or Electro-Dermal Activity (EDA), including its scientific nature, its measurement, its research history and examples, its techniques for analyzing and interpreting data, and its potential for new research in educational technology. After reviewing the available literature and their personal experimentation with available EDA technology, the authors propose that the measurement of skin conductance by an appropriate device is a suitable and effective method to obtain unobtrusive quantitative data on the affective state of human subjects. This physiological measurement can give indirect information about the response of subjects to personally encountered experiences. The purpose of this paper is to provide a general review of this experimental technology and a specific review of a particular device for EDA measurement, discuss its potential for educational technology research, give some sample results in a specific implementation, and provide conclusions and recommendations.
To date, most of the research using Skin Conductance measurement has been in the general subject area of psychology, as documented by Prokasy and Raskin's (1973) book on the use of skin conductance in psychological research, both basic and applied. Such research has, as yet, seen little use of the field of education. However, as research and development continue to open a stream of new technologies for teaching and learning, skin conductance measurement offers strong new potential for examining human affective responses to educational experiences. The studies described here demonstrate the wide range of applications and contexts to which skin conductance research has been applied and suggests its potential for a similar range of educational technology studies.
One device for skin conductance measurement is the Q™ Sensor 2.0, made by Affectiva (http://qsensorsupport. affectiva.com/). Thüs et al., (2012) referred to this device as a bio-sensor which can non-invasively measure a subject's physiological states. It is designed to measure two variables: skin electrical conductance (microsiemens or μS) and temperature (°C or °F), as objective measures of sympathetic nervous system activation during everyday activities. The device has the appearance of a wristwatch where a small metal disk contacts the subject's skin, usually near the wrist on the palm side. It is very lightweight and has no connecting wires so it is very unobtrusive to the subject. In recent research on virtual reality environments, the authors observed that subjects quickly forgot they were wearing a Q Sensor.
The unobtrusive, rechargeable, and wireless sensor can collect data at an adjustable sampling rate from 2 to 32 Hz. Proprietary software that comes with the Q Sensor and requires no modification by researchers is used to set up the device and to display the collected data. The EDA/ temperature data can be either collected on-board the device's memory and later downloaded to a computer for analysis (Q program), or it can be transmitted to the computer wirelessly in real time via Bluetooth® (Q Live program).
The Q Sensor was specifically developed to make nonintrusive measurements outside of the laboratory with a device that can be comfortably worn for extensive periods of time (Poh, Swenson, and Picard, 2010). This relatively inexpensive and non-intrusive device permits measurements in natural environments. Its nature, reported uses, and research potentials are discussed in this paper.
This paper focuses specifically on the Q Sensor as the instrument for measuring EDA and reports on the foundational literature presented to validate EDA sensors as research tools. However, the Affectiva Q Sensor is no longer produced and, while still in use in field research, is not currently available for purchase. Fortunately, there are new similar devices available that function much like the Q Sensor, have the same benefits as research tools, are validated by the basic Q Sensor research, and are well documented in current research. Supporting research can be reviewed at the corporate websites of the producing companies for these newer devices.
One current EDA device is the EdaMove made by the German company Movisens (http://www.movisens.com) and popular in EDA research in European universities. More common in the United States are devices made by Empatica (http://www.empatica.com). The Embrace is a consumer-level device, while the more sophisticated E4 is the device most suitable for EDA research and currently used by clients, such as Intel, MicroSoft research, NASA, and major American universities, including Harvard, Stanford, and MIT. The Empatica E4 is the direct descendent of the original Q Sensor and was developed as the successor to that sensor.
Electro-Dermal Activity (EDA) is not a new technology, but rather has been used since the nineteenth century to study the physiological response of subjects when exposed to some type of stimuli (Féré, 1888; Jung, 1919). The phenomenon was first observed by Vigouroux in 1879. Neumann and Blanton (1970) provided a detailed history of the early research on EDA.
EDA is correlated with the sympathetic nervous system activity. This activity can be measured by the sweat generated by a subject. Sweat is a weak electrolyte and a good electrical conductor which changes the electrical potential between two electrodes on a sensor. Two approaches are used. The first is referred to as endosomatic which does not use an external current. The second is called exosomatic where either a Direct Current (DC) or an Alternating Current (AC) is applied through a pair of electrodes at the skin surface. The Q Sensor is an exosomatic device that uses a DC current to measure the electro-dermal output. This output is known by such terms as the Skin Conductance Level (SCL), the Skin Conductance Response (SCR), the Skin Resistance Response (SRR), or the Galvanic Skin Response (GSR) (Affanni and Chiorboli, 2015).
EDA measurement is typically made in areas of the body where the sweat gland density is highest, such as at or near the palm of the hand. In the case of emotional arousal, EDA may measure higher or lower levels of electrical conductance, with higher EDA levels representing higher perceived arousal by the subject. In a review article, Dawson, Schell, and Filion (2007) stated that EDA is one of the most widely used psychophysiological measurements. Venables and Christie (1973) provided a detailed discussion of the mechanisms involved in measuring electro-dermal activity. Boucsein (2012) wrote a book that provides the details of the principles of EDA, including the physiology of the sweat gland process, along with the methods and applications of its measurement.
The EDA technique has many potential benefits for research and researchers. The equipment cost is moderate (usually less than $2,000 per device), which typically includes the software. The measurement is noninvasive, generally non-intrusive, and relatively sensitive. Kellihan et al., (2013) described the use of EDA as entailing multiple sensors that can be used not only in the laboratory, but in the “real world” as well, which is critical in moving research into naturalistic settings. Such settings are both necessary and desirable in much educational technology research which is frequently conducted in classrooms and workplaces. Another very important feature of EDA technology for research is that subjects cannot control their EDA which makes the results, if properly implemented, quantitative and objective. One of the most significant benefits is that EDA variables are free from linguistic problems, such as literacy issues, language translation difficulties, and cultural complexities. Thus, EDA is suitable for use in a multitude of international settings and crosscultural studies, as is clearly documented in the references cited in this paper. This feature is of importance to educational technology research which frequently addresses similarities and differences in technology effects among and across different populations. Finally, the sensors offer a way to define and objectively measure responses to stimuli that is relatively free from the subjectivity, unreliability, and bias often observed in common affective techniques, such as questionnaires and interviewing.
The use of Q Sensors and similar EDA instruments has a respectable research history, in which numerous aspects and uses of the EDA technology have been documented in the literature. What is important about these studies is not so much what they reveal as that, through the addition of EDR and sensors, they present another way of discovering; they extend the range of available techniques for seeking information about technologies, human affective responses, and individual differences. This has particular relevance for educational technology, where learner reactions and perceptions can be extremely important to assessing learning effects and yet difficult to measure. The sensors offer an additional way to define and objectively measure responses to stimuli. Descriptions of a variety of selected representative studies are presented here to illustrate the range of EDR/Q Sensor studies available from recent research literature.
Before adopting EDR as a technique for research, educational technologists will want some assurance the technique has validity. The validity of easily-used Q Sensors as research technology has been assessed in several studies. The original set of experiments used to validate the Q Sensor addressed concurrent validity of the device by comparing its output data to that of a similar previously proven device. This study consisted of 26 participants between the ages of 18 and 56 (Poh et al., 2010). The experiments were designed to measure responses to three types of tasks: physical, cognitive, and emotional. Sixteen participants (eight females and eight males) were enrolled in a physical task, 15 participants (nine females and six males) underwent a cognitive task, and 13 participants (eight females and five males) were subjected to an emotional task. Measurements were collected and compared for two similar instruments. These were (a) the new Q Sensor, worn on three different locations on the fingers of the left hand and both wrists and (b) a device approved by the U.S. Food and Drug Administration called the Flexcomp Infiniti made by Thought Technologies, Ltd., worn on the right fingers. During the physical task, participants rode a stationary recumbent bicycle for 5 minutes at a fixed resistance level and then remained seated for a recovery period of 10 minutes, with EDA measurements being made during the entire time. For the cognitive task, participants sat quietly in a darkened, sound-dampened room for 10 minutes to get a baseline measurement prior to following instructions projected on a screen to perform some mental arithmetic and read a series of color words (red, blue, green, brown, and purple). For the emotional task, participants sat quietly for 19 minutes, were then informed they would watch a clip from a horror movie, waited in anticipation for a minute, watched the five-minute clip, then relaxed for a recovery period of ten minutes. Measurements between the Q Sensor and the Flexcomp were in good agreement, leading the researchers to conclude the Q Sensor was a valid alternative to the Flexcomp. The response from the sensors on the fingers produced a larger signal than those on the wrists. In addition to these experiments, one 19-yearold male agreed to wear the Q Sensor for seven days. No side effects or discomfort were reported. These data showed a comprehensive set of responses based on a variety of tasks, such as studying, taking exams, attending classes and labs, doing homework, sleeping, and watching television, suggesting the suitability of the Q Sensor for a variety of settings. This is an important consideration for educational technology research, given the wide range of populations, settings, variables, and interventions covered by this field.
In another device-comparison study, Kappas et al., (2013) studied how Q Sensor measurements compared to more invasive traditional EDA technology in different social laboratory studies. In one study, 33 participants were exposed to a variety of stimuli, such as film clips, white noise, unexpected noise, and a social game. The results showed the Q Sensor was not as precise as traditional wired finger electrodes and had too many non-responsive cases. However, the researchers pointed out the portability of the Q Sensor makes it amenable to certain research situations that would be problematic for wired sensors. Again, this is an important consideration for educational technology research situated in classrooms, workplaces, and other naturalistic settings
Prasad (2013) approached device validation by studying the use of a Q Sensor in four different parts of the body that have a high concentration of eccrine (type of sweat) glands: fingers, palm, wrist, and under the foot. Q Sensor readings were compared against a commercially available “gold standard” device from AD instruments. The 20 participants consisted of eight males and twelve females. Results showed the two instruments were statistically equivalent. Measurements from the palm and under the foot were as effective as those on the fingers. Those from the wrist were of poorer quality because of the low signal.
Silveira, Eriksson, Sheth, and Sheppard (2013) approached Q Sensor validation through a different type of comparison. They compared movie rating responses of subjects through Q Sensor EDA measures and self-reports on a traditional opinion instrument. The two measures presented a high level of agreement at more than 70%. Weddle and Yu (2013) similarly demonstrated good correspondence between Q Sensor readings and subject self-reports of emotion in a study of video/haptic technologies.
The studies reported here generally supported the validity of EDA data and Q Sensor technology as a method for measuring human affective responses. Some studies have been less favorable. This is demonstrated in some of the literature reported below. However, given the reports of Q Sensor validity discussed above, coupled with its portability and other advantages, the authors propose this technique that represents a valuable addition to educational technology research methodology.
Numerous studies have examined the use of Q Sensors to assess human reactions to the addition of machine devices to learning experiences, an area of prime importance to educational technology research. Corrigan, Peters, and Castellano (2013) used the sensors to evaluate their hypothesis that robots can be used to enhance and support the learning experience. These researchers conducted an experimental study to design, develop, and evaluate a new model for automatically detecting changes in a participant's task engagement. The Human-Robot Interaction (HRI) was studied by comparing task engagement with and without a robot. In the cases using a robot, both helpful and unhelpful robots were considered. In this report of a pending research study, a Q Sensor was to be used to record arousal in real-time, although no results were reported. By extension, the concept and design of this proposed study could be effectively applied to a wide variety of educational technologies in a with-and-without research model.
In a study of learner frustration in computer-mediated learning, Aghaei (2013) used a Q Sensor as part of an adaptive affective computing environment. Participants were deliberately exposed to a frustrating event on a computer. The Q Sensor detected arousal which was used to adapt the look and feel of the computer software interface. Experiments considered three types of affectsupport. A control group (no support adaptation) was compared against the adaptive group with 20 participants in each group with ages ranging from 19 to 36 in single one-hour sessions. The Q Sensor measured some level of frustration, determined by a significant rise in EDA for up to ten seconds, in approximately 80 percent of the participants in each group. This study offers a potential design strategy for other studies of arousal and frustration in learners who experience a variety of educational technologies.
Computer vision systems are used to monitor human attention to improve ergonomics and enhance effectiveness. Q Sensors have been employed to research these systems. Paletta et al., (2013) used a Q Sensor in an experimental study to measure participants' EDA to help determine the effectiveness of a computer vision system. Results indicated that only a small fraction of participants were calmed with adaptive software which involved changing to more soothing color schemes. These results suggest that educational technology researchers interested in this line of inquiry should investigate other approaches beyond mere color usage to improve computer vision systems.
Weddle and Yu (2013) used the Q Sensor to assess another technology. They experimentally studied the emotional response to haptic (vibrotactile) enhancement in mobile video applications. The electro-dermal responses of the participants to stimuli were measured using the Q Sensor. The results showed subjects were strongly emotionally aroused by the addition of haptic stimulation to videos viewed on mobile phones, suggesting the efficacy of this technology in creating affective response. The mean EDA for the haptic enhanced group was nearly 75% greater than for the control group with no haptic enhancement. These results were corroborated by participant emotion self-reports. They suggest that haptic stimuli may have strong potential for increasing affective response in learning environments, a hypothesis that may be of interest to educational technology researchers.
One of the most promising technologies currently entering the main stream for both entertainment and learning is Virtual Reality (VR). VR technology can now immerse users in an environment “… digitally with a high degree of visual fidelity, learner control, and interactivity” (Ausburn, Ausburn, and Kroutter, 2017, p. 200). Because of its realism, VR sits at the base of a multimedia cone of abstraction with strong potential for facilitating learning (Baukal, Ausburn, and Ausburn, 2013). Research has not yet established reliable guidelines for designing and implementing VR technology or for assessing its effects and outcomes. However, EDA and Q Sensors have already been applied to this technology research and are providing a new approach to empirical study of virtual reality. For example, Nilsson, Nordahl, Turchet, and Serafin (2012) and Nordahl, Serafin, Nilsson, and Turchet (2012) used Q Sensors to study the physiological response of participants in a virtual environment designed to simulate walking on virtual ground. The specific purpose of the experiments was to investigate the effects of auditory and haptic feedback, both nonvisual cues, at feet level to enhance the realism in a virtual environment. Subjects visited a virtual environment by wearing a head-mounted display and custom-made sandals equipped with sensors and actuators. The environment simulated walking across a platform overlooking a canyon. Q Sensors worn on the participants' wrists measured participants' physiological responses to the virtual environment with and without audio-haptic feedback. The physiological measurements did not show a statistically significant difference between the two main conditions studied where the first included passive haptic feedback and the second did not, suggesting that in this case, contrary to the findings of Weddle and Yu (2013), haptic feedback did not contribute significantly to the virtual experience.
Broeks (2012) and Schnittker (2012) studied five new automobile drivers' (three male and two female, between ages 17 and 18) responses to driving simulator training. This was a longitudinal study as participants were tracked over an extended amount of time as they completed multiple simulator modules. Q Sensors were used to measure the students' physiological responses to stimuli from the simulator designed to give the novice drivers more experience through a high incidence of accidents. The hypothesis was that students' stress levels and corresponding physiological responses would decline as they gained more experience and their cognitive load decreased. Some ambiguities were found in interpreting the EDA measurement, as the effect of EDA varied significantly between participants. However, the data provided useful information on the cognitive load on these drivers and what kind of EDA responses resulted from different driving situations, particularly on the highway.
Of interest to workplace learning and performance, Kindness, Mellish, and Masthoff (2013) experimentally studied the effectiveness of a virtual teammate to help reduce loneliness and stress through empathetic support. One of the methods used to measure participants' stress was a Q Sensor. As hypothesized, the results showed that stress was higher as measured by skin conductance for the condition where no support was provided. Interestingly, this contradicted the results for that condition using mean heart rate.
Higher quality computer graphics in interactive applications such as virtual reality are assumed to create a more immersive experience for the user. Ocasio-De Jesus, Kennedy, and Whittinghill (2013) investigated that assumption by using a Q Sensor to measure participants' EDA response to viewing videogames with low- and highquality graphics. Unexpectedly, contrary to theory related to realism in virtual environments, no significant increase in emotional response was found for higher resolution graphical quality. The present authors are currently working on similar realism-theory research using Q Sensors to examine learners' physical responses to virtual environments presented on large versus small computer screens and possible relationships to personal variables, such as age, gender, and susceptibility to immersive experiences. Some data examples from this research are presented below in the section on example Q Sensor data and results.
Pettersson and Swensson (2013) studied multimedia gaming, a technology closely related to virtually reality. They used a Q Sensor to dynamically modify the popular videogame Tetris by changing the speed of the game based on EDA measurements. The game could be made slower if it was too difficult as determined by a stressful or emotionally-aroused response and faster if it was too easy as determined by a calm response. There were six participants with two as reference and four as experimental subjects. The game was played for a total of five minutes with various conditions encountered each minute where players were asked to try to make the game go faster at times and slower at other times. Results showed players could alter their EDA, but only for shorter periods of time.
Wu et al., (2014) conducted an experimental study of participants' emotional responses to a rapidly deteriorating virtual human animation in a medical education virtual environment used for training hospital nurses. There were 22 participants between ages 18 and 35 with 9 males and 13 females. A Q Sensor was used to measure the participants' EDA as one of the methods to determine responses to animated versus non-animated simulations. There were six phases in the experiment: one pre-experiment (survey and training), four experiments (four time steps and three surveys), and one post-experiment (survey and evaluation). The EDA mean values were calculated for each phase. The EDA mean value for the first phase was statistically significantly less than the means for the testing phases. This was to be expected given the participants' exposure to rapidly deteriorating patients. Counter to the initial hypothesis, most participants showed a decrease instead of an increase in EDA as their patients deteriorated. The explanation was that participants habituated to the VR simulation over time.
Harley, Bouchet, Hussain, Azevedo, and Calvo (2015) studied methods of assessing emotional responses to intelligent tutoring. They evaluated the synchronization of three emotional measurement methods (automatic facial expression recognition, self-report, and electro-dermal activity) and their agreement regarding learners' emotions. They studied a multi-agent, intelligent tutoring hypermedia system called MetaTutor in a computerized learning environment. The subjects were 67 undergraduate students (82.1% female) from a large public North American university whose electro-dermal activity was measured with a Q Sensor. High agreement was found between the facial and self-report data, but low levels between those measures and the Q Sensor data. The authors concluded that physiological response (EDA in this case) is not always closely coupled with facial expressions.
The studies reported in this section all relate to VR and the technologies used in virtual environments. Given the emergence of VR as a mainstream educational technology and the volume of research currently being generated in this aspect of educational technology, these studies collectively suggest a high degree of potential for EDA and Q Sensors as research tools for the field.
Another area in which EDA and Q Sensors are demonstrating research efficacy is human response to stimuli, where this technology has demonstrated usefulness in a variety of applications and contexts. Oosting (2012) studied participants' responses to three types of conditions: human/robot communication, aphasia, and social media. There were 30 participants, with 10 for each condition, with a total of 20 females and 10 males ranging in age from 17 to 50. A Q Sensor was used to measure task engagement. The results showed the influence of context was not as significant as expected, challenging assumptions in this area.
Sano and Picard (2013) experimentally studied stress as measured for 18 subjects over a five-day period using wearable sensors, mobile phones, and surveys. A Q Sensor worn on the participants' non-dominant hand was used to collect accelerometer and skin conductance data. Of the methods used to measure stress, skin conductance had relatively lower accuracy for predicting stress compared to the reported stress on the surveys. The accuracy increased significantly when skin conductance was combined with other methods, suggesting that for some contexts, EDA may be more appropriate as an additional, rather than an alternative, data source.
Yeykelis, Cummings, and Reeves (2014) used a Q Sensor to study the physiological response of subjects when they switched to a different type of media on the same device which in this case was a personal computer. This is referred to as task switching. The researchers' interest was based on the theory of motivated cognition which holds that switches occur due to low subject involvement in the current content with the expectation that interest will be renewed by the new content. They hypothesized physiological arousal (measured by skin conductance levels) would theoretically increase at the start of the switch and decrease after the switch. The EDA responses and screen shot collection used to determine task switching were measured for 12 undergraduate students over 10 hours (between 2 pm and midnight) during a normal weekday in their natural environment rather than in a laboratory setting. Students spent an average of 26% of the time on the computer where time away was determined by accelerometer data. EDA measurements showed arousal started 12 seconds before a switch. The actual response varied with the type of switch such as from “work” (e.g., word-processing application) to entertainment (e.g., Facebook).
Learner response to stimuli is a prime concern for educational technology research. However, stimulus response can be difficult to measure objectively when it relies on subjective verbal instruments, such as questionnaires and interviews. In addition, affect may be difficult to define and identify through standard tests of knowledge acquisition. The research in the early days of “audio-visual” research comes to mind, in which the effects of color on learning were debated at length. The studies reported here indicate and support the potential for EDA and Q Sensors to serve as tools for adding more objective physiological measures to assessing learners' responses to media stimuli.
The literature presented in this paper illustrates and documents the variety of technology-related research contexts and variables to which EDA and Q Sensors have been applied and supports the sensor's efficacy as a research tool. To further assist educational technology researchers in understanding the nature of Q Sensor data output and use, this section provides sample data from research the authors are currently engaged in related to virtual reality educational technology.
The purpose of the study described here was to investigate effects of computer monitor screen size on the sense of presence experienced by users of a Virtual Reality (VR) system and learner variables that may be related to these effects. VR is a computer-based educational technology that presents a three-dimensional model of physical space, providing the user with the ability to interact with the modeled space in a realistic and immersive manner through the system's interface controls (Ausburn, Martens, Dotterer, and Calhoun, 2009). Educational and training applications of VR technology have been numerous, especially in the domain of technical training (Ausburn, and Ausburn, 2008), and recent research has demonstrated the efficacy of this approach in areas, such as orientation learning of both non-technical and occupational spaces, transfer of training, procedural knowledge, and workplace readiness for people with disabilities (Ausburn, Ausburn, Dotterer, Washington, and Krouter, 2013; Martens, 2016). A key to the effective use of VR in educational and training contexts is the establishment of a strong sense of presence (Ausburn, Ausburn, Dotterer, Washington, and Krouter, 2013). Presence has been viewed and defined from several phenomenological, sociological, and psychological perspectives (Turner and Turner, 2006), but can be basically characterized as the sense of actually being in a physical space even though a representation of that space is presented in a virtual format (Ausburn and Ausburn, 2010; Ijsselsteijn, Freeman, and De Ridder, 2001). It has often been assumed by technologists that larger computer screen sizes contribute to learners' sense of presence in VR environments. However, this assumption has not been well tested in the research literature. Furthermore, none of the quantitative instruments for measuring presence offered in the technology literature has been fully accepted as appropriate and successful in studying presence. This study addressed these issues by examining presence through several novel approaches, including the introduction of Q Sensor EDA data.
To investigate the presence phenomena in VR and its relationships with computer screen size and learner characteristics, the present authors designed a study that used several types of instruments, including learner demographic data and the traditional self-report instruments known as the Witmer and Singer (1998) Immersive Tendency Questionnaire (ITQ) and Presence Questionnaire (PQ). It also introduced two new data sources: qualitative data, as recommended by Martens (2016) in his study of orientation learning patterns in VR environments, and EDA data. The qualitative data was obtained from post-session participant interviews modeled from a questionnaire proposed by Slater, Usoh, and Steed (1994), and the EDA data was collected with a Q Sensor. Consistent with the concept of presence as a psychological construct and the promising use of EDA measurement in prior psychological studies in the field of educational technology, the study's researchers considered that measurement of EDA might provide a useful indicator of presence level during VR-based activities, especially when triangulated with other instruments developed by presence researchers.
The study used a within-group, repeated measures experimental design. Study participants, who were adult students and staff at a post-secondary career and occupational education institute, consecutively completed environment-search tasks using two different VR hardware systems that were equipped with computer monitors of 32 and 17 inches (81 and 43 cm) in size, as measured diagonally across the monitor's display screen. Each participant worked with both computer screen sizes to enable comparisons, with random assignment of the monitor size viewing order. Both VR systems presented the virtual environments via browser-based Gigapan VR software installed on standard desktop personal computer hardware. Participants used the VR systems to search for five landmarks contained in city scape scenes of Monte Carlo and Rio de Janeiro that were available on Gigapan's website (www.gigapan.com). As with the screen size condition, the order of city scape viewing was randomly assigned. Participants wore a Q Sensor device on their right wrist during the search tasks and were given a maximum of 15 minutes to complete each search task. Researchers recorded the duration of the search sessions and the number of correctly identified landmarks for each search task. Upon completion of each search task, participants completed the Witmer and Singer (1998) PQ survey and answered several interview questions regarding the sense of presence they encountered and their general impressions of the experience. Participants also completed the Witmer and Singer (1998) ITQ survey prior to conducting the first search task session.
The Q software provided with the Q Sensor was used to configure the device via its USB interface to collect the participants' EDA at a rate of 8 Hz. Collected data were recorded in the device's on-board log files. A Q Sensor feature that inserts a timestamp marker into the on-board recorded data stream when the participant presses the device's primary button was particularly useful; researchers instructed participants to perform this action at the start and end of the search tasks, thus providing a delineation of those times in the recorded data stream. After each participant completed the study, researchers used the Q Sensor's USB interface to download the log file for that session to a personal computer for further analysis, naming each file with the participant's subject identifier.
After consolidating and analyzing the data, descriptive statistics (mean, median, max, min, and standard deviation) were calculated based on the EDA data observations for each of the search task sessions. Timeseries EDA data were also plotted.
As a data example, a summary of the data collected for the two search task sessions conducted by one of the 35 study participants, an 18-year-old male identified as “p35”, is presented in Table 1. Data include screen size and virtual cityscape conditions (e.g. small screen, Rio de Janeiro cityscape); elapsed start, end, and duration times; number of EDA observations made by the Q Sensor; count of landmarks successfully found in the cityscape during the search tasks; and descriptive statistics (mean, median, max, min, and standard deviation) for the EDA measurements taken during each search task session. A time-series plot derived from the EDA observations is presented in Figure 1.
Figure 1. Time series of EDA for Participant p35. Search Task Sessions 1 and 2 Start and Stop Times are Marked by Vertical Lines and Accompanying Labels, S1Start, S1Stop, S2Start, and S2Stop directly to the Right of the Delineating Lines
Referring to the data compiled in Table 1, a comparison of the search task sessions shows that participant p35 found all five of the landmarks in 513 seconds during the second session (small screen, Rio de Janeiro cityscape), which was more than 400 seconds quicker than the participant's search to find the five landmarks during the first session (large screen, Monte Carlo cityscape). Comparing the EDA values between the search tasks sessions, participant p35 exhibited a lower mean EDA level of .87 μS during the second session (small screen) than the first session's (large screen) mean EDA level of 1.91 μS. Variability of the recorded EDA values was higher for the large screen session in comparison to the small screen session as exhibited by the larger range of minimum and maximum EDA levels and a larger standard deviation.
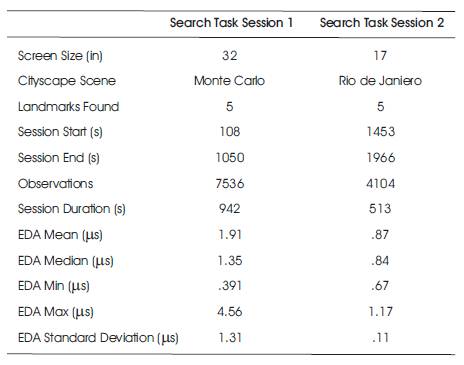
Table 1. Summary EDA Statistics for Participant P35 for Search Task Sessions 1 and 2
Examination of the time series plot, Figure 1, provides further insight into the differences between the two search task sessions. In the first (large screen) session, the participant's EDA levels increased through most of the session, peaking right before the end of the session. This pattern of EDA levels over the course of the session might reflect increasing stress levels to find all of the landmarks prior to expiration of the 15-minute task time limit, and subsequent relief upon achievement of the goal. EDA levels continued to fall after the first search task session and stabilized near their lowest levels during the second (small screen) search task session, perhaps reflecting the relative ease in which the participant located the landmarks in the second session as compared to the first.
As shown in the sample data for a single participant, EDA measurements taken during use of large screen and small screen VR systems show considerable differences in mean EDA levels and associated variability between two search task sessions conducted with different VR screen size and scenes. In addition, time-series plots of the EDA data are particularly useful in portraying the dynamic evolution of these differences both within and between the search task sessions.
The addition of Q Sensors as a data source in this research provided a new way to examine users' psychophysical reactions to VR systems based on screen sizes. Adding qualitative information obtained by introducing participant interviewing further extended the range, depth and sophistication of possible analyses. By triangulating these data with more traditional data collected from the ITQ and PQ surveys and participant demographic information, the study's researchers are currently looking for patterns that might lead to greater insight regarding the effects and interactions of screen size and learner characteristics on the critical feature of presence in education environments that utilize VR technologies.
Based on the literature review presented here and reinforced by sample data from research currently being undertaken by the authors, this paper's working hypothesis regarding the value of EDA data and sensor technology is supported. Specifically, three conclusions can be drawn:
These three conclusions lead to the general conclusion that EDA data and sensor technology have considerable potential for new affective-response research in the field of educational technology. By combining EDA data with more traditional quantitative and qualitative data, educational technology researchers can study in more depth the emotional effects of emerging instructional technologies and their interactions with learners with differing characteristics and cultures.
Strong consideration should be given to using EDA sensors in educational technology research studies. Their low cost, ease of operation, and minimal invasiveness make them a useful tool to provide potentially valuable quantitative information. However, as shown above, the EDA results from some studies were inconclusive. Therefore, the EDA sensor should not be the only device used to measure the affective response of participants in a given context and subjected to specific stimuli in human behavior studies. It is recommended that at least two different but complementary methods be used when trying to collect data with an EDA sensor, where the EDA sensor is used in conjunction with more traditional techniques such as surveys
A second recommendation is to do more research on the use of EDA sensors. This includes conditions that have previously been studied but where the results have been inconclusive to better understand the limitations of the technique. It also includes using EDA sensors under new conditions that have not been previously studied to determine the full range of applicability of the technique.