Item analysis of Multiple Choice Questions (MCQs) is the process of collecting, summarizing and utilizing information from students' responses to evaluate the quality of test items. Difficulty Index (p-value), Discrimination Index (DI) and Distractor Efficiency (DE) are the parameters which help to evaluate the quality of MCQs used in an examination. This study has been postulated to investigate the relationship of items having good p-value and DI with their DE and their utility to frame 'ideal questions'. This study further evaluates the MCQs as a tool of assessment so as to improve the curricula in Medical Education. In this study, 20 test items of ‘Type A’ MCQ tests of assessment were selected. The p-values, DI and DE were estimated. The relationship between the p-value and DI for each test item was determined by Pearson correlation analysis. Mean p-value and DI of the test were 66.53 ± 16.82% and 0.41 ± 0.16% respectively. Only 20% of total test items crossed the p-value of 80% indicative of their easy difficulty level. 95% of the test items showed acceptable (> 0.2) DI. 12 out of 20 test items showed excellent DI (≥ 0.4). 8 (40%) test items were regarded as ‘ideal’ having p-value from 30- 70, and DI > 0.24. Correlation studies revealed that, DI associated with p-value (r = -0.288; P = 0.219). Mean DE of the test was 76.25 ± 22.18%. The DE was directly related to the DI. Items with good and excellent DI had DE of 66.67 ± 14.43% and 83.33 ± 19.46% respectively. In conclusion, an acceptable level of test difficulty and discrimination was maintained in the type A MCQ test. The test items with excellent discrimination tend to be in the moderately difficult range. There was a consistent spread of difficulty in type A MCQ items used for the test. Much more of these kinds of analysis should be carried out after each examination to identify the areas of potential weakness in the type A MCQ tests to improve the standard of assessment.
In multi-disciplinary integrated curriculum like medical education, Multiple Choice Questions (MCQs) are used mostly for comprehensive assessment at the end of a semester or academic sessions and provide feedback to the educators on their academic performance. Scheming MCQs is a multifarious and time consuming process as compared to the descriptive questions. After the assessment, a medical academician needs to know the effectiveness of the test questions in resounding students' learning related performance in the course. Because of versatility in the assessment, MCQs are one of the best and commonly used assessment tool to gauge the knowledge competencies of medical students. Appropriately, constructed MCQs evaluate higher-order cognitive processing of Bloom's taxonomy such as interpretation, synthesis and application of knowledge, more than just testing recall of isolated facts [1], [2].
Among the different types of MCQs used in the medical field, the most frequently used type is the single best response type (type A MCQ) with four choices [3]. These test questions were taken from the subject of Biochemistry. The examination questions had been formulated by the content experts who taught the respective syllabi and scrutinized by the senior academicians of the department. Item analysis is the process of assembling, summarizing and using information from students' responses to assess the quality of test items [4]. The item statistics can help to determine effective items and those that need improvement or omission from the question bank. It allows any aberrant items to be given attention and revised. One of the most widely used methods in investigating the reliability of a test item has been Classical Test theory (CT) item analysis [4], [5]. This type of item analysis essentially determines test homogeneity. The more similar are the items given in the test; the more likely they measure the same kind of intended aptitude and therefore attaining higher reliability.
In CT, item difficulty index (p-value), also called as “ease index” is the first item characteristic to be determined [5]. It is described as the percentage of the total group of students selecting the correct answer to that question. It ranges from 0 – 100%. The higher the percentage, the easier the item. The recommended range of difficulty is from 30 – 70%. Items with p-values <30% and above 70% are considered difficult and easy items respectively [2].
It is very obligatory, as the reliability of the tests to measure students' performance are often questioned due to nonconformity of item difficulty with the ability of the students. Very easy items should usually be placed either at the start of the test as 'warm-up' questions or removed altogether. The difficult items should be reviewed for possible perplexing language, areas of disagreement, or even an inappropriate key. Inclusion of very difficult items in the test depends upon the target of the teacher, who may want to include them in order to identify top scorers.
Along with difficulty index, item Discrimination Index (DI), also called as “point biserial correlation” is another important guide [4]. This provides information on the efficacy of the items in a given test to discriminate between students with higher and lower abilities [6].
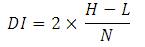
where, H and L are the number of correct responses in the high and low groups respectively. N is the total number of students in both high and low groups.
It ranges between -1.00 and +1.00. It is expected that, the high-scorers select the correct answer for each item more often than the low scorers. If this is true, the assessment is said to have a positive DI (between 0.00 and +1.00), indicating the total high scorers, chose the correct answer for a specific item more often than the overall low scorers. If, nevertheless, the low scorers got a specific item correct more often than the high scorers, then that item has a negative DI (between -1.00 and 0.00). Culpabilities in structuring test items logically affects the values of discrimination index. Items with poor discrimination ability should be inspected for potential deficiencies [5] .
The difficulty and discrimination indices are associated reciprocally. However, this may not always be true. Questions having high p-value (easier questions), discriminate poorly; conversely, questions with a low pvalue (harder questions) are considered to be good discriminators [7].
Another convincing technique is, analysis of distractors that provides information regarding the individual distractors and the key of a test item. Using these tools, the examiner is able to modify or remove specific items from subsequent exams [1]. The distractors are important components of an item, as they show a relationship between the total test score and the distractor chosen by the student. Students' performance depends upon how the distractors are designed [8]. Distractor Efficiency (DE) is one such tool that tells us whether the item was well constructed or failed to perform its purpose. Any distractor that has been selected by less than 5% of the students is considered to be a nonfunctioning distractor (NF-D) [1]. Distractor efficiency ranges from 0 - 100% and is determined on the basis of the number of NF-Ds in an item. Four NF-Ds: DE = 0%; 3 NF-Ds: DE = 25%; 2 NF-Ds: DE = 50%; 1 NF-D: DE = 75%; No NF-D: DE = 100%. Ideally, low-scoring students, who have not mastered the subject, should choose the distractors more often, whereas, high scorers should discard them more frequently while choosing the correct option. By analysing the distractors, it becomes easier to identify their errors, so that they may be revised, replaced, or removed.
Tarrent and Ware confirmed that, flawed MCQ items affected the performance of high-achieving students more than borderline students [9]. Construction of a balanced MCQ, therefore, addresses the concerns of the students of getting an acceptable average grade and that of the faculty to have an appropriate spread of the score [10].
Hence, the present research study was envisioned with an objective to analyze the quality of the MCQs (type A) used in the assessments of first year medical students in the preclinical phase and to test the quality of framed MCQs for the subsequent tests. The authors have aimed to find out the relationship between the item difficulty and item discrimination indices of these MCQs with their distractor efficiency and the effect of non-functioning distractors on these indices.
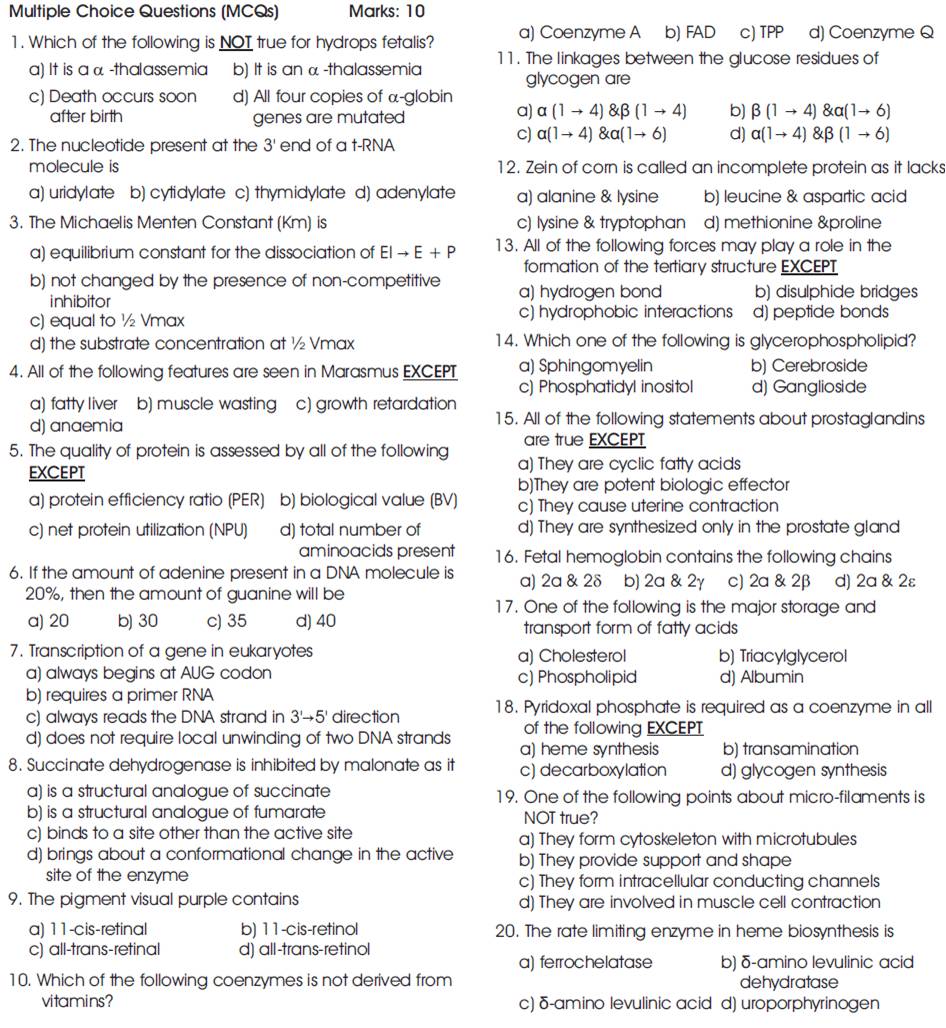
MCQs (given in Appendix ) were taken from the assessment test papers from the years 2010 – 2014 (each year having one cohort). Each of these examinations was held during the first six months of the preclinical phase and the test paper was based only upon the syllabus assigned for the examination. A total of 20 test items were selected for the item analysis. Each type A MCQ consisted of a stem and four choices and the students were to select one best answer from these four choices. A correct answer was awarded 1/2 mark and there were no negative marks for the incorrect answer.
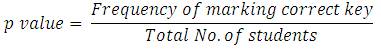
The result of the examinees' performance in the test was used to investigate the p-value, DI and DE of each MCQ item. The p-value of an item is calculated as the percentage of the total number of correct responses to the test item [11], [12]. It is calculated using the formula,

where P is the item difficulty index, R is the number of correct responses and T is the total number of responses (which includes both correct and incorrect responses). An item is considered difficult and easy when the difficulty index value is < 30% and > 70% respectively.
The item DI measures the difference between the percentages of students in the upper group with that of the lower group who obtained the correct responses. At first, top and bottom 27% of the total number (n) of students were counted [12], [13]. The total number of students who obtained the correct response in the Upper Group 27% (UG) and the Lower Group 27% (LG) was counted. The respective percentage of the number of students in upper group (PU) and lower group (PL) is calculated. The discrimination index was calculated using the formula, DI = PU - PL. The higher the discrimination index, better is the ability of the test item to discriminate between students with higher and lower test scores. Based on Ebel's (1972) guidelines on CT item analysis, items were categorized depending on their discrimination indices [4], [14]. The item with negative Discrimination Index (DI) was considered to be discarded; DI: 0.0 – 0.19: poor item: to be revised; DI: 0.20 – 0.29: acceptable; DI: 0.30 – 0.39: good;DI: ≥ 0.40: excellent.
All data were expressed as mean ± SD of the total number of items. The relationship between the item difficulty index and discrimination index for each test item was determined by Pearson correlation analysis using IBM SPSS 22. The correlation is considered significant at 0.01 level (2- tailed).
A total of 180 students appeared for the test consisting of 20 type A MCQs (single-best response MCQs). The mean score achieved was 6.65 ± 1.64 (maximum 10 marks). Mean scores according to groups were: lower 4.41 ± 0.73; middle 6.48 ± 0.75; upper 8.56 ± 0.56. Students were ranked in the order of merit from the highest score of 9.5 to the lowest score of 2.
Table 1 shows the categorization of the first 27% students (UG) and the last 27% (LG). The distribution of p-value and DI of the 20 MCQs is depicted in Table 2. The mean p-value of the test was found to be 66.53 ± 16.82% which indicates relatively easy test paper. Only 20% items (1/5th of 20 test items) in this study crossed the p-value of 80% as shown in Table 3 and Figure 1.
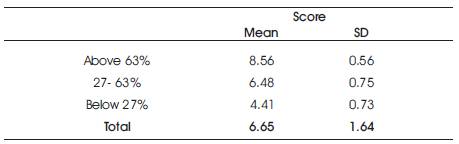
Table 1. Scores of Upper and Lower Performance Groups in the Test
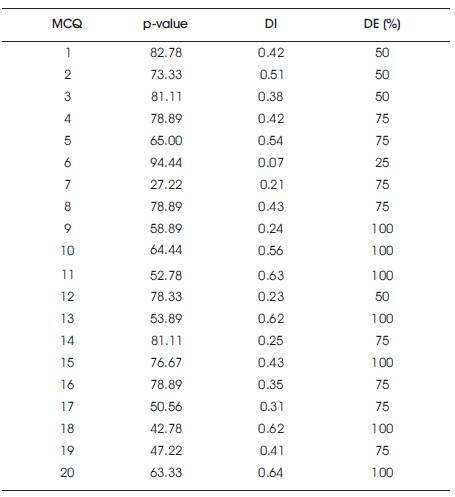
Table 2. Distribution of Difficulty Index (p-value), Discrimination Index (DI) and Distractor Efficiency (DE) of 20 MCQs in the tests
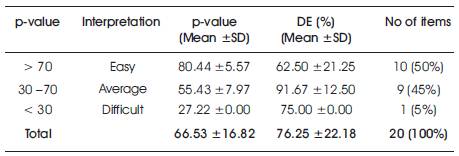
Table 3. Distribution of Difficulty Index (p-value) level in the tests and their Interpretation
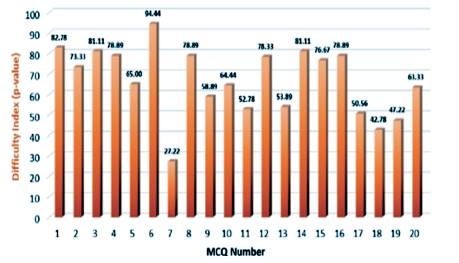
Figure 1. Difficulty Indices (p-Value) of MCQS
The mean DI of the test was 0.41 ± 0.16 demonstrating the acceptable discrimination quality. 19 (95%) test items were found with DI ≥ 0.2 discriminating good and weak students. 12 (60%) items showed excellent DI ≥ 0.4 as depicted in Table 4 and Figures 2 and3 depict DE of MCQs.
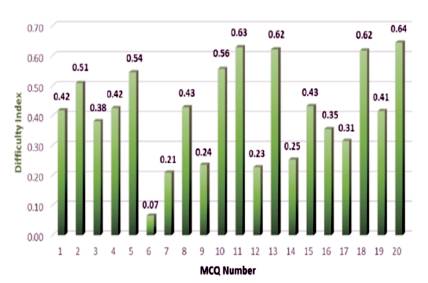
Figure 2. Discrimination Indices of MCQS
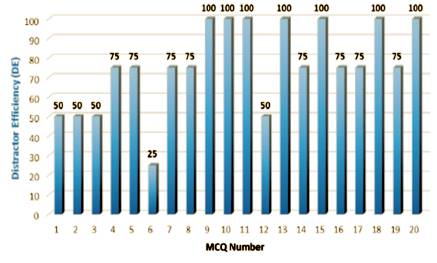
Figure 3.Distractor Efficiency of MCQS
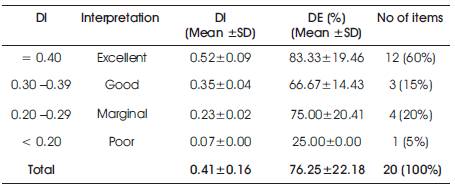
Table 4. Distribution of Discrimination Index (DI) in the tests and their Interpretation
Figure 4 (a) and 4 (b) reveals the correlation between individual item's p-value and DI score. 40% of the test items with DI< 0.4 had the p-value ranging between 27 – 95%. Out of 12 items with excellent DI (≥ 0.4), 58.33% had the pvalue between 50 – 80%. Correlation study between p-value and DI showed that DI correlated negatively with pvalue (r=-0.288; P= 0.219), but it was statistically insignificant. Negative correlation signifies that, with increasing p-values, there is decrease in DI. As the items get easy (above 75%), the level of DI decreases consistently.
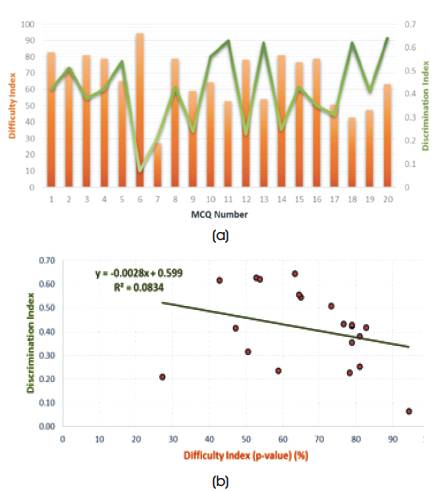
Figure 4. (a). Correlation of Difficulty Index with Discrimination, (b). Correlation of Difficulty Index with Discrimination (with trend)
Corresponding DE of 20 MCQs was also worked out, details of which are given in Tables 2 and 6. Two items having lowermost DIs, with item 6 being the easiest one (p = 94.44; DI = 0.07; DE = 25), and item 7, most difficult (p = 27.22; DI = 0.21; DE = 75). 45% items were of average (recommended) difficulty with a mean p-value of 55.43 ± 7.97%. Similarly, majority of items (60%) had excellent DI (0.52 ± 0.09), with few items with marginal (20%) and poor (5%) DI. This revealed that, 8 (40%) items were 'ideal' having a p-value from 30 – 70, and DI > 0.24, as evident from Table 5. The total number of distractors were 80 (4 per item).
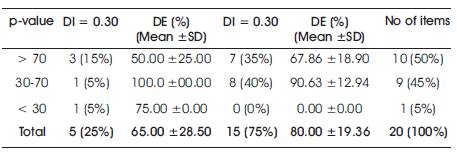
Table 5. Categorization of Difficulty Index (p-value) and Discrimination Index (DI) of 20 MCQs in the tests
Out of the 80 distractors, 19 (23.75%) were NF-Ds. 13 (65%) items had NF-Ds, while 7 (35%) items had effective distracters.
Table 6 explains that, items with 3 NF-Ds had high p-value (94.44%) and poor DI (0.07), whereas items with 2, 1 and no NF-Ds had recommended p-values 78.89 ± 4.13, 63.47 ± 19.90 and 58.97 ± 10.71, and excellent DI 0.39 ± 0.12, 0.37 ± 0.11 and 0.53 ± 0.15 respectively.
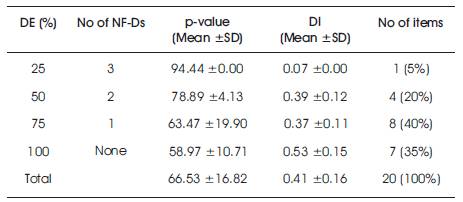
Table 6. Distribution of Distractor Efficiency (DE) in the tests and Non-functional Distractors (NF-Ds)
Figure 5 shows that, DE varies indirectly with the p-value, with most difficult items having DE of 75.00% and easy items having DE 62.50 ± 21.25%. Items with average difficulty had DE of 91.67 ± 12.50%. Figure 6 reveals that, DE is directly related to the DI. Items with good and excellent DI had DE of 66.67 ± 14.43% and 83.33 ± 19.46% respectively.
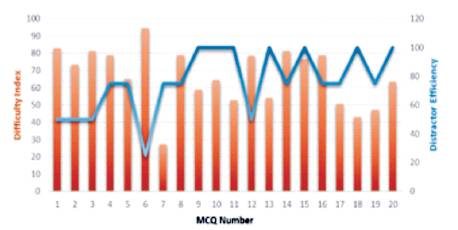
Figure 5. Correlation of Difficulty Index with Distractar Efficiency
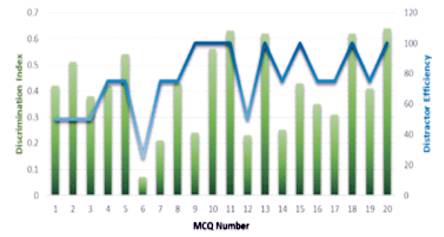
Figure 6. Correlation of Discrimination Index with Distractor Efficiency
Distractor analysis gives an opportunity to study the responses made by the students on each alternative of the item. The analysis of 5 questions selected on the basis of pvalue and DI gave a varied result.
The MCQ No. 6 was a very easy question (p-value = 94.44%) with lowest DI (0.07), as both upper and lower groups selected, nearly equally, the correct answer. The DE was 25% and 94.44% students selected the correct response, making the rest of the alternatives useless.
The MCQ No. 7 was selected for its lowest p-value (27.22%) making it the most difficult item with more of the higher group choosing the correct response, but paradoxically the DI was poor (0.21). The DE was 75% as the distractor alternative 'd' served no purpose at all, as hardly 5 students selected it, and distractor alternative ‘b’ was so effective that 88 students selected it, made it most difficult to choose even from the reduced number of choices. Distractor alternative 'b' was considered the right answer by many students both in the upper & lower groups and needs to be revised to discriminate properly from the correct choice.
MCQ No. 13 had a p-value of 53.89, DI of 0.62, and DE of 100%, showing that, it was moderately difficult and being able to differentiate students into different strata. From the upper group, 85.19% students selected the correct response 'c', while 76.92% students of the lower group were distributed among all the distractor choices.
MCQ No. 18 (DI = 0.62) was an excellent discriminatory and of average difficulty level (p-value = 42.78%), as 80% of the students in the upper group chose the correct alternative 'd' and 82% students in the lower group chose the distractors. This question had DE of 100% as the distractors were not clear to many students, making it a very difficult item.
MCQ No. 20 (DI = 0.64) was another excellent discriminatory with DE of 100% and of average difficulty level (p-value = 63.33%), as 93% of the students in the upper group chose the correct alternative 'c' and 28% students in the lower group chose the same correct alternative.
The assessment tool is one of the strategies which should be designed according to the objective, to strategize the assessment tool. One-best response MCQs, if properly written and well-constructed, are one of the strategies of the assessment tool that quickly assess any level of cognition according to Bloom's taxonomy [1].
The mean difficulty index scores of the test was 66.53 ± 16.82%. Only 50% of the total test items had difficulty index scores crossing 70%. This observation was similar to a study in a medical school reported by Sim Si-Mui and Rasiah (2006), who found that, about 40% of the MCQ items crossed difficulty index 70% showing that, the test items were easy for the examinees [12]. Brown (1983) and Algina (1986) have reported that, any DI of 0.2 or higher is acceptable and the test item would be able to differentiate between the weak and good students [15] , [16]. In the present study, 95% of the MCQs from the test had DI of more than 0.2. Thus it showed that, most of the MCQs were good or satisfactory questions which would not need any modifications or editing. 12 of the 20 items showed DI equal to or more than 0.4, indicating that, these MCQ items were excellent test items for differentiating between poor and good performers.
Negative correlation between difficulty and discrimination indices indicated that, with increase in difficulty index, there is decrease in discrimination index. As the test items get easier, the discrimination index decreases, thus it fails to differentiate weak and good students. Sim Si-Mui and Rasiah (2006) established that, maximum discrimination occurred with difficulty index between 40 – 74% [12]. In the present study, 76.9% of the test items with difficulty index between 50% and 79% had excellent discrimination index.
For calculation of the DI, the method adopted by Kelley (1939) was used in which upper and lower 27% performers were selected [13]. The only limitation of this test is that it cannot be used for a smaller sample size. But in this study, the sample size was 180 and hence the observed results truly reflect the discriminative power of the test items. One inadequacy of only analysing a question in terms of its difficulty index is the inability to differentiate between students of widely differing abilities. Subjective judgment of item difficulty by item writer and the vetting committee may allow faulty items to be selected in the item bank. Items with poor discrimination index and too low or too high difficulty index should be reviewed by the respective content experts [17]. This serves as an effective feedback to the respective departments in a medical college about the quality control of various tests. When the difficulty index is very small, indicating difficult question, it may be that, the test item is not taught well or is difficult for the students to grasp. It also may indicate that, the topic tested is inappropriate at that level for the students [18] .
In the scatter plot, there is a wide variation in the DIs with similar levels of difficulty index below 75%. Guessing practices by the students might have caused the wide variation in DIs, as the negative marking scheme is presently not implemented in MCQ tests. An acceptable level of test difficulty and discrimination indices appears to be maintained the test. This observation could be due to the fact that the test items went through a series of screening before being selected for the examinations. The quality of test items may be further improved based on action taken in reviewing the distractors by the item writer based on the calculated discrimination and difficulty index values. Few common causes for the poor discrimination are ambiguous wording, grey areas of opinion, wrong keys and areas of controversy [19]. Items showing poor discrimination should be referred back to the content experts for revision to improve the standard of these test items. It is important to evaluate the test items to see their efficiency in assessing the knowledge of the students based on the difficulty and discrimination indices of the test items.
A distractor used by less than 5% of students is not an effective distractor and should be either replaced or corrected as it affects the overall quality of the question. An NF-D makes the question easier to answer, thereby affecting the assessment of the student. Items having NF-D can be carefully reviewed. With some alterations in the distractors, can be given as the initial item on the test, as a 'warm-up' question. However, they would not be able to differentiate among students, if that is the purpose. Assessment of MCQs by these indices highlights the importance of assessment tools for the benefit of both the student and the teacher [20].
The DE of difficult items in our study was 75% – 100% which was expected, as difficult items would require a lot of guesswork on the part of the student, thereby using all the distractors. The numbers of NF-Ds also affect the discriminative power of an item. It is seen that reducing the number of distractors from four to three decreases the difficulty index, while increasing the DI and the reliability [21].
We observed that, items having all four functioning distractors had excellent discriminating ability (DI = 0.53 ± 0.15) as compared to items with any number of NF-Ds. This contradicts other studies favoring better discrimination by three distractors as compared to four [22].
It was also observed that, items having good/average difficulty index (p-value = 30 – 70) and good/excellent DI (> 0.24), considered to be 'ideal' questions, had DE of 90.63 ± 12.94%, which is close to items having no NF-D.
Tarrant and Ware found three-option items performing equally well as four-option items and have suggested to write three-option items as they require less time to be developed [23]. Similar observations were made by literature review conducted by Vyas et. al [24]. This can be because, writing items with four distractors is a difficult task and while writing the fourth distractor, we are mostly trying to fill the gap, allowing it to become the weakest distractor.
Results from this study clearly highlighted the importance of item analysis of MCQs. Items having average difficulty and high discrimination with functioning distractors should be incorporated into future tests to improve the test development and review. This would also improve the overall test score and properly discriminate among the students.
There was a consistent spread of difficulty in type A MCQ items used for the test. The test items that demonstrated excellent discrimination tend to be in the moderately difficult range. Items with all functional distractors performed best in discriminating among the students. Factors other than the difficulty, like the faulty test item constructions, are not significant at the test. The results of this study should initiate a change in the way MCQ test items are selected for any examination and there should be a proper assessment strategy as part of the curriculum development in medical education. These kinds of analysis should be carried out after each examination to identify the areas of potential weakness in the type A MCQ tests to improve the standard of assessment.