Table 1. A Sample 3 × 3 Table of Statistically Significant Qualitative Tri2Test Outcomes
This monograph provides an epistemological rational for the design of an advanced novel analysis metric. The metric is designed to analyze the outcomes of the Tri–Squared Test. This methodology is referred to as: “Tri–Squared Mean Cross Comparative Analysis” (given the acronym TSMCCA). Tri–Squared Mean Cross Comparative Analysis involves the computation and in–depth study of means extracted from an initial Tri–Squared Test. The Tri–Squared Test had an established level of statistical significance that provided the grounds for further Post Hoc investigation. The TSMCCA statistic is an Advanced Post Hoc test of the transformative process of qualitative data into quantitative outcomes through the Tri–Squared Test first introduced in the i-managers Journal on Mathematics. Advanced statistical analytics are involved in the TSMCCA mathematical model that allows for critical analysis of mean scores on item results. This type of in–depth post hoc statistical analysis permits a higher level of Tri–Squared meta–analytical investigative inquiry.
The foundational idea of a “Trichotomy” has a detailed long history that is based in discussions surrounding higher cognition, general thought, and descriptions of intellect. Philosopher Immanuel Kant adapted the Thomistic acts of intellect in his trichotomy of higher cognition that are (a) understanding, (b) judgment, (c) reason which are the correlated with his adaptation in the soul's capacities are as follows (a) cognitive faculties, (b) feeling of pleasure or displeasure, and (c) faculty of desire (Kant, 2007).The Total Transformative Trichotomous–Squared Test provides a methodology for the transformation of the outcomes from qualitative research into measurable quantitative values that are used to test the validity of hypotheses. The advantage of this research procedure is that it is a comprehensive holistic testing methodology that is designed to be static way of holistically measuring categorical variables directly applicable to educational and social behavioral environments where the established methods of pure experimental designs are easily violated. The unchanging base of the Tri–Squared Test is the 3 × 3 Table based on Trichotomous Categorical Variables and Trichotomous Outcome Variables. The emphasis of the three distinctive variables provide a rigorous robustness to the test that yields enough outcomes to determine if differences truly exist in the environment in which the research takes place (Osler, 2013a).
Tri–Square or Tri–Squared comprehensively stands for “The Total Transformative Trichotomous–Squared Test” (or “Trichotomy–Squared”). It provides a methodology for the transformation of the outcomes from qualitative research into measurable quantitative values that are used to test the validity of hypotheses. It is based on the mathematical “Law of Trichotomy”. In terms of mathematics, Apostol defined “The Law of Tricohotomy” as: Every real number is negative, 0, or positive. The law is sometimes stated as “For arbitrary real numbers a and b, exactly one of the relations a < b, a="b, and "> a < b holds” (Apostol, 1967). It is important to note that in mathematics, the law (or axiom) of trichotomy is most commonly the statement that for any (real) numbers x and y, exactly one of the following relations holds. Until the end of the 19th century the law of trichotomy was tacitly assumed true without having been thoroughly examined (Singh, 1997). Trichotomous relations in this sense are irreflexive and antisymmetric (Sensagent, 2012).
Tri–Squared is grounded in the combination of the application of the research two mathematical pioneers and the author's research in the basic two dimensional foundational approaches that ground further explorations into a three dimensional Instructional Design (Osler, 2012b). The aforementioned research includes the original dissertation of optical pioneer Ernst Abbe who derived the distribution that would later become known as the chi square distribution and the original research of mathematician Auguste Bravais who pioneered the initial mathematical formula for correlation in his research on observational errors. The Tri–Squared research procedure uses an innovative series of mathematical formulae that following as a comprehensive whole: (1) Convert qualitative data into quantitative data; (2) Analyze inputted trichotomous qualitative outcomes; (3) Transform inputted trichotomous qualitative outcomes into outputted quantitative outcomes; and (4) Create a standalone distribution for the analysis possible outcomes and to establish an effective––research effect size and sample size with an associated alpha level to test the validity of an established research hypothesis (Osler, 2012a).
The process of designing instruments for the purposes of assessment and evaluation is called “Psychometrics”. Psychometrics is broadly defined as the science of psychological assessment (Rust &Golombok, 1989).The Tri–Squared Test pioneered by the author, factors into the research design a unique event–based “Inventive Investigative Instrument” (Osler, 2013b). This is the core of the Trichotomous–Squared Test. The entire procedure is grounded in the qualitative outcomes that are inputted as Trichotomous Categorical Variables based on the Inventive Investigative Instrument (Osler, 2013c). Osler (2012a) initially defined the Tri–Squared mathematical formula in the i-managers Journal on Mathematics article entitled, “Trichotomy– Squared – A novel mixed methods test and research procedure designed to analyze, transform, and compare qualitative and quantitative data for education scientists who are administrators, practitioners, teachers, and technologists” is written as follows:
Tri2 = TSum[(Trix – Triy)2: Triy]
Table 1 illustrates the Tri2 Mathematical Model Illustrated in Tabular Format.
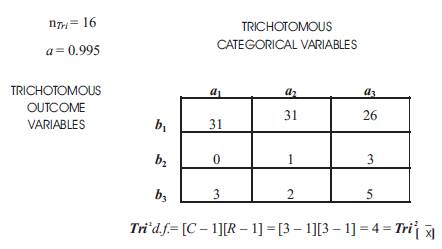
Sample data reported and analyzed Using the Trichotomous–Squared Standard 3x3 Table designed to analyze the research questions from an Inventive Investigative Instrument with the following Trichotomous Categorical Variables: a1; a2; and a3. The 3 × 3 Table has the following Trichotomous Outcome Variables: b1; b2; and b3. The Sample Inputted Qualitative Outcomes are reported as follows:
The Tri–Square Test Formula to Determine the Validity of the Research Hypothesis is:
Tri2 = TSum[(Trix – Triy)2: Triy]
Tri2 Critical Value Table = 0.207 (with d.f. = 4 at α = 0.995). For d.f. = 4, the Critical Value for p > 0.995 is 0.207. The calculated Tri–Square value is 5.468, thus, the null hypothesis (H0) is rejected by virtue of the hypothesis test which yields the following: Tri–Squared Critical Value of 0.207 < 5.468 the Calculated Tri–Squared Value. The 3 × 3 Table above was calculated via the tabulation of the 3 × 3 Table that immediately follows and is illustrated in Table Two.
Table 3 follows and illustrates the Tri2 Mean Cross Comparative Analysis Mathematical Model Illustrated in Tabular Format.
The Tri–Squared Test Mean Formulae for the Comparison of Within and Across Table Outcomes have the following 3 x 3 Tri–Squared Table Structure
Table 4 follows and displays the complete series of means that belong to Tri2 Mean Cross Comparative Analysis (in the Standard 3 × 3 Tri–Squared Table in a cell by cell format). Each of the means is determined through a series of sequential calculations that are explained in detail in the summative narrative that follows the Table.
Thus, the aforementioned 3 × 3 Tri–Squared Mean Table is equal to the following 3 × 3 Tri–Squared Table:
Table 1. A Sample 3 × 3 Table of Statistically Significant Qualitative Tri2Test Outcomes
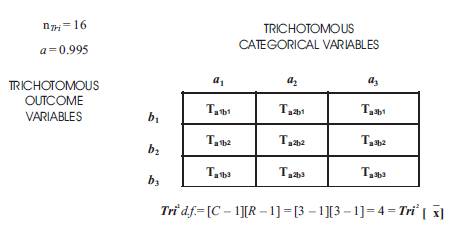
Table 2. Tri–Squared Test 3 × 3 Table Calculations:Explaining How the Tri2Statistical Mathematical Model is Constructed Displaying
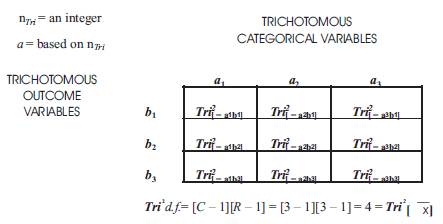
Table 3. Post HocTri2Test Calculations:Explaining How the Tri2Mean Cross Comparative Analysis [TSMCCA] Statistical 3 × 3 Table Mathematical Model is Derived
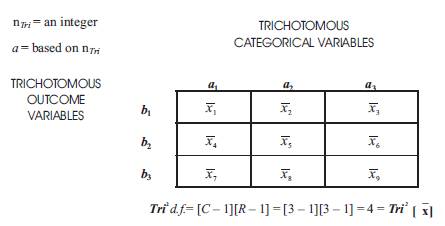
Table 4. Displaying How Tri2 Mean Cross Comparative Analysis 3 × 3 Table Means are Displayed
The Tri–Squared Mean Table having the sequential series of mathematical equation applies in the “Tri–Squared Cell Mean Mathematical Equation” written as: Tri2[Cell ] = Ta1b1 ⋅ [nTri]–1=An Individual 3 × 3 Table Cell Mean. There are an overall total of fifteen comparisons in Tri–Squared Mean Cross Comparative Analysis. They are mathematically written as follows:
1.) 3 × 3 Table Cell One:Tri2[ = a1b1] = Ta1b1 ⋅ [nTri]–1= Ta1b1 ÷ nTri = Table 1 Cell Total over Total Number of Participants =`x1, Thus, 31 ⋅ [16]–1 = 1.9375 for 1`x1;
2.)3 × 3 Table Cell Two:Tri2[= a2b1] = Ta2b1 ⋅ [nTri]–1= Ta2b1 ÷ nTri = Table 2 Cell Total over Total Number of Participants =`x2, Thus, 31 ⋅ [16]–1 = 1.9375 for`x2;
3.)3 × 3 Table Cell Three:Tri2[= a3b1] = Ta3b1 ⋅ [nTri]–1= Ta3b1 ÷ nTri = Table 3 Cell Total over Total Number of Participants =`x3, Thus, 26 ⋅ [16]–1 = 1.625 for;`x3
4.)3 × 3 Table Cell Four:Tri2[= a1b2] = Ta1b2 ⋅ [nTri]–1= Ta1b2 ÷ nTri = Table 4 Cell Total over Total Number of Participants =`x4,Thus, 0 ⋅ [16]–1 = 0.00 for;`x4
5.)3 × 3 Table Cell Five:Tri2[= a3b1] = Ta3b1 ⋅ [nTri]–1= Ta3b1 ÷ nTri = Table 5 Cell Total over Total Number of Participants =`x5,Thus, 0 ⋅ [16]–1 = 0.00 for;`x5
6.)3 × 3 Table Cell Six:Tri2[= a3b1] = Ta3b1 ⋅ [nTri]–1= Ta3b1 ÷ nTri = Table 6 Cell Total over Total Number of Participants =`x6,Thus, 0 ⋅ [16]–1 = 0.00 for;`x6
7.)3 × 3 Table Cell Seven:Tri2[= a3b1] = Ta3b1 ⋅ [nTri]–1= Ta3b1 ÷ nTri = Table 7 Cell Total over Total Number of Participants =`x7,Thus, 0 ⋅ [16]–1 = 0.00 for;`x7
8.)3 × 3 Table Cell Eight:Tri2[= a3b1] = Ta3b1 ⋅ [nTri]–1= Ta3b1 ÷ nTri = Table 8 Cell Total over Total Number of Participants =`x8,Thus, 0 ⋅ [16]–1 = 0.00 for;`x8 and
9.)3 × 3 Table Cell Nine:Tri2[= a3b1] = Ta3b1 ⋅ [nTri]–1= Ta3b1 ÷ nTri = Table 9 Cell Total over Total Number of Participants =`x9,Thus, 0 ⋅ [16]–1 = 0.00 for;`x9.
The Tri–Squared Mean Cross Comparative Analysis 3 × 3 Table is the mathematical form of TSMCCA [i.e., “Tri2[]CCA”]. It is designed to analyze within column and across row tabular Tri–Squared means via a one–to–one ratio comparison of each individual cell mean extracted from the initial significant Tri–Squared Test item responses (which were tabulated based upon the initial research investigation Trichotomous Categorical and Outcome Variables).The careful and meticulous one–to–one ratio comparisons will yield a final cumulative arry determination of an overall“Trichotomous Mean Comparative Outcome” for each of the 3 × 3 Tri–Squared Table cell means. All of the mean comparisons will be determined to be either “equal to” [=], “greater than” [>], or “less than”[<]. Table 5 follows and exhibits in the Standard of 3 × 3 Tri–Squared Table and Tri–Squared Cross Comparative Analysis Procedural Array Models for within and down (or columnar) 3 × 3 Tri–Square cell mean comparisons.
The 3 × 3 Tri–Squared Across Cell Mean Array Comparisons is equal to the following “Within” 3 × 3 Tri–Squared Array for Trichotomous Categorical and Outcome Variables:
Table 6 follows and presents the 3 × 3 Tri–Squared between and across (or row and diagonal)cell mean array comparisons.
The 3 × 3 Tri–Squared Across(Row and Diagonal)Cell Mean Array Comparisons is equal to the following “Between” 3 × 3 Tri–Squared Array for Trichotomous Categorical and Outcome Variables
The 3 × 3 Tri–Squared Across(Row and Diagonal)Cell Mean Array Comparisons is equal to the following “Between” 3 × 3 Tri–Squared Array for Trichotomous Categorical and Outcome Variables
The fifteen comparisons in Tri–Squared Mean Cross Comparative Analysis are mathematically defined and written in The Tri–Squared Mean Cross Comparative Analysis: Comparative Mean Outcome Array. The Array is a matrix of cross comparative mean outcomes. Table 7 follows and displays the Tri–Squared Mean cross comparative analysis comparative mean outcome array in a tabular format(entitled,The Tri–Squared Mean Cross Comparative Analysis [Tri2[`x]CCA] Comparative Mean Outcome Array”).
Table 7 defines the Advanced Tri–Squared Post Hoc Data Analysis methodology.
The Tri–Squared Comparative Mean Outcome Array uses the “v” sign/symbol (named “versus” in this statistic) to mean “in comparison to”. The “v” is used in mathematical logic to indicate symbol as the “logical sum with” or “logical or”. It is also known as the “logical disjunction” symbol meaning “a proposition that presents two or more (in this case three: equals “=”, greater than “>”, or less than “<”) alternative terms, with the assertion that only one is true”. The right longitudinal arrow sign “⟶” is used to indicate “yields”. Thus, the first comparison “ x1 x4 ⟶ x1* x4 “ literally states the following: “The 3 x 3 Table First Cell Mean in comparison to the Fourth Cell yields the following outcome”. Table 8 follows and shows the Sample Tri–Squared Mean Cross Comparative Analysis assessment in the Standard 3 × 3 Tri-Squared tabular format using sample data.
The following example exhibits the Tri–Squared Mean Cross Comparative Analysis using the sample data provided earlier. The data below was analyzed using the Trichotomous–Squared 3x3 Table designed to analyze the research questions from an Inventive Investigative Instrument with the following Trichotomous Categorical Variables: a1, a2, and a3. The 3 × 3 Table has the following Trichotomous Outcome Variables: b1, b2, and b3. The Inputted Qualitative Outcomes are reported as follows:
Table 8 displays the results of the cell by cell means of research participant responses on a Tri–Squared Mean Table. This Table is the first step in the Advanced Tri–Squared Post Hoc Data Analysis methodology entitled “The Tri–Squared Mean Cross Comparative Analysis: [Tri2[]CCA]”. The Tri–Squared Mean Table yields the following results:
1.)3 × 3 Table Cell One: Tri2[ x= a1b1] = Ta1b1⋅ [nTri]–1 = x1= 1.9375;
2.) 3 × 3 Table Cell Two: Tri2[x= a2b1] = Ta2b1 ⋅ [nTri]–1 = x2= 1.9375;
3.) 3 × 3 Table Cell Three: Tri2[x= a3b1] = Ta3b1 ⋅ [nTri]–1 = x3= 1.625;
4.) 3 × 3 Table Cell Four: Tri2[x= a1b2] = Ta1b2 ⋅ [nTri]–1 = x4= 0.00;
5.) 3 × 3 Table Cell Five: Tri2[x= a2b2] = Ta2b2 ⋅ [nTri]–1 = x5= 0.625;
6.) 3 × 3 Table Cell Six: Tri2[x= a2b3] = Ta2b3 ⋅ [nTri]–1 = x6= 0.1875;
7.) 3 × 3 Table Cell Seven: Tri2[x= a3b1] = Ta3b1 ⋅ [nTri]–1 = x7= 0.1875;
8.) 3 × 3 Table Cell Eight: Tri2[x= a3b2] = Ta3b2⋅ [nTri]–1 = x8= 0.125;
and
9.) 3 × 3 Table Cell Nine: Tri2[x= a3b3] = Ta3b3 ⋅ [nTri]–1 = x9= 0.3125.
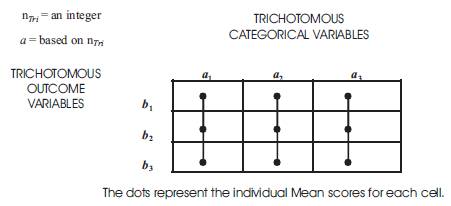
Table 5. The Tri–Squared Cross Comparative Analysis Procedural Array TabularModels For Within and Down (or Columnar) 3 × 3 Tri–Square Cell Mean Comparisons
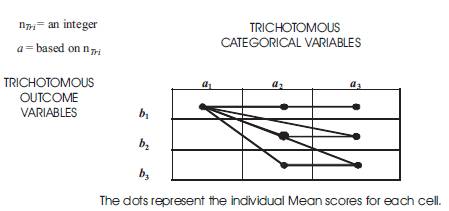
Table 6. The Tri–Squared Cross Comparative Analysis Procedural Array Tabular Models For Between and Across (or Row and Diagonal) 3 × 3 Tri–Square Cell Mean Comparisons
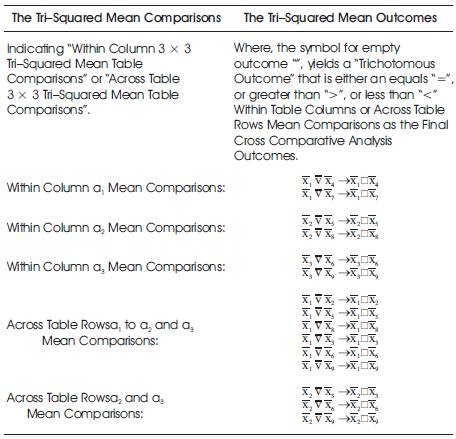
Table 7. Tri–Squared Mean Cross Comparative Analysis Comparative Mean Outcome Array
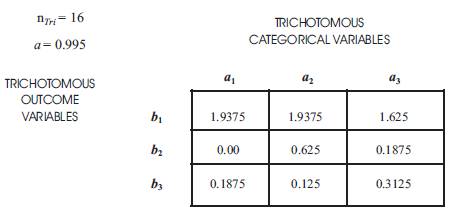
Table 8. The Sample Data Tri–Squared Mean Cross Comparative Analysis Assessment Tri–Squared MeanTable of Outputted Outcomes of the Tri–Squared Test
This Tri–Squared Mean Table shows that the greatest mean was in the first two Table cells (a1b1=a2b1[x1=x2] (which are cells one and two respectively for the research data 3 x 3 Tri–Squared Test Table) are indicative of respondents positive results on two Investigative Instrument items. These results indicate that the majority of “Yes” responses were positively directed towards the belief that the Academic Camp holistically aided the participants in terms of interpersonal development and that the Academic Camp holistically aided the participants in terms of interpersonal development. This clearly illustrates the vast majority of respondents primarily agreed that the Camp was very effective in terms of personal and school development. Table 8 also provides additional information on the second highest response rate which belonged to third Table cell with a mean of 1.625. This was also a positive or “Yes” response to the question: “Did the Academic Camp holistically aid the participant in terms of social development?” The majority of the participants agreed with this question deeming the Camp highly effective in aiding them with peer interaction. Table 9 displays the calculated Tri–Squared Test Mean Comparisons using sample data. The calculated sample data revealed the subsequent Mean Comparisons as detailed 3 x 3 Tri–Squared mean outcomes of a sample research investigation. The results of the sample data Mean Comparisons are accurately illustrated in following Table 9: Tri–Squared Mean Cross Comparative Analysis [Tri2[]CCA] Comparative Mean Outcome Array.
Table 10 presents the numerical 3 × 3 Comparative Mean Table data(presented in a detailed data table to most accurately define, compare,and illustrate the sample dataoutcomes from the sample research investigation). Thus, the Tri–Squared Mean Cross Comparative Analytics [Tri2[]CCA] resulted in the following Comparative Mean Outcomes that appear in a precise numerical Mean Comparison Array in Table Ten in the following manner:
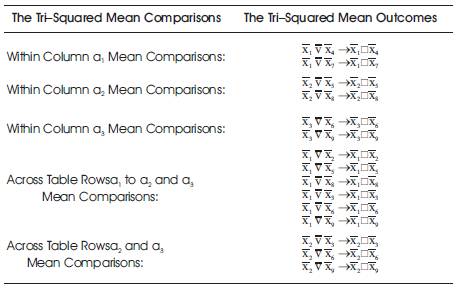
Table 9. Tri2 Mean Cross Comparative Analysis[Tri2[]CCA] Comparative Mean Outcome Array
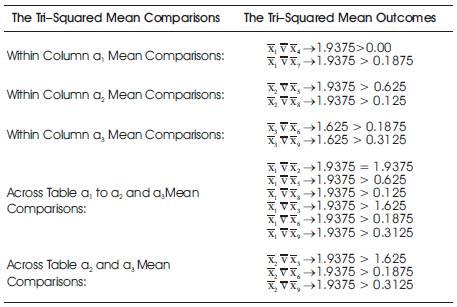
Table 10. Tri2 Mean Cross Comparative Analysis: Sample Data Comparative Mean Outcome Array
The Array displays the outputted “on average responses” by research participants to the items on the Tri–Squared Inventive Investigative Instrument that were represented in the respective Trichotomous Categorical and Outcome Variables. The sample research variables were analyzed using the Standard Trichotomous–Squared 3x3 Table designed to analyze the research questions from the Inventive Investigative Instrument with the following Trichotomous Categorical Variables: a1; a2; and a3. The 3 × 3 Table also has the following Trichotomous Outcome Variables: b1; b2; and b3. The Comparative Arrays show that the greatest mean equality was determined to be a1b1 = a2b1 for (x1 v x2 ® 1.9375 = 1.9375) in cells one and two of the research data 3 × 3 Tri–Squared Test Table. This indicates that Trichotomous Categorical Variable “a1” responses had the highest response rate. This clearly illustrates that the vast majority of sample research respondents primarily agreed that “a1” was the predominant variable.
A Summative Assessment of the Sample Results of the Post Hoc Tri–Squared Mean Cross Comparative Analysis
The results of the sample Tri–Squared Test in this study provided the base for Post Hoc Tri–Squared Mean Cross Comparative Analysis (Analytics). The Mean Cross Comparative metrics were used as advanced statistical research measures to determine if the research the outcomes were valid following the delivery of an in–depth qualitative Inventive Investigative Instrument conducted by the researcher. The sample size of the sample research investigation was relatively small (nTri = 16) due to the innovative nature of the sample data treatment. As an advanced statistical measure, The Tri–Squared Mean Cross Comparative Analysis [Tri2[]CCA= TSMCCA] analyzed the difference in means between Trichotomous Categorical and Outcome Variables. The initial Tri–Squared statistical analysis rejected the null hypothesis via the Tri–Squared hypothesis test which yielded the following results: [The Tri–Squared Test Critical Value] = 0.207 < 5.468 = [The Calculated Tri–Squared Test Value]. Thus, there was enough evidence to reject H0 at p > 0.995 is 0.207. These results illustrate that there is a significant difference in the perceptions of the research participants regarding the sample data. The Tri–Squared Mean Cross Comparative Analysis yielded the following results: The greatest mean equality for a1b1 = a2b1 for (x1 v x2 ®1.9375 = 1.9375) in cells one and two of the research data 3 × 3 Tri–Squared Test Table. This indicates that an ““a1” response had the highest response rate out of all of the sample research data. This was followed by agreement by the participants that the second Trichotomous Categorical Variable had the second highest response rate. These results indicate that Tri–Squared Mean Cross Comparative Analysis is an efficient and effective form of in–depth Post Hoc analysis of Tri–Squared data. As a statistical analysis methodology, the Cross Comparative Analysis of Tri–Squared Means provides a deeper insight into item responses to Tri–Squared designed investigative research tools. Such a perspective sheds greater light on the inner workings of the Tri–Squared model and adds depth and breadth to the entire Tri–Squared research methodology.