Table 1. Tri–Squared Test 3 × 3 Table Calculations
This monograph provides an epistemological rational for the design of a novel post hoc statistical measure called “Tri–Center Analysis”. This new statistic is designed to analyze the post hoc outcomes of the Tri–Squared Test. In Tri–Center Analysis trichotomous parametric inferential parametric statistical measures are calculated from statistically significant Tri–Squared Test data. The Tri–Squared Test was first introduced in i-manager’s Journal on Mathematics as a qualitative to quantitative transformative mixed methods data analysis procedure. Tri–Center Analysis is an advanced statistical post hoc holomorphic that rigorously examines trichotomous investigative inquiry outcomes as in–depth parametric relations.
Tri–Center Analysis is a trichotomous parametric inferential statistical measurement procedure designed to analyze the outcomes of a statistically significant Tri–Squared Test. In this analysis metric, post hoc statistical calculations are conducted on Tri–Squared Test outcomes to determine their respective relations as an independent quantitative set of data. To determine the relative distances between trichotomous categorical and outcome variables the variables are mathematically changed into inferential data through a series of trichotomous calculations. Thus, Tri–Center Analysis is an advanced statistical post hoc holomorphic or a statistical analytic that is designed to meticulously and rigorously examine trichotomous investigative inquiry outcomes. These outcomes are treated as independent “within” parametric relations that are a standalone set of data. The Tri–Squared Test introduced in i-manager’s Journal on Mathematics transforms qualitative data to quantitative data for purposes of analysis through a transformative sequential mathematical data analysis procedure. This procedure is discussed in detail in the Background Information section that follows.
Tri–Square or Tri–Squared comprehensively stands for “The Total Transformative Trichotomous–Squared Test” (or “Trichotomy–Squared”). It provides a methodology for the transformation of the outcomes from qualitative research into measurable quantitative values that are used to test the validity of hypotheses. It is based on the mathematical “Law of Trichotomy”. In terms of mathematics, Apostol in his book on calculus defined “The Law of Tricohotomy” as: Every real number is negative, 0, or positive. The law is sometimes stated as “For arbitrary real numbers a and b, exactly one of the relations a < b, a=b, and a > b holds” (Apostol, 1967). It is important to note that in mathematics, the law (or axiom) of trichotomy is most commonly the statement that for any (real) numbers x and y, exactly one of the following relations holds. Until the end of the 19th century the law of trichotomy was tacitly assumed true without have been thoroughly examined (Singh, 1997). A proof was sought by Logicians and the law was indeed proved to be true. If applied to cardinal numbers, the law of trichotomy is equivalent to the axiom of choice. More generally, a binary relation R on X is trichotomous if for all x and y in X exactly one of xRy, yRx or x = y holds. If such a relation is also transitive it is a strict total order; this is a special case of a strict weak order. For example, in the case of three elements the relation R given by aRb, aRc, bRc is a strict total order, while the relation R given by the cyclic aRb, bRc, cRa is a non–transitive trichotomous relation. In the definition of an ordered integral domain or ordered field, the law of trichotomy is usually taken as more foundational than the law of total order, with y = 0, where 0 is the zero of the integral domain or field. In set theory, trichotomy is most commonly defined as a property that a binary relation < has when all its members < x, y > satisfy exactly one of the relations listed above. Strict inequality is an example of a trichotomous relation in this sense. Trichotomous relations in this sense are irreflexive and antisymmetric.
The foundational idea of a “Trichotomy” has a detailed long history that is based in discussions surrounding higher cognition, general thought, and descriptions of intellect. Philosopher Immanuel Kant adapted the thomistic acts of intellect in his trichotomy of higher cognition that are understanding, judgment, reason which are correlated with the adaptation. The soul's capacities are given by cognitive faculties, feeling of pleasure or displeasure, and faculty of desire (Kant, 2007). The total transformative trichotomous–squared test provides a methodology for the transformation of the outcomes from qualitative research into measurable quantitative values that are used to test the validity of hypotheses. The advantage of this research procedure is that it is a comprehensive holistic testing methodology that is designed to be static way of holistically measuring categorical variables directly applicable to educational and social behavioral environments where the established methods of pure experimental designs are easily violated. The unchanging base of the Tri–Squared Test is the 3 × 3 Table based on Trichotomous Categorical Variables and Trichotomous Outcome Variables. The emphasis of the three distinctive variables provide a thorough rigorous robustness to the test that yields enough outcomes to determine if differences truly exist in the environment in which the research takes place (Osler, 2013a).
Tri–Squared is grounded in the combination application research of two mathematical pioneers and the author's research is in the basic two dimensional foundational approaches that ground further explorations into a three dimensional Instructional Design (Osler, 2012b). The aforementioned research includes the original dissertation of optical pioneer Ernst Abbe who derived the distribution that would later become known as the chi square distribution and the original research of mathematician AugusteBravais who pioneered the initial mathematical formula for correlation in his research on observational errors. The Tri–Squared research procedure uses an innovative series of mathematical formulae that do the following as a comprehensive whole as follows-Convert qualitative data into quantitative data; Analyze inputted trichotomous qualitative outcomes; Transform inputted trichotomous qualitative outcomes into outputted quantitative outcomes; and Create a standalone distribution for the analysis of possible outcomes and to establish an effective research of effect size and sample size with an associated alpha level to test the validity of an established research hypothesis (Osler, 2012a).
The process of designing instruments for the purposes of assessment and evaluation is called “Psychometrics”. Psychometrics is broadly defined as the science of psychological assessment (Rust &Golombok, 1989). The Tri–Squared Test pioneered by the author, factors into the research design, a unique event–based “Inventive Investigative Instrument” (Osler, 2013b). This is the core of the Trichotomous–Squared Test. The entire procedure is grounded in the qualitative outcomes that are inputted as Trichotomous Categorical Variables based on the Inventive Investigative Instrument (Osler, 2013c). Osler (2012a) initially defined the Tri–Squared mathematical formula in the imanager’s Journal on Mathematics article entitled, “Trichotomy– Squared – A novel mixed methods test and research procedure designed to analyze, transform, and compare qualitative and quantitative data for education scientists who are administrators, practitioners, teachers, and technologists” as follows:Tri2 = Tsum [(Trix – Triy )2 : Triy ].
The primary objective of this exposition is to effectively explain the procedures used in the post hoc Tri–Center Analysis statistical methodology. Thus, the narrative that follows is sequentially organized in the following manner,
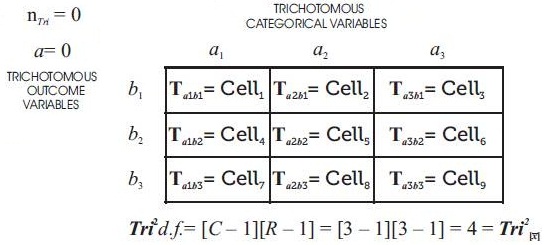
Table 1 follows and illustrates the Tri2 Mathematical Model Illustrated in Tabular Format.
Table 1. Tri–Squared Test 3 × 3 Table Calculations
Table 2 follows and illustrates the Tri2 test total calculations by cell, row, and column illustrated in tabular format.
The Table below is a Trichotomous squared standard three by three Table designed to analyze the research questions from an Inventive Investigative Instrument with the following Trichotomous categorical variables a1, a2 and a3 . The 3 × 3 Table has the following Trichotomous outcome variables: b1 , b2 and b3 . The sample total calculations are conducted as follows:
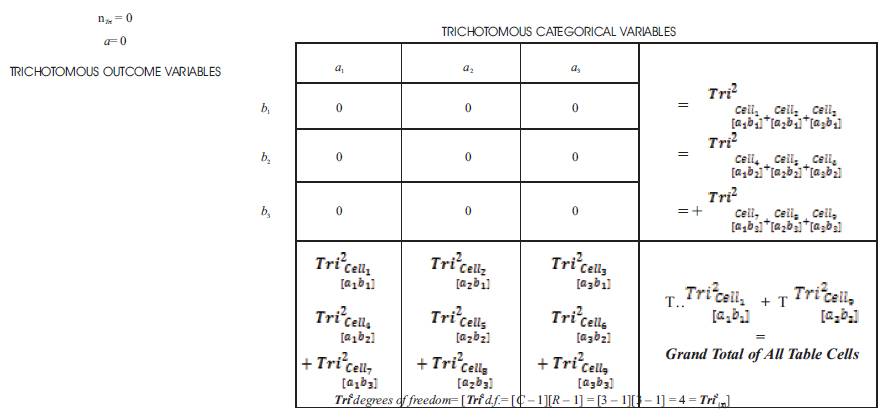
Table 2. A Tri 3 × 3 Standard Table of Statistically Significant Tri Test Total Calculationsby Cell, Row, and Column
The Basic Measures of Tri–Center Analysis are “The Tri–Squared Test Mean”,“The Tri–Squared Test Mode”; and “The Tri–Squared Test Median”. The calculations that follow are for the aforementioned basic Tri–Center measures and create the foundation for Tri–Center Analysis. They consist of the traditional statistical “measures of center” or “measures of central tendency”. They are represented in terms of Trichotomous relations in the following manner.
To calculate the spread and variation of Tri–Squared Test results, the researcher will need a set of mathematical conventions and specific Trichotomous statistical formulae which use those conventions to determine the Trichotomous Variance and Standard Deviation respectively
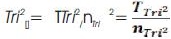
The following post hoc parametric calculations are trichotomous mathematical conventions. These conventions are designed to create a holistic series of sequential within group “Trichotomous Tri–Squared Test results”(derived from the Standard 3 × 3 Tri–Squared Table).The Mathematical Conventions of the Total Number Tri–Squared Table Cells[nTri2 ] are listed as follows:
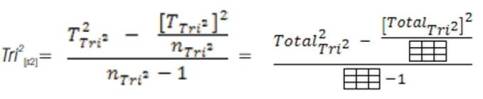
The mathematical conventions now allow specific mathematical formulae related to the Tri–Squared Test to be created and conducted that will yield the “Trichotomous Variance” =Tri2[s2] and “Trichotomous Standard Deviation” =Tri2[s] . These are the spread and variation of Tri–Squared Test results as trichotomous equations that are related to the parametric “Gaussian Distribution” or “Normal Curve”. These equations are unique to Tri–Center Analysis and are also sequential in nature. The equations are presented in the next series of statements.
The Tri–Center Equations Related to the “Tri–Squared [Gaussian] Normal Curve” as the “Tri – Squared Measures of Central Tendency: are listed as follows:
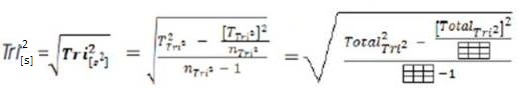
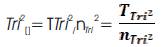
The elements and components that compose the“Tri–Squared Variance” and “Tri–Squared Standard Deviation” are explicatively defined and listed as follows:
The elements and components that construct the “Tri–Squared Gaussian Curve” (also called the “Tri–Squared Parametric Curve”,or the “Tri–Squared Normal Curve”) are listed and mathematically defined as follows:
 = The Tri–Squared Mean;
Once the aforesaid equations have been carefully examined, meticulously calculated, and judiciously applied, a detailed statistical graphical model may be constructed as illustrated in Figures 1 and 4 respectively.
Table 3 follows and illustrates how to conduct a Tri–Center Analysis using statistically significant sample data.
Sample data reported below was analyzed using the Trichotomous–Squared Standard Three by Three Table. The data was statistically significant and was collected based upon a Tri–Squared research investigation designed to analyze the research questions presented on an Inventive Investigative Instrument for the ‘SALA’ Summer Program that had the following Trichotomous Categorical Variables: a1 = [Did the Academic Camp holistically aid the participant in terms of interpersonal development?]; a2 = [Did the Academic Camp holistically aid the participant in terms of academic development?]; and a3 = [Did the Academic Camp holistically aid the participant in terms of social development?]. The 3 × 3 Table has the following Trichotomous Outcome Variables: b1 = Yes; b2 = No; and b3 = No Opinion. The Sample Total Calculations are conducted as follows:
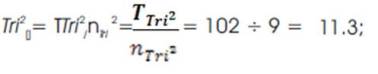
From Table 3 the Trichotomous measures of central tendency are determined via the following caluculations,
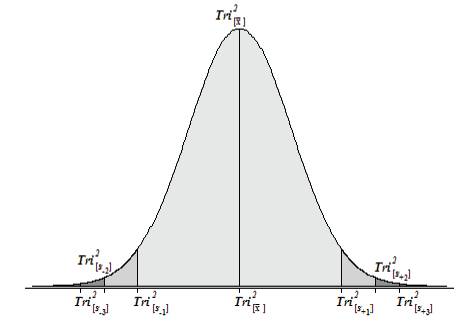
Figure 1. The Tri–Squared Normal Curve [or Tri–Squared Gaussian] Model
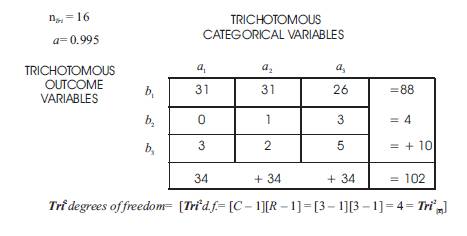
Table 3. Basic Measures of Tri–Center Analysis: The Tri–Squared Test Mean, Mode, and Median
The Tri–Squared Test Result data yielded two modes that are unequal (31 > 3) thereby creating a“Tri–Squared Test Results Bimodal Distribution”. Thus, the Sample Statistically Significant Tri–Squared Test Results as a distribution is Bimodal (with dual bimodal maxima of 31 and 3 respectively).There is a great deal of information that can be gleaned from observing the intricacies of this bimodal distribution. The larger mode (Tri2[Mo]2 = 31) is known as the major mode also called the “Acrophase”. The smaller mode (Tri2[Mo]1 = 3) is referred to as the minor mode, termed the “Batiphase”. The least frequent value between the modes is known as the “Antimode” (or Tri2[AMo] ). The Tri–Squared statistically significant data has dual antimodes (Tri2[AMo]1 = 5) and (Tri2[AMo]2 = 26). The difference between the major and minor modes is known as the amplitude. In the case of this data the amplitude between the acrophase and batiphase is very steep as 3 is much less than 31 (or 3 < 31). The Tri–Squared Test Results Bimodal Distribution of data has the following Visual Analytic Graph and Distribution illustrated in Figures 2 and 3 respectively.
All Tri–Center Analysis of Post Hoc Parametric Calculations are listed sequentially in the following list of Trichotomous Calculations. Note: nTri2 = 9, thus, the following can be applied to the series of sequential Tri–Center Analysis equations as given by,
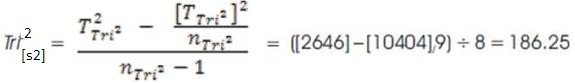

The Elements of Tri–Squared Standard Deviation are calculated as T2 Tri2 = 2646; [TTri 2]2 = 10404; and nTri2 – 1 = 8.
The Elements of the Tri–Squared [Gaussian] Normal Curve are determined as follows
Plotting and Interpreting Data on the Tri–Squared [Gaussian] Normal Curve follows using the statistically significant sample data and outcomes were provided in Figure 3 Note the Normal Curves that illustrate how and where normal distribution data is plotted as it is calculated from the 3 by 3 Tri–Squared Test Table as shown in Figure 4. Figure 5 illustrates the plotted Tri–Center Analysis Data Points on the Tri–Squared [Gaussian] Normal Curve for the statistically significant sample data.
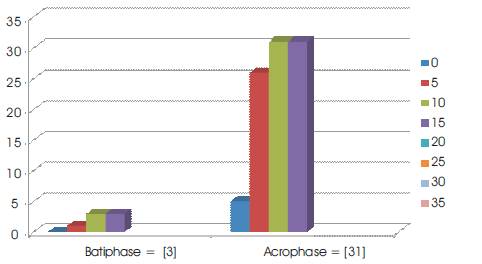
Figure 2. Visual Analysis of the Tri–Squared Bimodal Distribution of Statistically Significant Results
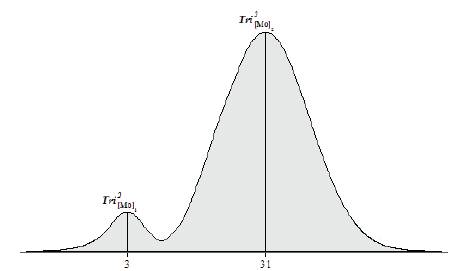
Figure 3. The Tri–Squared Bimodal Distribution Curve of the Statistically Significant Results
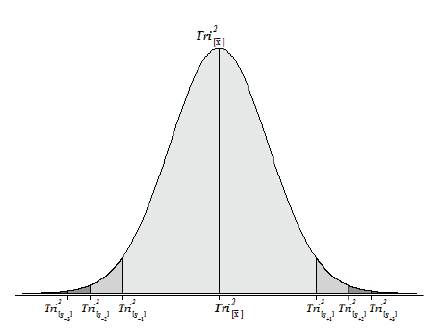
Figure 4. The Tri–Squared Normal Curve IndicatingWhere to Plot Calculated DataPoints
In Figure 5 the vast majority of the plotted Tri–Squared Test sample data (as analyzed through Tri–Center Analysis) falls between –1sd and +1sd= –2.32 and 24.98 which includes record Trichotomous Categorical and Outcome data reported as (0, 1, 2, 3, 3, and 5). This accounts for 2/3rds of the Tri–Squared Table 3 results. This is in tandem with the traditional Gaussian Normal Curve that has approximately 68% (from 34.1% + 34.1% = 68.2% rounded to 68%) of all scores falling between –1 and +1 standard deviations. The remaining statistically significant sample data can be found between +1sd and +2sd= 24.98 and 38.63 rd respectively. This accounts for the remaining 1/3rd of the Tri–Squared Table 3 results (26, 31, and 31). This is also in tandem with the traditional Gaussian Normal Curve that has approximately 14% (actually 13.6% rounded to 14%) of all scores falling between +1 and +2 standard deviations.
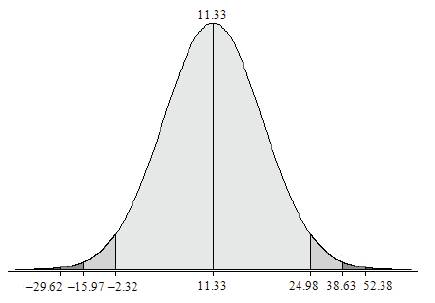
Figure 5. Tri–Squared [Gaussian] Normal Curve with Sample Data
The researcher lists the following recommendations regarding the Tri–Center Analysis post hoc research methodology as follows,
The Post Hoc use of Tri–Center Analysis on statistically significant Tri–Squared Test data provides a plausible statistical measure that allows investigators to interpret the in–depth and rich complexities of Tri–Squared research data. Initially the Tri–Squared Test is designed to transform qualitative data into quantitative data for specific purpose of examining Trichotomous Categorical and Outcome Variables. Tri–Center Analysis further transforms the quantitative data into measures of Tri–Central data that can be analyzed to determine the within differences of 3 × 3 Tri–Squared Test data as a holistic group. The observations based on measures of center, can be further interpreted and generalized. Through Tri–Center Analysis, the statistically significant data has a Post Hoc additional quantifiable form that can be advanced as a parametric norm–referenced data distribution. In this new form the data can then be analyzed using a z–score or a t–score (depending upon how the research investigator wishes to examine the data). Thus, Tri–Center Analysis allows for a more strict set of data analysis procedures (that are designed to obey the general conventions of traditional parametric statistics). It also removes any possible biases that may occur by applying purely subjective observations that do not rely on purely quantifiable data to determine differences in research outcomes.
Tri–Center Analysis is grounded in the “Gaussian Normal Distribution” (or “Parametric Normal Curve”). The “Normal Distribution” has the assumption that the data is symmetrical and can provide great functional utility to the process of analyzing “Post Hoc Tri–Squared Test outcomes”. In support of the use of the Normal Distribution as a post hoc “Tri–Squared Test Metric”, mathematical and statistical historians John Aldrich and Jeff Miller (2007) state that in statistical probability theory, that the “Normal (or Gaussian) Distribution” is a very common occurring continuous probability distribution. They further state that it is a function that tells the probability that an observation in some context will fall between any two real numbers (Aldrich and Miller, 2007). This is ideal for Tri–Center Analysis as it is designed to determine where Post Hoc Tri–Squared Test values fall in relation to one another. It also accurately describes the Tri–Center Analysis research methodology and data analysis process which is as follows: “In terms of statistically significant Tri–Squared Test outcomes, the distribution of values in the Tri–Squared 3 × 3 Table are based on a given set of Trichotomous Categorical and Outcome Variables administered to a selected sample size (determined at the research outset according to the established interval extracted from the “Tri–Squared Distribution Sample Size Table”) and can be plotted via Tri–Center Analysis on the “Gaussian Normal Curve” (i.e. “The Normal Distribution”). Aldrich and Miller (2014) also state that normal distributions are extremely important in statistics and are often used in the natural and the social sciences for real–valued random variables whose distributions are not known. This illustrates the value of the Tri–Center Analysis methodology. It clearly allows observations and generalizations regarding the placement and percentile values of the Post Hoc statistically significant Tri–Squared outcomes within its own set of Trichotomous values. As such, researchers and research investigators can gather much more insight about Tri–Squared outcomes through Tri–Center Analysis in terms of the following,