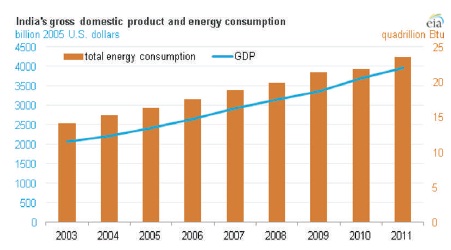
Figure 1. India's Gross Domestic Product and Energy Consumption (Source: https://www.eia.gov/todayinenergy/detail.php)
The Internet of Things allows object to be sensed and actuated remotely across existing network infrastructure, creating opportunities for more direct integration between the physical world and computer-based systems, resulting in improved efficiency, accuracy, and economic benefit. In this applied research, a real time energy monitoring system employing IoT is proposed. This is a cost-effective system consisting of a energy meter and a user-friendly android app, which can be installed in a local residence for energy monitoring and the data can be uploaded to cloud through which detailed information and pattern of energy consumption of the house can be accessed remotely or locally by the user. Through this system there will be reduction in the wastage of energy and can be used as a platform for efficient energy management.
India is the fourth largest energy consumer in the world, the primary energy requirement in India has grown from about 450 million tons of oil equivalent in 2000 to 770 million TOE (Tonne Equivalent of Oil) in 2012 as shown in Figure 1. This is expected to grow to about 1500 million TOE in 2030. India suffers from a massive electricity deficit with large swathes of country undergoing power cuts on a regular basis, but with ever increase in the demand for energy it is very difficult for Indian electric utilities to supply required energy. Hence, energy management and saving becomes very important.
Figure 1. India's Gross Domestic Product and Energy Consumption (Source: https://www.eia.gov/todayinenergy/detail.php)
Therefore, it is essential to switch to new and better options like smart grid, smart metering, and zero energy buildings that will help reduce dependency on these reserves by reducing energy consumption and increasing the performance and efficiency of the existing energy management infrastructure. Energy Management Systems (EMS) are essential as a comprehensive offering that combines energy and process optimization and, where appropriate, incorporates the solution into online advanced control and optimization strategies. An Energy Management System is a series of policies, processes and procedures to manage energy usage, Energy, in the context of organizational use, can be defined as the direct or indirect consumption of fuel required to perform the organizational functions. It is a strategy of adjusting and optimizing energy, using systems and procedures so as to reduce energy usage.
In this research work, a system has been proposed that integrates the advancements of SoC (System on Chip) and other sub systems with IoT (Internet of Things) cloud services (Chorost, 2008) to create and provide a simple platform for conveying necessary energy consumption information of the electrical appliances to the consumers, and also help them remotely monitor the energy consumption either through a web browser or a smartphone consisting the android application. The system helps the consumers to understand their exact energy requirements and assist them in planning an effective energy management strategy for their daily energy usage and bringing down the power costs.
Through the literature survey, it is observed that a lot of research and development has been carried out for smart energy metering.
Ashraf et al. (2015) have developed a prototype device for sensing in smart homes using WiFi enabled communication, where an emphasis was given to the design and implementation of a system through which energy related data could be acquired to study energy consumption patterns. Further, the prototype was compared with a commercially available energy monitoring system to analyze the performance of the system.
Luan and Leng (2016) have developed an application of enterprise energy monitoring system based on IoT and B/S structure. The emphasis given is to improve the level of enterprises energy management and energy saving. The system architecture is made up of three layers, such as perception layer, transport layer, and application layer. Compared with other backward ways of energy management the energy monitor in the system based on IoT has more advantages.
Hlaing et al. (2017) have designed and developed a system which uses a very low-cost sensor network and protocol for smart energy and web application capable of automatically reading the unit and sending it to the consumers to monitor energy consumption. Hence, the consumer will be aware of electricity usage in his/her house and can minimize the wastage of energy.
In all the above-mentioned works, various standalone modules are integrated to accomplish a particular task, which occupies more space and requires modification on the existing energy monitoring system and will increase the complexity of real-time implementation. The additional power requirements increase the complexity and therefore in this research, the authors designed and developed a low cost, low power, light-weight energy monitoring system using ESP-32 SoC (System on Chip), which can compute various AC parameters like voltage, current, real power, apparent power, power factor, units of energy consumed, etc.
The ESP-32 SoC is an advanced version of the popular WiFi chip ESP-8266, which consists of a processor with built-in WiFi and Bluetooth modules (ESP8266, 2016). The configuration and software code are developed in Arduino IDE, and the proposed system uses ThingSpeak IoT platform. Further, a custom Android app is also developed to access data from cloud server and display it to the consumer (Introduction to ThingSpeak (n.d.)).
In this section the architecture and working of the proposed system along with the energy meter system setup and the hardware components used in this research are discussed and explained. The hardware and software components used in this are all open-source and have been developed and used according to the requirement of the research work. The architecture was revised over again to improve the performance and simplicity of the system with help of engineering design process.
The proposed system is divided into two sub systems.
Figure 2 shows the architecture of the proposed system.
3.1.1 Energy Meter
The energy meter block diagram is shown in Figure 2. It consists of ESP-32 SoC, voltage and current conditioning circuits, LCD module, and power supply. This part of the system is installed in the consumer's house. The voltage and current conditioning circuits are used in conditioning the input signals so it meets the input requirements of analog GPIO (General Purpose Input Output) pins, i.e. a positive voltage between 0 V and the analog reference voltage. The ESP-32 is configured with a router name and password to connect to a wireless router for internet connectivity (Ramakrishnan & Gaur, 2016; Arampatzis, Lygeros, & Manesis, 2005; Sun, 2012) after the completion of authentication process, the consumed data is uploaded to the server.
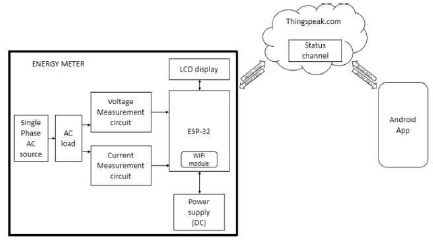
Figure 2. Architecture of the Proposed System
The design of the voltage and current signal conditioning circuits are discussed and explained in the following section.
3.1.1. 1 Voltage Signal Conditioning Circuit
The voltage signal conditioning schematic shown in Figure 3 consists of a 230 V - 12 V step-down voltage transformer connected in parallel to the AC mains supply, where the transformer is modelled using a single-phase AC to ease the process of simulation and a circuit for signal conditioning. The output signal of the transformer is fed to the circuit, where the signal is conditioned and reduced within the reference voltage levels of the Analog to Digital Converter (ADC). The signal consists of both positive and negative peaks, but the ADC of the ESP-32 SoC is not compatible to read negative peak so, a DC bias voltage of V is added to shift the negative peak to positive. This signal is fed to analog IO (Input Output) pins.
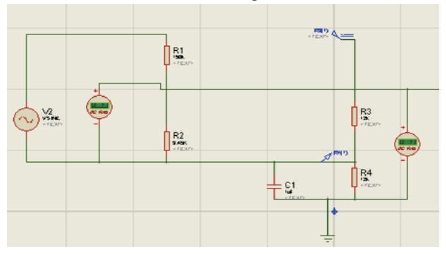
Figure 3. Voltage Signal Conditioning Circuit
(i) Design of voltage divider circuit
The transformer output is 12 V (RS), but due to no load connected the measured voltage is:
VOut = 15.5 V
Assuming R1 = 150 K Ohms
In order to get the voltage corresponding to 230 V the voltage drop across R2 was considered to be 1.15 V so,
VR2 = 1.15 V
Using, voltage divider equation:
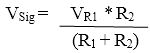
Substituting the values,
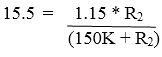
The value of R2 = 12.02 K ohms.
(ii) Design of Voltage divider bias
The Voltage divider bias consists of two resistors of same value, where the voltage is derived from the controller.
VDD = 3.3 V
VBias = 1.65 V
The value of both resistors is kept high to keep the power consumption minimum.
R1 = R2 = 150 K ohms
(iii) Design of Capacitor
The capacitor is used in the circuit to remove high frequency noise from the signal.
C1 = 1 uF -10 uF.
3.1.1.2 Current Signal Conditioning Circuit
The current signal conditioning schematic shown in Figure 4 consists of a current transformer connected in series to the AC mains supply, where the transformer is modelled using a single-phase AC current supply to ease the process of simulation and a circuit for signal conditioning. The output signal of the transformer is fed to the circuit, where the current signal is converted to voltage because the ADC cannot read the current signal hence, it is conditioned and reduced using a burden resistor. The signal consists of both positive and negative peaks, but the ADC of the ESP-32 SoC is not compatible to read negative peak so, a DC bias voltage of 1.65 V is added to shift the negative peak to positive. This signal is fed to analog GPIO.
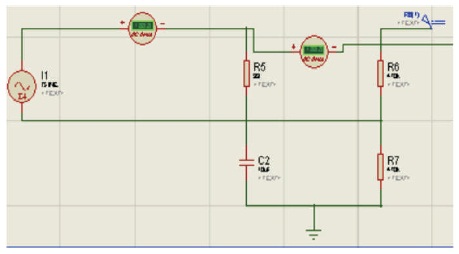
Figure 4. Current Signal Conditioning Circuit
(i) Design of Burden Resistor
The current transformer has current range of 0 to 100 A. For this example, let's choose 100 A as our maximum current.
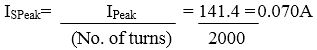
Primary peak-current
IPeak = IRMS x 1.41 = 141.4 A.
Secondary peak- current,
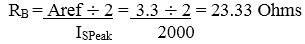
Burden resistance,
ADC reference voltage = Aref = 3.3 V
(ii) Design of Voltage Divider Bias
The value of both resistors is kept high to keep the power consumption minimum.
R1 = R2 = 150 K ohms
(iii) Design of Capacitor
The capacitor is used in the circuit to remove high frequency noise from the signal.
C1 = 1 uF – 10 uF
3.1.2 Cloud Platform and User Interface
In this section the details of the operation of cloud platform and control are explained. The AC parameters are computed by the SoC. Once the signal is acquired through the signal conditioning circuits, the processing is done by the SoC, and in order to upload these values to the cloud, authentication is necessary, where the SoC is configured with channel ID and authentication token. Upon authentication, these parameters are uploaded via HTTP post to the channel created on the cloud platform every 20 seconds. The data is then graphically displayed on the cloud. A custom Android app is developed using MIT app-inventor for the user to understand and monitor the energy consumption pattern. The user-interface consists of a button through which the user can generate read requests which are forwarded to the cloud, which replies based on defined rules. The values retrieved from the cloud are then displayed on the smartphone.
The process flow depicted in Figure 5 starts with the processor being initialized once the controller is powered ON. The ESP- 32 board is operated on 3.3 V, which is powered through a 5 V adapter, and an onboard voltage regulator is used to convert 5 V to 3.3 V. In order to upload/publish the data to the cloud, internet is necessary. The system is connected to the internet through the wireless router using the configured SSID and password (Chen & Jin, 2012). Once, IP address is assigned the system is connected to the internet. Upon completion of the cloud authorization through token and channel ID, the processor uploads the data to the cloud storage, where a channel with multiple data fields is created to accept and visualize the data in graphs (Nunberg, 2012), where the output of the signal conditioning circuits is processed to compute the AC parameters like Voltage, Current, Real power, Units through the C code developed in the Arduino IDE using libraries. The computed parameters are accumulated with the parameters in the cloud. The process is repeated for every new sensing.
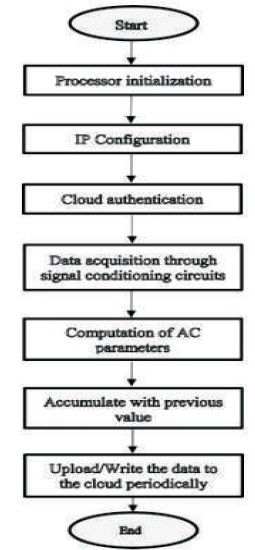
Figure 5. Process Flow
In this section, the authors discuss the hardware setup and the different modules used in the proposed work. The energy monitoring system is setup in the house of consumer as shown in Figure 6. The signal conditioning circuits are powered from the ESP-32 SoC, which is in turn powered using 5 V adapter and the outputs of the sensor are connected to analog GPIO pins. The hardware components used in the system are discussed along with their specifications below.
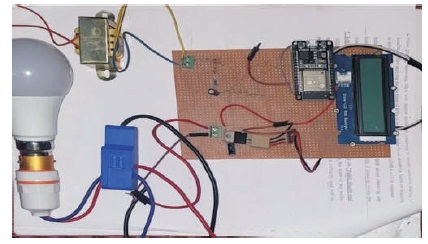
Figure 6. Hardware Implementation of the System
3.3.1 Controller
ESP-32 development board is low cost, low power, surface- mount PCB (Printed Circuit Board) containing the ESP-32 SoC with built-in WiFi and dual Bluetooth connectivity as shown in Figure 7. The ESP-32 SoC employs a Tensilica Xtensa LX6 microprocessor in both dual-core and single-core variations. Table 1 lists all the benefits and features of ESP-32. The board has built-in linear voltage regulator, GPIO interrupts, SAR (Successive Approximation ADC), and capacitive touch sensor interrupt.
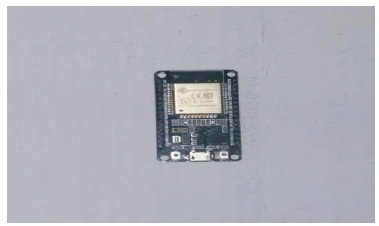
Figure 7. ESP-32 Development Board
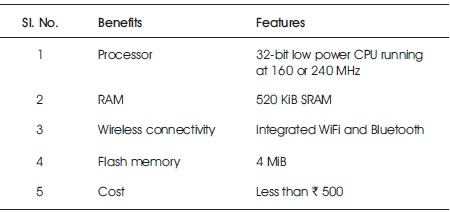
Table 1. Features of ESP-32
3.3.2 Groove LCD RGB Backlight
The Groove LCD as shown in Figure 8 is a replacement for the standard Serial LCD, which is a mono color. Table 2 lists all the features and specifications of LCD module. I2C protocol is used for communication with the microcontroller about the number of pins required for data exchange and backlight control shrinks from 10 to 2, relieving IO (Input Output) pins for other tasks.
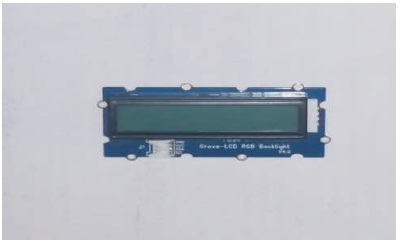
Figure 8. Groove LCD RGB Backlight
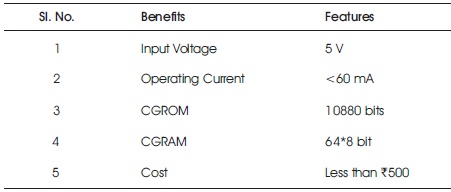
Table 2. Features of Groove LCD RGB Backlight
3.3.3 230 V-12 V Transformer
The transformer shown in Figure 9 is used to convert 230 V AC to 12 V AC. Step down transformers are used, which consists of two windings, namely primary and secondary. The output of the transformer is 12 V AC RMS (Root Mean Square) as mentioned in Table 3. The output of the transformer is fed to the signal conditioning circuits.
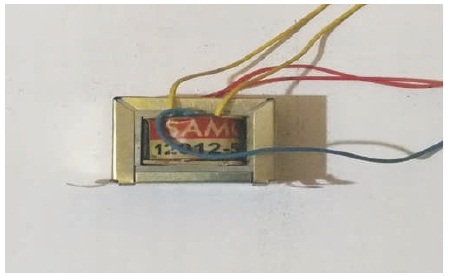
Figure 9. 230 V-12 V AC Step Down Transformer
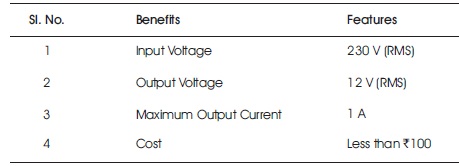
Table 3. Features of 230 V-12 V Transformer
3.3.4 SCT-013-000 Current Transformer
The Current Transformers are sensors that are used to measure AC current that are particularly useful for measuring the whole building electricity consumption. The CT has a output current range of 0-50 mA. The CT has a primary winding, secondary winding, and a magnetic core. SCT-013-000 current transformer is shown in Figure 10. Table 4 contains features of SCT-013-000.
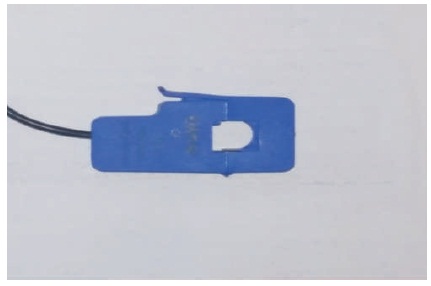
Figure 10. SCT-013-000 Current Transformer
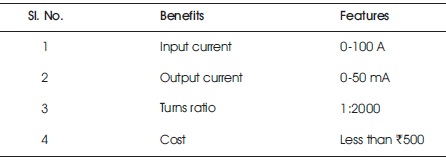
Table 4. Features of SCT-013-000
The energy monitoring system was installed in the premises of the consumer. To observe the real time energy consumption, the system was connected to the AC single phase supply and to a 0.5-watt LED acting as a load. The AC parameters were computed for several hours and uploaded to ThingSpeak cloud for every 20 seconds analysis. In case of power failure, the controller re-initializes and obtains the previous values stored in the cloud on request-response basis. In the initial stage the signals are acquired and the AC parameters are computed and accumulated. The values received at the cloud are stored and displayed in graphical format including the timestamp. The history of the meter reading can be maintained as new values are appended. In Figures 11, 12, 13, and 14, different AC parameters are displayed graphically.
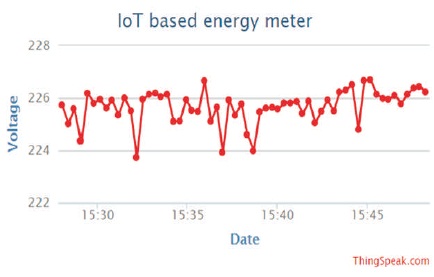
Figure 11. Voltage (RMS) Measured from the Single-phase AC Supply
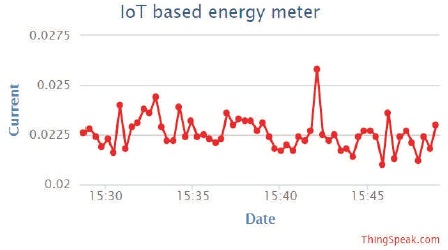
Figure 12. Current Consumed by 0.5-watt LED
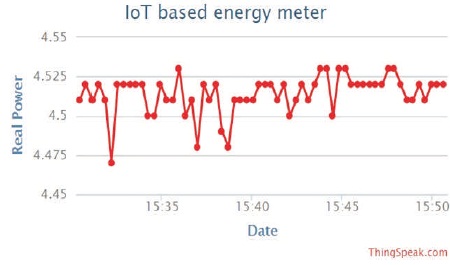
Figure 13. Real Power Consumed by 0.5-watt LED
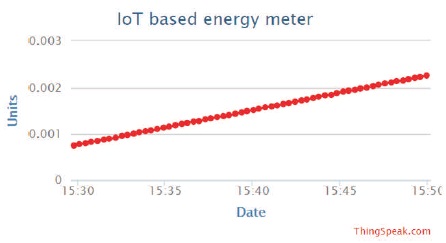
Figure 14. Units (Kwh) Consumed by the 0.5-watt LED
Once, the AC parameters are uploaded to the cloud they can be used for real-time energy consumption monitoring. To ease the process, a customized Android app is developed through which the consumer can generate requests to the cloud for retrieving energy consumption data or AC parameters. The user can access different data like Units, Real power, Power factor of his choice by making some minor changes in the app. The details of different fields available in the channel and number of Units consumed by the load is 0.001 as displayed in Figure 15. The app can be installed in all the smartphones with Android 4 and above.
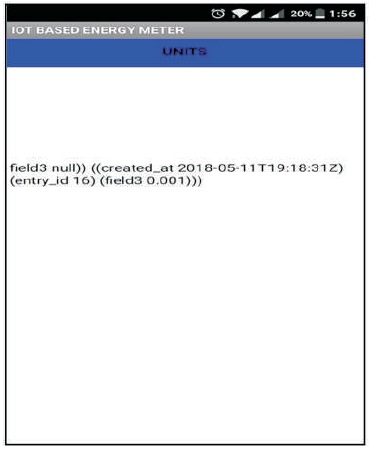
Figure 15. Image of the Android App where the Number of Units Denoted by Field3 Consumed by a 0.5-watt LED is Displayed
The developed system exploits the emerging technology IoT for real-time energy monitoring. It provides a simple and efficient strategy to monitor energy consumption effectively. The emphasis of the research is to reduce manpower requirement in assessing the energy readings and also reduce the errors. A low cost, low power system is developed to sense, compute, and transfer real-time data. It also provides a user-friendly platform for the consumers. Further, the developed system can be extended to a large scale in order to determine the load distribution and energy consumption pattern in the area. This can improve the existing infrastructure and make it more reliable and efficient.