Abstract
Learning to write in English as a Foreign Language (EFL) has always been an issue for most learners since it requires intensive cognitive activity along with language proficiency. This mixed-methods study aimed to examine if interactive Video Embedded Infographics (VEI) could ease this process in a flipped classroom setting compared to traditional infographics. Twenty-four EFL learners equally divided into two groups as traditional infographics group and the video embedded infographics group participating in a 3-week intensive EFL writing training. Quantitative data was obtained through quizzes, a final exam, and a delayed exam, while semi-structured interviews were implemented to obtain qualitative data. Quantitative results showed no significant difference between groups in terms of test performance, indicating satisfactory scores for both groups. Qualitative findings revealed a positive tendency towards video embedded infographics, most learners found them concise, easy to use, and more compact. Participants also showed positive attitudes towards EFL writing courses in a flipped classroom setting, stating that they found it more practical, stress-free, and efficient compared to traditional EFL writing classrooms.
Keywords:
- EFL Writing
- Infographic
- Flipped Classroom
- Mixed Method
- Learning Environment
- Memory Retention
- Language Learning
- Instructional Practices
Introduction
Learning to write in a second language is a cognitively demanding activity. It not only requires learners to think, plan, and organize their thoughts in written form but also demands a certain level of grammatical, pragmatic, and metacognitive skills in the target language. It is not uncommon to see EFL learners struggle to write since they are mainly challenged by limited vocabulary, grammar, and organization, especially at low proficiency levels (Chen, 2002). For such EFL learners, blending well planned organization, correct grammar, and meaning in written form may take time to acquire. However, despite its challenging nature, writing is a crucial skill to develop even at low proficiency levels (Firkins et al., 2007). With the increasing online opportunities, one of the favoured remedies for this challenge is creating a flipped writing classroom setting in which EFL learners are provided with more time to practice. As a blended learning context, a Flipped Classroom (FC) can be defined as a pedagogical practice in which learners acquire theoretical content online before class and engage in more practice-oriented work in the classroom (Bergmann & Sams, 2012). Such a practice-oriented approach was fostered by the pandemic period and may fit well with L2 writing instruction, since practice is an essential part of writing acquisition. The rationale behind this study was that the online procedure in a flipped classroom setting can be enhanced through infographics, which allow for concise, precise, and meaningful references for the L2 writing objectives
An infographic is a set of manually created visualizations used to highlight specific points about any content, in order to capture the reader's attention through a hierarchically organized graphic design (Harrison et al., 2015). A well-designed infographic ensures that information is conveyed quickly in an organized and easily understandable way (Yıldırım, 2020) . According toLamb and Johnson (2014) , infographics are a form of visual presentation of information that can facilitate the comprehension of complex content by providing a meaningful flow of visual data (Krum, 2013). In this way, large amounts of information can be presented in a more concise and compressed form with minimal explanation (Lester, 2011).
There are several types of infographics, and in this study, we examined the potential positive impact of Video- Embedded Infographics (VEIs). VEIs are a type of interactive infographic that incorporates embedded videos. Unlike traditional infographics, which contain only images and text, VEIs allow for greater interactivity and learners can benefit from images, text, and video material simultaneously. Embedded videos can be activated by readers through clicking or touching, providing additional clarification on the subject. Siricharoen and Siricharoen (2015) noted that videos are attractive and eye-catching, can increase concentration, and are preferred for explaining complex ideas or concepts. Given the potential benefits of infographics, this study aimed to investigate the effects of VEIs on learning compared to traditional infographics with a separate video in L2 writing in a flipped classroom setting. The research questions were as follows:
- Is there a statistically significant difference between the experimental group (VEIs use) and the control group (traditional infographics use) regarding writing performance in the quizzes, the final exam and the delayed test?
- What do students think about the L2 writing course Flipped Classroom experience with infographics?
1. Related Research on Infographic use in ESL/EFL Instruction
In the EFL or ESL context, there has been an increase in research related to the integration of infographics into instructional content. Dahmash et al. (2017) conducted a study to investigate the impact of using information graphics in teaching linguistics to Saudi students. The study involved 186 female Saudi college students from the English Language and Translation department at Princess Nourah bint Abdulrahman University (PNU). The students in the study took two linguistic courses, Introduction to Linguistics and Introduction to Semantics. All participants were given assignments that included designing infographics for their linguistics course. In the qualitative phase of the study, the researchers evaluated the students' work after class presentations. The quantitative step involved a questionnaire to collect data from students regarding their learning experience while designing infographics. The results revealed that the majority of the students were not familiar with infographics before participating in the project. However, most of them reported being motivated to use infographics in their future academic and professional careers. The participants benefited from practicing various skills through creating infographics, such as higher-level thinking skills and collaborative learning.
Bicen and Beheshti (2022) investigated the potential benefits of using infographics in a flipped ESL classroom setting. The study involved 130 undergraduate students from the School of Foreign Languages (SFL) at a private university in North Cyprus. The participants were divided into two groups of equal size: a control group and an experimental group. Their mixed design included a questionnaire and focus-group interviews. The quantitative findings showed that female students exhibited more positive attitudes towards using infographics. The majority of the students found infographics to be motivating andffective for learning subjects. The qualitative results were also consistent with the quantitative findings, indicating that infographics provided a flexible, safe, and easy ESL learning experience.
The study by Cupita and Franco (2019) aimed to explore the use of infographics in ESL reading with 26 sophomore psychology students taking English classes for academic purposes. The students took reading classes with infographics for a semester, which included English reading skills, ranging from literal to critical comprehension of short academic texts through infographics. The data was obtained through two instruments: interviews and students' artifacts, to analyze the students' L2 reading experience. The findings showed that the infographics allowed the students to paraphrase the main ideas from the texts and represent their understanding of the readings. From the teacher's perspective, infographics were helpful since they enabled them to explore reading comprehension using a new strategy that might be beneficial in English classes. However, some technical challenges were mentioned, including that the infographics were website-based and required a stable internet connection to work efficiently. Additionally, designing infographics sometimes took more time than expected. In their recent theoretical study, Maamuujav et al. (2020) discussed the potential benefits of infographics in writing classrooms. The rationale for their research is based on the assumption that writing in a second language is a cognitively demanding activity. They approached infographics as a medium that can reduce cognitive overload during the L2 writing experience by visually presenting various steps of writing, such as drafting, organizing data, and writing. The study also provided tips on infographic design and utilization in writing classrooms to make the writing experience more effortless. However, the study also identified some challenges that may arise from using infographics, such as website problems, template complexity, and the difficulty of reducing complex topics to compact ideas without losing meaning.
Kohnke et al. (2021) recently conducted a related study in the ESP (English for Specific Purposes) context. They mainly aimed to explore the perceptions of tertiary undergraduate students regarding the use of infographics as a reflective assessment in an ESP course at an English-medium instruction university in Hong Kong. Twelve learners went through qualitative procedures on their infographic experience. The findings in this study indicated that most students valued the infographic assessment as a learning experience to develop language skills and engage with discipline-specific English. Moreover, students reflected increased self-confidence and motivation to learn when communicating in English with potential clients. Compared to traditional methods, the students expressed that infographics provided meaningful learning by connecting concepts and language learning objectives.
2. Method
2.1 Design
This study adopted a mixed-methods approach by blending qualitative and quantitative findings. Gardner (2012) defines a mixed-method study as using both qualitative and quantitative methods in the same study. In this context, quantitative data were collected within the scope of the relevant research, and the results were detailed with qualitative data. This study adopted a sequential explanator y mixed design in which quantitative data (written quizzes and exams) was collected and analysed first. Then qualitative data (semi structured interviews) is collected and analysed to explain the quantitative data (Creswell, 2003).
2.2 Participants
Participation in the study was based on volunteerism, and only preparatory class students who had not previously received any L2 writing course experience were selected as participants. In this context, the purposive sampling method was preferred over other non-random sampling methods within the scope of the present study. Purposive sampling involves the inclusion of people, events, or objects that meet specific criteria in the research sample (Büyüköztürk et al., 2011; Patton, 1987).
A total of 26 EFL preparatory class students (21 girls, 5 boys) between 18-21 voluntarily participated in the study. All students scored below 60 points in the proficiency exam held at the beginning of the 2021–2022 academic year. Hence, all participants were A2 level learners. Two students were excluded since they couldn't attend the courses after the first week. 24 students were divided equally into 2 groups as "VEI group" and the "traditional infographic group," and they received intensive writing training for 12 hours for 3 weeks, for a total of 4 hours on 2 separate days a week (Monday and Thursday).
3. Infographics Design
A total of 6 infographics were designed with Canva software, one of the Web 2.0 tools, and completely authentic texts and examples were used. The simple infographics (without sound or video) were prepared for the simple infographic group. For the VEI group, Kotobee Author software was utilised on the same infographic to embed videos. These embedded videos included a short narration of the weekly writing subjects narrated by the researchers in parallel with the infographic content. Hence, the VEI group could benefit from videos while analysing the infographics.
Related infographics were shared with the study groups in Google Classroom before the face-to-face lesson activities, and sufficient time was given for the students to study the relevant materials. In addition, students were provided effective communication and instant feedback with groups established through instant messaging applications. The students participating in the research opened the relevant infographics in Kotobee Reader. A sample infographic is shown in Figure 1.
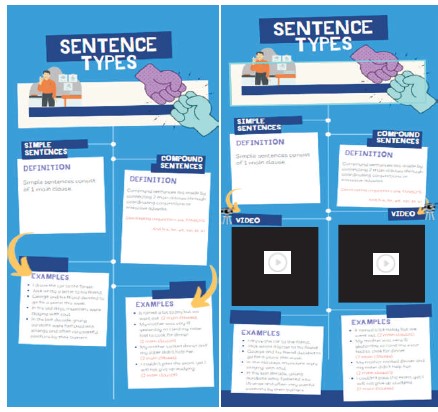
Figure 1. A Sample Infographic (Simple Infographic on the Left, VEI on the Right)
4. Course Plan and Procedure
The writing education curriculum carried out within the scope of the relevant research is shown in Table 1.
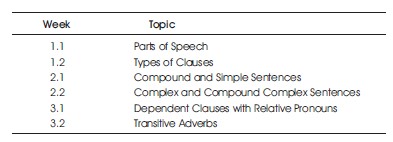
Table 1. Writing Education Curriculum Carried Out Within the Scope of the Relevant Research
In accordance with the principles of flipped classroom application, the infographics were presented to each group through Google Classroom one day before the lesson, giving the participants enough time to work. Only writing practice was carried out in the classroom. The exercises were composed of controlled writing, peer feedback, and syntax activities.
5. Assessment Materials and Procedure
Three basic exam types were used for performance measurements. They are short quizzes, the final exam, and the reminder test. Short quizzes were 10-minute quizzes carried out at the beginning of each week's lesson covering the related topic to check whether learners studied infographics. The quizzes included multiplechoice questions and true/false drills. The final exam is a 60-minute exam held at the end of the instructional period (three weeks) and covers the entire curriculum. General learning outcomes and writing performance were assessed with the final exam, which consisted of various writing drills (i.e., sentence writing, sentence completion, identifying sentence type). The delayed test was a type of test administered one month after the final exam. The content of this exam was similar to the final test, aiming to determine how much of the L2 writing learning gains were remembered.
6. Data Analysis
The analysis of quantitative data was divided into three parts. They are the quiz performance, the final performance, and the reminder exam performance. First, the mean value for six quiz performances was taken. Due to the small number of participants, the Mann- Whitney U test was used to reveal the quiz performance difference between the two groups. The Mann-Whitney U was also conducted for the final exam to explore any significant performance differences between groups. To measure the time effect on L2 writing gains, a repeated measure ANOVA was adopted by taking the final exam and the reminder exam as 2 levels and the group variable as the between-subjects factor.
7. Findings
In the findings section, quantitative findings related to quizzes, the final test, and the delayed test were presented. As the sample size was limited, the Mann- Whitney U test was adopted to analyse the quizzes and the final and delayed test scores. For the qualitative part, codes and themes were extracted and presented with frequency tables along with participant comments.
7.1 Quantitative Finding 1: Quiz Performance
As mentioned in the method section, the participants took a short quiz on the relevant infographic in each lesson. A total of six quiz performances were averaged, and the Mann-Whitney U Test was applied using the group variable. Table 2 shows the mean quiz scores. Table 3 shows the mean rank for quiz scores. Table 4 shows the Mann Whitney U Results for Quiz performance.
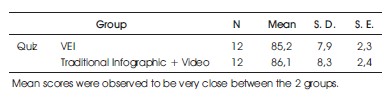
Table 2. Mean Quiz Scores
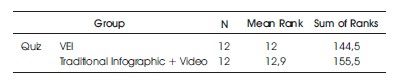
Table 3. Mean Rank for Quiz Scores
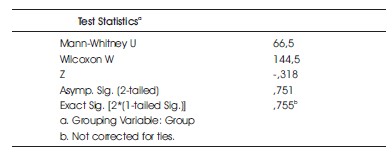
Table 4. Mann Whitney U Results for Quiz Performance
No significant difference was observed between groups regarding quiz performance; U(12,12) = 66.5; Z=4.42; p> .05.
7.2 Quantitative Finding 2: Final Test Performance
As mentioned in the method section, the participants took a final exam covering all subjects at the end of the instruction. The Mann-Whitney U test was used to analyze any difference between the two groups. According to the mean scores shown in Table 5, it was observed that the two groups achieved similar scores in the final test. Table 6 shows the mean ranks for the final test. Table 7 shows the Mann Whitney U results for final test performance.
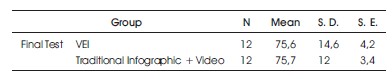
Table 5. Mean Scores for the Final Test
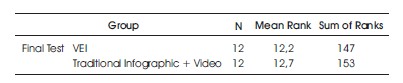
Table 6. Mean Ranks for the Final Test
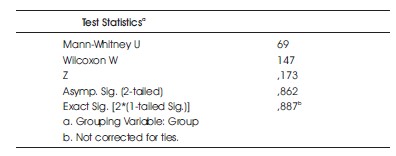
Table 7. Mann Whitney U Results for Final Test Performance
No significant difference was observed between groups regarding the final test performance; U(12,12) = 69; Z=.173; p> .05.
7.3 Quantitative Finding 3: Delayed Test Performance
Table 8 shows the mean scores for the delayed test. Both groups scored similarly in the delayed test. In addition, both groups scored less when compared to the final test performance. Table 9 shows the mean ranks for the delayed test. Table 10 shows the Mann Whitney U results for delayed test performance.
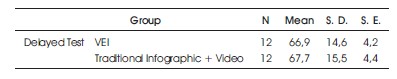
Table 8. Mean Scores for the Delayed Test
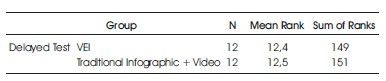
Table 9. Mean Ranks for the Delayed Test
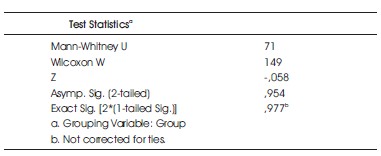
Table 10. Mann Whitney U Results for Delayed Test Performance
No significant difference was observed between groups regarding the delayed test performance, U(12,12) = 71; Z= -.058; p> .05.
The quantitative data obtained from the quizzes, the final test and the delayed test revealed no performance difference and indicated that both VEIs and traditional infographics supported learners in similar ratios during the instructional period. In the next section, qualitative data was presented for further understanding of the research questions.
8. Qualitative Findings
In the qualitative phase, participants' opinions were asked about flipped classroom experience in L2 writing and infographics.
8.1 Opinions on the Flipped Classroom Experience in L2 Writing
It was observed that all participants had positive opinions and stated that they liked the FC setting. In this respect, the participants' views on the effect of FC applications on learning gains were examined in detail, and the findings were shown in Table 11.
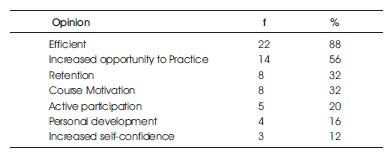
Table 11. Opinions on Flipped Classroom
When the general opinions of the participants were examined, almost all of the participants stated that the FC setting was much more efficient than both face-to-face and online education processes in L2. In addition, it was observed that they emphasised the increased time allocated for writing practice. Additionally, participants expressed an increase in retention and course motivation. Several participants mentioned that they felt more responsible since they were required to study the theoretical topics at home. They added that being ready for the course increased active classroom participation, supported personal development, and increased selfconfidence.
“It was more efficient than I expected. At first, I thought I would be more passive since I lack experience in FC settings. But it didn't. … I was studying at home by myself. It was better for me…I felt more comfortable when I came to the classroom…” (S7, Translated by the Researchers)
“…We did more writing practice in the classroom. Since we came prepared, we had more time to write and get feedback” (S4, Translated by the Researchers)
“First of all, it was great that we had the materials to study before the course. In other words, coming to class prepared gives you a little more selfconfidence. It helped me to be more active in the classroom.” (S2, Translated by the Researchers)
“… the topics became more memorable… We couldn't do what we learned at school before when it came out. But when it was the opposite, it became more memorable since I found more time to practice.”(S9, Translated by the Researchers)
“It was one of the things our teachers tried to get us to do all our lives. … I honestly think it was very beneficial for me. Because I used to listen to the subject in the lessons, but never learned at home. So I was having problems with the topics, especially the details. We couldn't get to the most important thing, practice." (S3, Translated by the Researchers)
It was observed that the readiness provided by FC was frequently emphasised and was most appreciated by all participants. Opinions on the advantages of coming to class prepared for the participants were shown in Table 12.
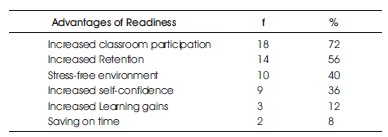
Table 12. Advantages of Readiness
The majority of the participants mentioned that their active participation in the classroom increased (72%; N = 18) thanks to their readiness. In addition, they emphasised increased retention of theoretical content since they studied the subject one day before the class (56%; N = 14). Several participants also stated that readiness lowered their anxiety during the course and enabled a more stress-free environment (40%; N = 10) by increasing their self-confidence (36%, N = 9). Some participants also Emphasised more complete learning gains (12%, N = 3) and time saved by the FC setting (8%, N = 2).
“It made the writing course easier to understand. I attended more classes. I understood better. It is very important to study and have an idea before practicing writing. Active participation helped me understand better and increase my self-confidence.” (S12, Translated by the Researchers)
“… our lessons were more effective because I had studied one day before. I did not experience anxiety. It was more comfortable and beautiful. I was more active in the lessons.” (S7, Translated by the Researchers)
“I think it's better. … you learn a subject you have never studied before when the teacher tells you, but then you forget. Here you learn the subject and when you get stuck, you take notes and ask the teacher. … I was able to answer the questions asked in the lesson. Class participation has increased tremendously.” (S19, Translated by the Researchers)
“I think it saved a lot of time. We learned in 10 minutes what we would learn in 40 minutes”. (S13, Translated by the Researchers)
8.2 Opinions on Infographic as a Material in FC Setting
Following positive reactions to the FC experience, the opinions of the participants as FC materials were investigated. The findings obtained are shown in Table 13.
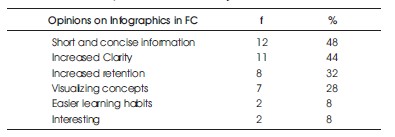
Table 13. General Opinions on Infographics use in FC Setting
When the general opinions of the participants about the infographics were examined, we found that most participants favoured the short and concise information presented in the infographics (48%; N = 12). In addition, they stated that the information presented in the infographics is understandable and clear (44%; N = 11), supporting retention (32%; N = 8). Some participants mentioned that infographics helped them to visualise theoretical information and reinforced the learning process (28%; N = 7). Only a few participants stated that infographics enabled easier learning habits (8%; N = 2) and found them attractive (8%; N = 2). The following are some comments:
“Traditional books are nice and detailed but sometimes become very confusing. Infographics are more compact and clearer…not confusing...less detailed” (S16, Translated by the Researchers)
“I understood very well from infographics. The information was sufficient. Again, it was very good. It made me remember the content easily.” (S2, Translated by the Researchers)
“…it was very briefly and simply summarized. It was very nice in structuring the initial knowledge.” (S22, Translated by the Researchers)
“I found it easier to understand with visuals…I can remember easily…the visuals just come up and I remember the concept. I found it very satisfying”. (S7, Translated by the Researchers)
8.3 Opinions on Traditional and VEIs
The participants expressed positive opinions on infographics in general. Within the scope of the current research, two groups were exposed to different types of infographics. We asked each group's views on video or traditional infographics. In this respect, the participants' opinions on the benefits of the traditional and VEI approaches were summarised in Table 14.
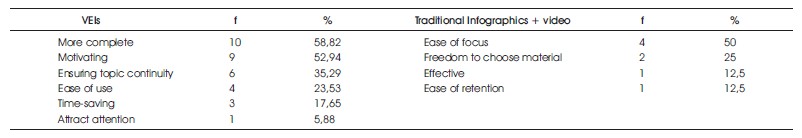
Table 14. Opinions on the Advantages of Two Infographic Types
As shown in Table 14, different types of infographics have their advantages. When the general views of the VEI group were examined, we observed that VEIs provided more complete and compact content. (59%, N=10). In addition, most participants emphasised that the presentation on the same screen is more motivating and less distracting (53%, N = 9). In addition, they mentioned that they preferred VEIs since they were easier to use and maintained the continuity of the content without being distracted (35%, N = 6). Some participants also found VEIs easier to use (24%; N = 4) and more time-saving (18%, N = 3). The following are some VEI-related comments:
“…it doesn't matter to me much, but I could continue directly with the video on the infographics without getting distracted by opening a new window on my phone. It is easier.” (S10, Translated by the Researchers)
“It's so much nicer to have it on one screen. I liked the VEIs. It's good to have instant access. It allowed me to associate the video with the content. It also reinforces remembering.” (S20, Translated by the Researchers) “I think VEIs are better and more compact. When the video was separate, we might not need to open it. It was easier for me to reach when it was embedded. Watching the video immediately after reading it was effective.” (S17, Translated by the Researchers)
“I think VEIs are better. I didn't have to leave and click anywhere else. I didn't waste any time. We were not distracted. It became more comfortable with the videos embedded.” (S3, Translated by the Researchers)
“I think infographic + video is more practical. … There might have been some disconnection if it was another application. You focus more when you are on the same page…” (S9, Translated by the Researchers)
Participants who stated that infographics and videos should be presented separately explained that they would have difficulty focusing when the two materials were presented together, as they typically studied them separately. Here are some of their comments:
“I think it was better to be apart. I couldn't look at both at the same time. It may be confusing. I would watch the video 2-3 times.” (S11, Translated by the Researchers)
“It was better if the infographic and the videos were separate. I didn't really need the videos. … better understood from infographics. If there is something I don't understand, I switch to video in a new window." (S23, Translated by the Researchers)
“The infographic itself was effective…it helped me to understand enough…I watched the video only when I am confused at certain points… convenient and time-saving.” (S14, Translated by the Researchers)
8.4 Opinions on Technical Guidance in FC Setting with Infographics
The current research examined the importance of the guidance service provided to participants during the FC application process. Upon reviewing the participants' general opinions, it was found that all of them were satisfied with the technical guidance service they received during the process. Some participants who faced technical difficulties also stated that the problems were resolved instantly, and the instructor played an influential role in solving them. All participants emphasized their happiness with a problem-free process. Therefore, participants noted that they never felt alone during the process, and this aspect is critical in distance education. Some comments provided by the participants are listed below:
“I think the technical guidance service was pretty good. It has overcome technical difficulties. We were never alone in the process.” (S3, Translated by the Researchers)
“Communication was very good. When the teacher took care of the technical problems immediately, we were able to come to the lesson ready.” (S7, Translated by the Researchers)
“We had no problems with communication. In technical difficulties, the teacher was immediately supportive. I communicated effectively. I have never been alone.” (S14, Translated by the Researchers)
“He helped us whenever we asked. I am very pleased with it. Whatever I asked, I got an answer. I did not feel alone.” (S20, Translated by the Researchers)
9. Discussion
The objective of the current study was to examine the impact of an FC setting with infographics on L2 writing performance. The quantitative results indicated no significant difference in exam performance between the VEI and traditional infographic groups. However, the qualitative findings revealed a positive attitude towards the FC setting since it allowed more time for L2 writing practice. Furthermore, VEIs were slightly preferred over traditional infographics supported with a separate video, as they were more compact and comprehensive.
It is common to observe L2 learners struggling to write, as writing in a second language is a cognitively demanding activity that requires careful formulation to express oneself accurately. Writing is a dynamic process that involves several simultaneous cognitive activities, resulting in cognitive overload (Lindemann, 2001). Infographics, as a multimodal tool, can help L2 learners overcome this cognitive overload caused by the nature of L2 writing. The results of this study support the works of De La Paz and Graham (2002); Rao (2015);Rose et al. (2006); Maamuujav et al. (2020);Selfe (2004), which showed that any type of infographic works well in L2 writing courses by providing ease with writing challenges in an L2 context. In both types of infographics, the exam scores were satisfactory and did not fall below 50 points. Furthermore, all learners expressed positive opinions on the use of infographics, highlighting their concise, practical, and pedagogically supportive nature. Although both types of infographics were appreciated, and no significant difference was found regarding exam performance, learners found VEIs slightly superior. VEIs are more interactive, eye-catching, and effective Siricharoen & Siricharoen, (2015), and can be more memorable. According to Martin et al. (2019), presenting infographics quickly and effectively to users with various multimedia elements is an effective way of making information more meaningful and memorable, thus transferring it to longterm memory. Despite the lack of a difference in exam scores, this study confirmed that interactive infographics enriched with videos or the students preferred other multimedia elements.
The current study on FC instruction with infographics yielded similar results to the study by Bicen and Beheshti (2022), who focused on the differences between traditional instruction and FC instruction with infographics in an L2 vocabulary setting. Similar to our findings, they revealed that learners had a positive attitude towards FC with infographics regarding enrollment rate, selfconfidence, and vocabulary learning gains. In addition to these factors, the current study highlighted other positive aspects of FC with infographics, such as active participation, personal development, and L2 writing motivation. However, research comparing the use of different types of infographics in FC L2 writing settings remains scarce.
Conclusion
The present study investigated the effectiveness of interactive video embedded infographics (VEIs) in English as a foreign language (EFL) writing courses within a flipped classroom (FC) learning environment. Both quantitative and qualitative data were collected to explore the impact of VEIs on students' writing performance and their perceptions of the use of infographics in FC.
The quantitative results showed no significant difference in exam scores between the traditional infographic group and the VEI group, indicating that both types of infographics are equally effective in enhancing EFL writing performance. However, the qualitative findings suggested that VEIs were slightly favored by students due to their interactive and eye-catching nature, which helped to overcome cognitive overload and improve memory retention. Additionally, students appreciated the practical and pedagogically supportive nature of infographics.
Furthermore, the study found that FC with infographics provided numerous benefits for EFL writing instruction, such as active participation, personal development, and increased motivation for L2 writing. These findings are consistent with prior research on the benefits of FC and multimodal tools in language learning.
The use of VEIs in FC EFL writing courses can be a valuable tool to enhance students' writing performance and engagement in the learning process. Our study suggests that instructors should consider incorporating infographics, particularly VEIs, into their instructional practices to optimize learning outcomes for their students.
Recommendation
The insights gained from this study can inform L2 writing instruction, particularly in the context of the pandemic when online education has become increasingly important, and in face-to-face education where optimizing L2 writing practice time is crucial. Based on the results, some recommendations were offered that might help both learners and instructors make the most of L2 writing courses.
- Infographics can easily be implemented in FC setting, providing better learning gains and saving time for L2 writing practice.
- If possible, VEIs can be used by embedding course videos since they create a more interactive learning environment.
- Some technical assistance and communication are required to implement VEIs, as learners may be naïve to this kind of materials.
- Instructors can learn how to design infographics from free infographic design websites, which is not very challenging but require some technical knowledge.
- Before adopting VEIs to the L2 writing course schedule, instructors should ensure that all learners have technical opportunities to exploit infographics such as mobile phones and related app.