Figure 1. Proposed Hexagonal Structure
In this paper, the authors have designed two structures of Photonic crystal fiber. These structures consist of 4 rings of Hexagonal and octagonal air holes. PML and Scattering Boundary condition is applied on these photonic crystal fiber structures. The Finite Element Method of COMSOL Multi Physics is used to design these proposed structures and MATLAB is used to plot the effective refractive index and confinement loss in various cases. It has been observed that the effective refractive index and confinement loss not only varies by change in wavelength, but also by changing the structural parameters of air holes, such as diameter (d) of air holes and pitch (Λ) at 1.55 μm wavelength. The effective area of 2 2 Hexagonal and Octagonal PCF at 1.55 μm wavelength are 163.45 μm and 217.425 μm , respectively.
The importance of Photonic Crystal Fibers (PCF) [11, 13, 20] have been increased over the years since it was invented by Broeng et al., [4]. It consists of multiple air holes which act as cladding for this type of fiber. The index profile of core and cladding of PCF is different from an optical fiber. The optical properties, such as birefringence, dispersion, effective area [8, 9, 14, 22] and confinement loss [17] provides a great flexibility to this type of fiber than an optical fiber. PCF guide the optical waves through one of the two methods: effective-index guidance and photonic band gap guidance. Due to its novel optical characteristic [2,15,16], this type of fiber have received a lot of attention. The diameter of air hole (d) and pitch length (Λ) are two very important geometrical features of Photonic Crystal Fiber. Any variation in these two parameters directly effects the optical properties of Photonic Crystal Fiber which makes these fibers very important. Typically, in PCF air holes are arranged on the vertex of an equilateral triangle with six air holes in the first ring around the core, which is called the HPCF. If the air holes are arranged in hexagonal fashion, then this type of PCF is known as hexagonal PCF. These air holes can also be arranged in various other configurations, such as square lattice, honey comb, cob web, hollow core, octagonal, decagonal and, circular [1, 3, 5, 6, 18, 19] for the designing of PCF.
In this paper, Finite Element Method (FEM) with Perfectly Matched boundary Layers (PML) are used and the real part of effective refractive index, confinement loss [17] and effective area have been evaluated by varying wavelength of light, diameter of air holes and distance between air holes.
The main objective is to comparative and analyze the Optical properties of Octagonal and Hexagonal Photonic crystal fiber. The optical properties discussed in the paper includes real part of effective refractive index, confinement loss, effective area, etc.
These properties have been analyzed by varying the structural parameters of Photonic Crystal fiber, such as wavelength of light, diameter of air hole, and distance between air holes.
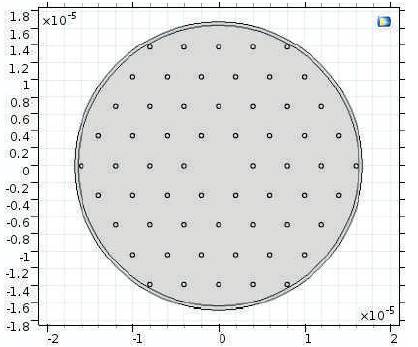
The proposed PCF structure consists of hexagonal and octagonal shape of 4 rings of air holes are shown in Figure 1 and Figure 2, respectively. d and Λ denote the respective diameter and pitch of these structures.
Figure 1. Proposed Hexagonal Structure
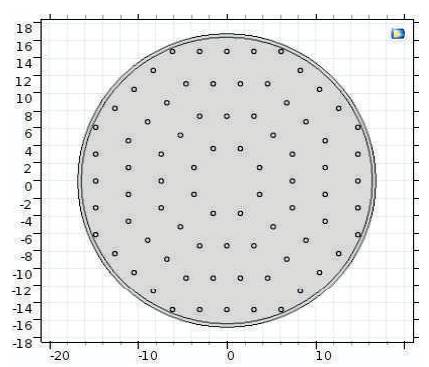
Figure 2. Proposed Octagonal Structure
The background material used is silica with refractive index of 1.45 and air hole with refractive index 1.0, for both these structures of the PCF the diameter of air hole is d=0.5 μm and that of pitch is =4.0 μm. PML of thickness 0.4 μm and Scattering Boundary Condition is used in both structures.
In homogeneous media, the refractive index n can be used to quantify the phase change per unit length. That phase change is n times higher than it would be in vacuum. The effective index has the same meaning for light propagation in a wave-guide and depends not only on the wavelength, but also on the modeling through which the light propagates [7, 10, 12, 21]. The effective index may be a complex quantity. In that case, the imaginary part describes gain or loss.
The imaginary part of the refractive index for various values of wavelength can be obtained and by using the equation of confinement loss [17] which is given by,
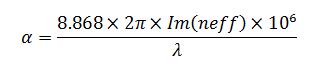
Hence, confinement loss can be evaluated using this method.
Effective measure of the area over which the fundamental mode is confined during its propagation can be calculated from the effective area [14]. The effective area equation is given as,
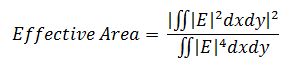
where, E is the electric field in the medium which is obtained by solving an Eigenvalue problem from Maxwell equations.
The fiber has been modeled by COMSOL, using the following steps.
In this step, the geometry of Photonic crystal has been designed. In case of hexagonal PCF, the air holes are arranged in a hexagonal fashion whereas in case of Octagonal PCF, the air holes are arranged in Octagonal fashion. PML and Scattering Boundary Condition is used in both PCF structures.
The physical parameters, such as wavelength, diameter of air hole, and pitch have been used as per the simulation requirements. The authors have choosen 1.55 μm as wavelength, diameter of air hole as 0.5 μm, and pitch as 4.0 μm.
Physics Generated Mesh is used to evaluate the electric field pattern and the real part of effective refractive index.
The computation of the simulation have been done by Modal analysis and Frequency Domain Analysis of the Comsol 5.2 Module. The effective index of fiber is thus computed by solving the eigenvalue equation for each of these physics controlled meshes using COMSOLs Finite Element Method (FEM).
Various observations have been made by varying wavelengths and structural parameters and these observations are plotted in Matlab. The effective area bar graph have been plotted using MS Excel. In this way, the observations of various parameters of Photonic Crystal Fibers have been studied.
Figure 3 is obtained by using Comsol 5.2 based on FEM. It shows the electric field surface plot for hexagonal structure.
The electric field in this instance has been confined to the core as shown in Figure 3. Figure 4 is also obtained by using FEM. Similarly the surface plot is plotted for the octagonal PCF.
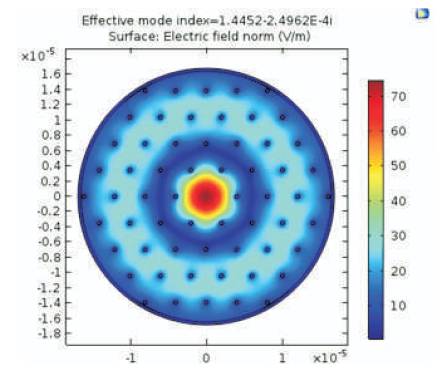
Figure 3. Electric Field Pattern in Hexagonal Structure at 1.55 μm Structure

Figure 4. Electric Field Pattern in Hexagonal Structure at 1.55 μm Structure
Here in this case also, the electric field is perfectly confined to the core which can be shown in Figure 4.
The above process is repeated for various wavelengths from 1.35 μm to 1.53 μm and the real part of effective refractive index is evaluated in all these wavelengths and thereby we can analyze the effect of change in wavelength for both the proposed structures. From Figure 5, it has been observed that the real part of refractive index decreases from 1.4465 to 1.4456 in case of hexagonal structure decreases from 1.4458 to 1.4447 in case of the proposed octagonal structure.
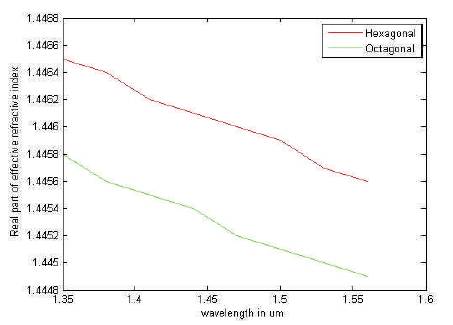
Figure 5. Effect on Real Part of Refractive Index with Change in Wavelength
Similarly we also get an imaginary part of effective index for the various wavelengths from 1.35 to 1.53 μm and thus by putting the value of imaginary part of refractive index in equation (1). The value of confinement loss can be evaluated for these varying wavelengths. From Figure 6, it has been observed that the confinement loss increases from 3.983 to 5.622 dB/m in case of hexagonal structure whereas increases from 2.759 to 3.971 dB/m in case of the proposed octagonal structure.
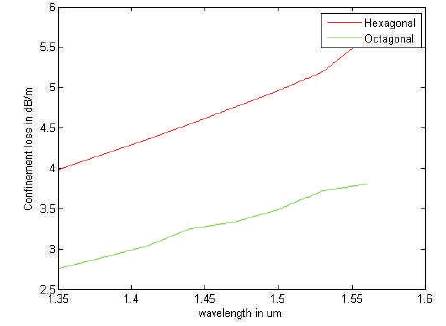
Figure 6. Effect on Confinement Loss with the Change in Wavelength
In this case, the simulation is repeated by varying the value of diameter of air from 0.55 μm to 0.95 μm at a constant wavelength of 1.55 μm. Thus for each simulation, we can get the value of real part of refractive index.
From Figure 7, it has been observed that the real part of refractive index decreases from 1.4453 to 1.4421 in case of hexagonal structure whereas decreases from 1.4444 to 1.4403 in case of the proposed octagonal structure.
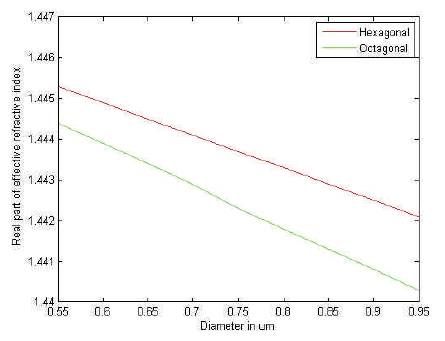
Figure 7. Effect on Real Part of Refractive Index with the Change in Diameter
In this case, the simulation is repeated by varying the value of diameter of air from 0.55 μm to 0.95 μm at a constant wavelength of 1.55 μm. Thus for each simulation, the confinement loss is evaluated.
From Figure 8, it has been observed that the real part of confinement loss decreases from 5.329 to 5.015 dB/m in case of hexagonal structure whereas decreases from 3.581 to 2.434 dB/m in case of the proposed octagonal structure.
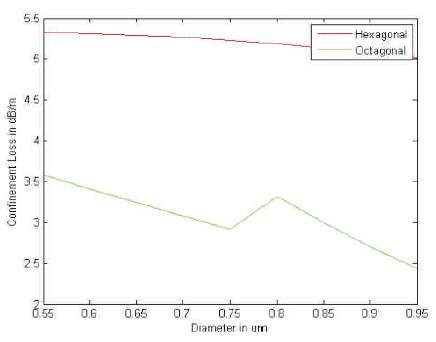
Figure 8. Effect on Confinement Loss with the Change in Diameter
In this case, the simulation is repeated by varying the value of pitch of air holes from 3.0 μm to 4.0 μm at a constant wavelength of 1.55 μm. Thus for each simulation we can get the value of real part of refractive index. From Figure 9, it has been observed that the real part of refractive index decreases from 1.4418 to 1.4457 in case of hexagonal structure whereas decreases from 1.4399 to 1.4447 in case of the proposed octagonal structure.
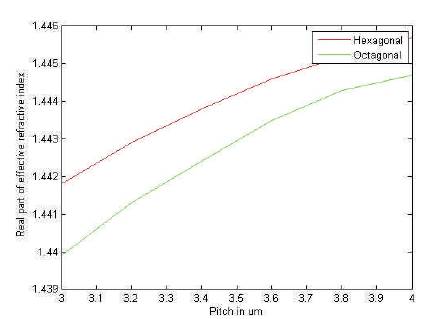
Figure 9. Effect of Change in Pitch on Real Part of Refractive Index at 1.55 μm Wavelength
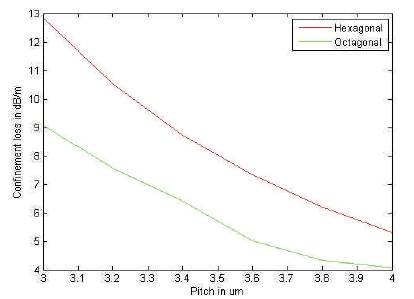
Figure 10. Effect of Change in Pitch on Real Confinement Loss at 1.55 μm Wavelength
To evaluate effective area, the frequency domain analysis is performed for the proposed structure. After performing frequency domain analysis, surface integrals of electric field is calculated as required in equation (2). Then the bar graph of effective areas of various PCF structures have been plotted.
From Figure 11, it has been observed that in case of Hexagonal PCF, the effective area at 1.55 μm is 163.45 2 μm whereas in case of Octagonal PCF the effective area 2 is 217.425 μm .
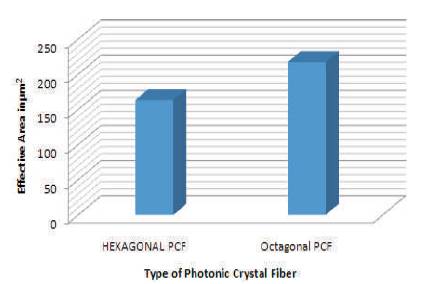
Figure 11. Bar Graph of Effective Area at 1.55 μm Wavelength
After modeling the hexagonal and octagonal PCF, following conclusions can be made:
The authors would like to thank the supervisors for their cooperation, encouragement and advice during paper work, and also to anonymous reviewers for their helpful comments and suggestions.