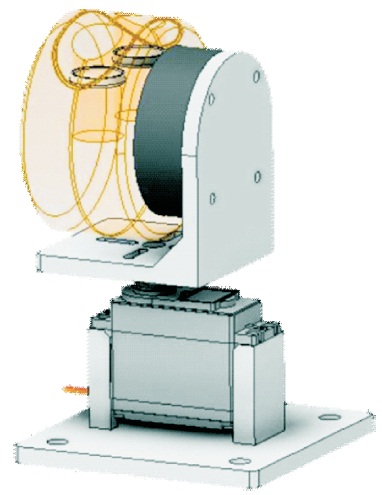
Figure 1. The 3D Printed Frame for the Device
LiDAR technology is a common technique used to perform remote mapping of an area. The LiDAR sensor uses a pulsed laser to measure the distance from it to an object. In this paper, the performance of a 3D scanning by using a 2D LiDAR sensor is implemented. A Scanse Sweep LiDAR sensor (2D) has been mounted on a frame and a servo motor has been used as the base of the device to perform scan on each plane of the environment, in order to achieve a 3D scanning/mapping purpose. The data collected from the 2D LiDAR and the angle of the motor are analyzed to produce the 3D point cloud data (PCD) and visualized using a commercial available 3D visualizer.
LiDAR technology has been growing rapidly with the hardware miniaturization. The big potential applications of LiDAR are in autonomous vehicles, remote sensing, urban planning, space management in a building, and many more (Thompson, 2019). LiDAR stands for Light Detection and Ranging, which uses a pulsed laser to determine the distance from the laser to the object. LiDAR works by sending out pulsed signals and measuring the time taken when the reflected signal from the object is detected by the LiDAR detector. Using the speed of light calculation, the distance can be determined. In this paper, we report on the use of a 2D LiDAR (Leeman, 2017). It is a scanning LiDAR that provides 360 sensing capabilities. A LiDAR sensor has been mounted on a drive motor that rotates the LiDAR sensor and continuously measures the distance from it to the object at different angles, and then the collected data will be used to provide a map of the 2D plane of the environment as shown in Figure1.
Figure 1. The 3D Printed Frame for the Device
To make the communication between the computer and the Arduino easier, Firmata protocol has been used to provide a shared language that can communicate with both the software and the hardware. It functions as a hostclient system where the microcontroller acts as the client, and a more powerful device like a computer acts as the host communicating via a channel such as WiFi, Bluetooth, or USB connection. Firm at a makes the input and output pins of the Arduino board accessible via serial communication (Thakoor, 2017).
The objective of this research is to perform a 3D mapping of the environment by using a 2D LiDAR device. The geometry of the environment and the objects that are presented in the scanning environment can then be further studied by viewing it on the computer. The PCD of the scanned environment can be used to develop various applications.
Some similar researches were conducted by other researchers. Schadler et al. (2013) have presented multiresolution surfel mapping and real-time pose tracking by using a continuously rotating 2D laser scanner. They utilized a lightweight 2D LiDAR scanner as the sole sensor for 3D environment mapping and 6 DoF tracking of a mobile robot. A Hokuyo UTM-30LX-EALiDAR scanner has been mounted on a slip-ring motor to rotate the scanner for environment mapping and tracking. While performing a scan, the laser is rotated at the speed of 1/15 Hz to ensure a dense PCD can be generated. Next, a higher speed of 1 Hz has been used to ensure precise tracking during navigation.
Furthermore, Li et al. (2015) have successfully performed a 3D modeling of the indoor environment by the fusion of data from a 2D LiDAR scanner and a camera. The device will sweep vertically for 180° to let the LiDAR capture the dimension of the environment, while the camera will take 3 photos from the left to the center and the right. A panorama image has been generated by stitching those pictures together. Next, fiducial target based extrinsic calibration has been used to acquire the extrinsic transformation matrices for the LiDAR and the camera that were mounted rigidly on a turret servo. The matrices were then used to match the color images from the camera with the intensity images from the LiDAR to generate a 3D color point cloud.
Moreover, Ocando et al. (2017) have implemented autonomous 2D SLAM and 3D mapping of an environment using a single 2D LiDAR and ROS. They designed and 3D printed a servo controlled gimbal to hold the Hokuyo URG- 04LX-UG01 LiDAR scanner. The gimbal has been placed above an Amigo-Bot and a Raspberry Pi3 packed with ROS has been used to control the system. The device can perform a 2D SLAM and 3D environment mapping. A 2D SLAM ROS node has been used while the robot autonomously navigate through space, but when the 3D mapping command has been sent, the 3D Octomap ROS node will instruct the robot to stop for a 3D mapping to be performed.
Consequently, Wang (2013) has conducted a comprehensive survey on 3D building modeling by using images and LiDAR. This survey covered the methods from 1988 to 2013. From his study, the existing methods are categorized into 3 categories, which are 3D reconstruction from images, 3D modeling using range data from the LiDAR, and 3D modeling using both images and range data. The 2 types of 3D environment mapping by using range data are aerial LiDAR and mobile LiDAR. Next, Wang (2013) mentioned that range segmentation is important in generating 3D models. Range segmentation in 3D modeling can be classified into 3 types, which are edge-based, region based, and hybrid. The hybrid method will combine the strengths of both methods (Chen, 2007; Chen & Stamos, 2007).
Zhao and Shibasaki (2001) have implemented two 1D laser scanners that were mounted on the roof of a vehicle, where one scanner scans the horizontal plane, while the other one scans the vertical plane. A 3D model has been then reconstructed by registering the vertical and horizontal scans based on flat terrain assumptions. As a comparison between aerial and mobile LiDAR, mobile LiDAR can capture street-level details where aerial cannot, but mobile LiDAR is more prone to data noise and in consistency. Hence, a combination of data from aerial and mobile LiDAR can result in complete building models.
Mobile LiDAR scanning is stationary, so to get a “complete” scan of a specific environment, multiple scans are needed in different locations of the environment. The scans from different location are combined to get the PCD of the environment. Besl and McKay (1992) have proposed a method that is based on Iterative Closest Point (ICP) algorithm which needs only one procedure to compute the closest point on a geometric entity to a given point. This method is accurate and capable of handling registration of 3D shapes including surfaces and freeform curves.
A laptop has been used to perform conversion of data collected from the Scanse Sweep LiDAR to generate a point cloud of the environment as shown in Figure 2. The laptop has been connected to the Scanse Sweep and the Arduino Uno. The Sweep LiDAR has been mounted on a frame and, it has been rotated 90-degree from the horizontal plane to capture the vertical 2D plane of the environment. Next, an MG995 servo motor has been used as the base motor of the device to turn the LiDAR sensor for each vertical plane of the environment. Arduino has been loaded with the Firmata protocol for the ease of data conversion. The mechanical setup of the LiDAR and its interface to other modules are shown in Figures 1 and 2.
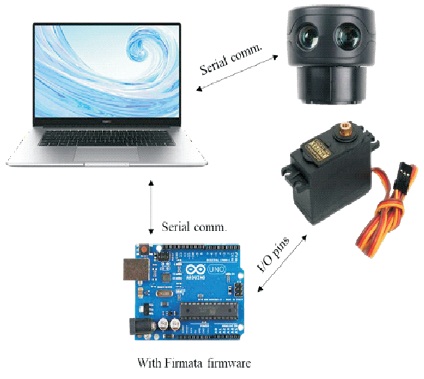
Figure 2. Interface of the Components
Python programming language has been used to communicate with the LiDAR device and Arduino Uno. A rotation matrix has been calculated with the base angle of the servo motor and the mounting angle of the LiDAR device provided as Euler angles. Next, dot product has been performed between the converted cartesian coordinate, and the rotation matrix for every base angle turned. The point cloud data (PCD) has been stored in a CSV file with the format that can be viewed by using the Sweep Visualizer.
The rotation speed of the LiDAR sensor has been set to 3 Hz while the sample rate of the LiDAR sensor has been set to 500 Hz. Unmeaningful data such as distances extreme, angular window (the angle at the base of the LIDAR device) and unordered samples from the LiDAR device has been removed. Equations (1), (2), (3), and (4) is for each of the axes in the rotational matrix (Weisstein, n. d.).
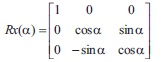
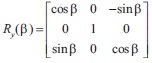
The α, β and γ are the Euler angles that correspond to the yaw, roll and pitch of the system. Where, the mounting angle is provided as α of the device which is -90˚. There is no roll needed, hence it will be set to 0˚. The base angle of the servo will be provided as the -γ of the system to provide an anti- clockwise rotation to each of the planes at the origin.
The point cloud data (PCD) has been stored in a comma separated values (CSV) file. The Cartesian coordinates in the homogeneous matrix that has been dotted with the rotation matrix were stored in the CSV file with every base angle turned. Next, the signal strength of the polar coordinate corresponding to the converted coordinate has also been stored in the CSV file. The file can then be viewed by using the Sweep Visualizer software. The distance from the Scanse Sweep to the objects can be measured by using the tape measure tool in the software.
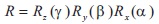
The Scanse Sweep has a distance limitation of 0.1 m to 40 m. For normal operation, the Scanse Sweep will be scanning in 360° direction, which provides a map of the contour of the room that is being scanned. If the scanning has been performed at an open area, only the distance between objects in range will be shown on the map. As shown in Figure 3, the three dots labeled is the person standing 1 meter away from the LiDAR device. The blue dot is where the LiDAR device is located, and it is also the center of origin in the 2D map.
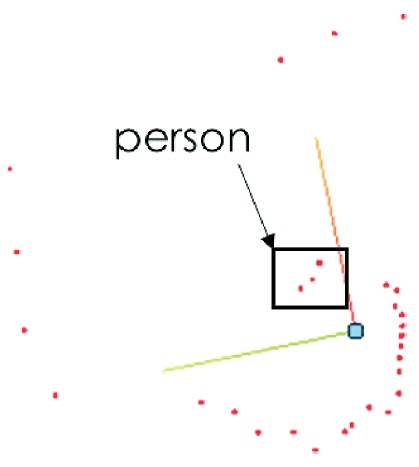
Figure 3. The 2D Map from the LiDAR Device with a Person Standing at the Left Side of the Device
The distance data collected by the LiDAR device is in polar coordinate form, which will be converted to cartesian coordinate if the point cloud data is needed to be computed. Figure 4 shows the 2D map of where the person moves to the right side of the LiDAR device.
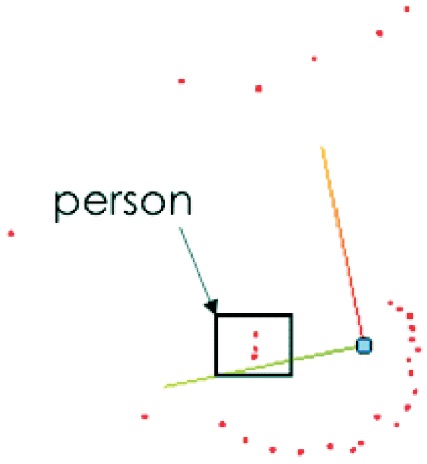
Figure 4. The 2D Map from the LiDAR Device with a Person Standing at the Right Side of the Device
A point cloud can be generated by using a servo motor to provide rotation to the Scanse Sweep to scan at each plane of the environment. A frame has been designed to hold the servo motor at the base, and to mount the Scanse Sweep on to the servomotor as shown in Figure 1. The servomotor will turn 180° to provide as canon 180 planes of the environment. Slower rotation speed and a higher LiDAR sensor sample rate can provide a more detailed scan.
The mounting angle and the base angles of the Scanse Sweep and the base servo has been provided as the alpha and gamma of the Euler angles. Next, a rotation matrix has been calculated with the Euler angles provided. The mounting angle of the Scanse Sweep is -90°, to provide an upright plane in the cartesian coordinate system. The polar coordinates collected by the Scanse Sweep has been converted into cartesian coordinates and stored in an array. Further more, the base servo will turn from 0° to 180°, where the rotation matrix will be calculated for each angle turned, and dotted with the cartesian coordinates array to rotate the plane. Each plane has been written into a CSV file to provide a point cloud of the environment. Distance extremes data were removed so the point cloud looks cleaner. Figure 5 shows the environment that the author performs the scan, and the objects present in the environment were labeled, the author has been standing at the orange box labeled in Figure 5 while the scanning has been performed.
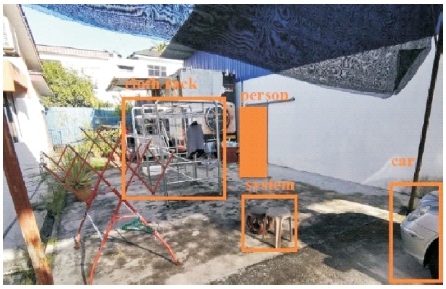
Figure 5. The Environment Where the Scan is Performed with Object Label
Figure 6 shows the point cloud that has been generated after a scan has been performed on the environment. The scanning time varies with the number of times the scan is performed on a single plane and the speed of rotation of the Scanse Sweep. The scan took around 12 minutes to complete. Rainbow color has been used to map the distance between the object to the scanning device, cooler color means the object is close from the device, while warmer color means the object is far from the device.
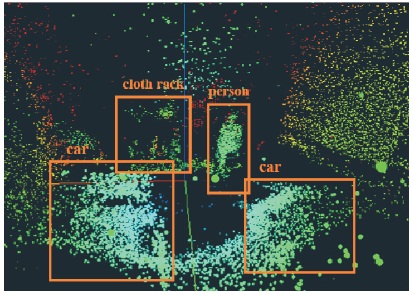
Figure 6. The Point Cloud of the Environment with Object Label
The Sweep Visualizer is a software that has been used to visualize the data collected by the Scanse Sweep. It can also be used to record the data from the device, and the recorded data has been in polar coordinate. Moreover, it is capable of viewing a 3D point cloud file, but the format has to follow the software. When the device is connected, the settings of the device can be changed through the panel in the software.
Table 1 shows some of the PCD that were converted and can be viewed by using the Sweep Visualizer. The signal strength is a 1-byte data that range from 1 to 255, a larger value indicates a stronger signal, where the object will be closer. Figure 7 shows the flowchart of data acquisition and conversion.
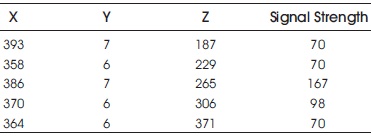
Table 1. Sample Data of Converted Coordinates
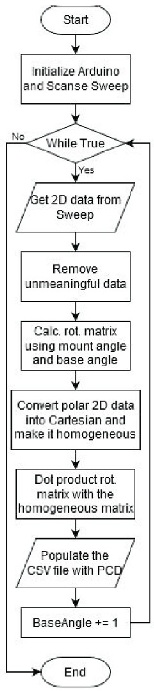
Figure 7. Flowchart of Data Acquisition and Conversion
A 2D LiDAR device has been transformed into a 3D environment scanning LiDAR device which is capable of generating point cloud data (PCD) of the environment where the scan has been performed. The resolution of the scan can be adjusted by the rotation speed and sampling rates of the LiDAR device. Lower rotation speed and higher sample ingrates result in a more detailed point cloud.