Introducing Tri–Factor Analysis: A Model and Statistical Test of Performance, Efficacy, and Content for Electronics and Digital Learning Ecosystems
James Edward Osler II
Faculty member, Department of Curriculum and Instruction, North Carolina Central University (NCCU) School of Education, USA.
Abstract
This monograph provides an epistemological rational for the novel “Tri–Factor Analysis” statistical model and metric. This new statistic is an innovative and in–depth way of investigating the overall effectiveness of teaching and learning in digital learning environments and Ecosystems. Tri–Factor Analysis is grounded in the Eduscience (Osler, 2013a) Tri–Factors of: Performance, Efficacy, and Content. Along with the Tri–Squared Test (first introduced in the Journal on Mathematics) it is a mathematically–grounded analytical methodology designed to provide educators with quantitative tools, metrics, and analytics that aid in pedagogical (and andragogical) investigation. The use of the Tri–Factor Analysis methodology also adds value to educational inquiry that has been formatted as an eduscientifically–engineered research design that involves the critical analysis of overall classroom and individual learning in digital learning Ecosystems.
Keywords :
- Analytics,
- Digital Learning Environments,
- Digital Learning Ecosystems,
- Instrument,
- Investigation,
- Invariant,
- Mathematical Model,
- Outcomes,
- Post Hoc,
- Research,
- Static Test,
- Statistics,
- Trichotomy,
- Tri–Coordinate Product,
- Tri–Factor,
- Triple–I,
- Tri–Squared Test.
Introduction
The advent of digital learning has greatly challenged and changed traditional learning environments. Novel forms, measures, and models are now needed that carefully and effectively describe the digital learning landscape. These tools are needed by electronic engineers, innovative educators, and instructional systems designers to create digital learning platforms that ensure instructional efficacy. A new “Digital Learning Ecosystem” is needed. The general scientific definition of an “Ecosystem” is a biological community of organisms that interact with each other and the physical environment in which they inhabit. A “Digital Learning Ecosystem” is a novel approach to describing, defining, and modelling within the learning environment. This paper proposes a novel “Digital Learning Ecosystem” with an associated innovative measure of “efficacy” called “Tri–Factor Analysis”. The new “Digital Learning Ecosystem” is grounded in the discipline of “Eduscience” (Osler, 2013b) . The digital ecosystem is designed to include: online learning; the use of multimedia; and the application of learning systems designed in an electronic environment. The next section begins the process of describing the Tri–Factor Analysis methodology through equations and calculations. This is followed by two holistic eduscience models (see Figures 4 and 5 respectively) that are used to define the “Digital Learning Ecosystem”. In section 1, the first example of Tri–Factor Analysis occurs and its trichotomous format is used to describe “Natural Electronic Wave–Forms” for the purpose of illustrating how the mathematical “Law of Trichotomy” has practical utility.
1. Using Tri–Factor Analysis Trichotomous Formatting for Natural Electronic Wave–Forms
In terms of electronic frequency (in expressions of the three types of natural energy–wave transference) Trichotomous–Factor Analysis trichotomous format [as the specified trichotomous variables: “a.)”; “b.)”; or “c.)”] is applied in the following manner:
- a.) Transverse Electronic Wave Pattern (“Latitudinal Waves”, “Up and Down Waves”, or “Above and Below Waves”) =
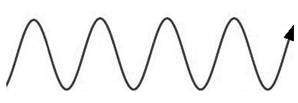 (as shown in a wave oscillation);
- b.) Transitional Electronic Wave Pattern (“Longitudinal Waves” or “Left to Right Waves” or “Side to Side Waves”) =
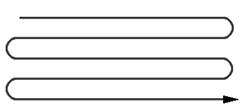 (as seen in many types of crystalline structures); and
- c.) Torsional Electronic Wave Pattern (“Twisting Waves” or “Rotating Waves” or “Vortex Waves”) =
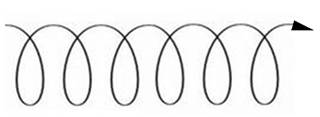 (as displayed in a deoxyribonucleic acid helix). This illustrates how the law of trichotomy is applied (thereby providing three different choices) within the same subject matter, in this case “Naturally occurring Electronic Wave–Forms” that may be used to describe how power or data is transferred in an electronic environment.
2. Tri–Factor Analysis Final Outcomes
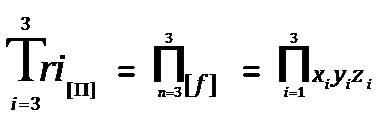
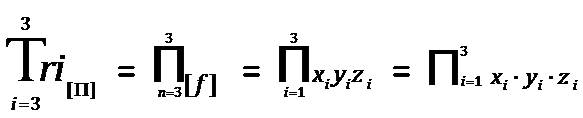
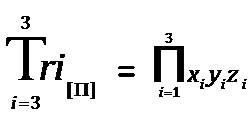
Tri–Factor Analysis can be measured in three different overall researchable outcomes. The first possible comprehensive research outcome is entitled, “Focused Plus One Delta (or Sub–Delta)” = [+1 Δ ], where “sub–delta” or “Δ” is equal to a “Positive Upward Incline”. Alternatively the second collective research outcome is entitled, “Focused Minus One Nabla (or Sub–Nabla)” = [–1∇ ], where “sub–nabla” or “∇ ” is equal to a “Negative Downward Decline”. Lastly, the final all-inclusive research outcome is entitled, “Focused Empty Zero Vacant (or Sub–Vacant)” = [0⍁ ], where “sub–vacant” or “⍁” is equal to an “Absolute Null Outcome” or “Zero as Vacant”. The author uses the novel “Vacant” symbol as:“⍁”, to indicate a mathematical “null” or an “empty result”. The mathematical equation used to calculate the “Total Tri–Coordinate Product of Tri–Factor Analysis” is written as using set product notation [as “ ”] and traditional arithmetic product notation [“
 ”] as follows:
Thus, the equation above is mathematically defined as, “The Total Tri–Coordinate Product at three Tri–Factors is equal to the Product of the index starting with first Tri–Factor and ending with the third Tri–Factor for x, y, and z”. To further understand the unique mathematical relationship that exists between the three Tri–Factors (and their respective Cartesian coordinates) the equation can be further computationally defined as follows:
The mathematical calculation used to determine a specific Tri–Factor Analysis is detailed in the next series of operations.
3. Defining Tri–Factor Analysis Equation Elements
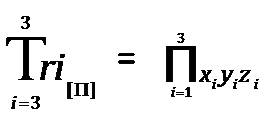
The “Total Tri–Coordinate Product of Tri–Factor Analysis” is defined in the next sequence of definitions (for the specific purpose illustrating clarity and equation element relationships). Thus,
is defined as
Where each individual product (of the respective Tri–Factors are “x”, “y”, and “z”). The elements of this equation are mathematically calculated in the following sequential order:
 = The Tri–Factor “Performance” [by the Student, Learner, or Participant] (is equivalent to Cartesian Coordinate “x”or rectilinear abscissa which is equal to the “x–Tri–Factor ” on the Tri–Coordinate Progression Measurement Scale);
 = The Tri–Factor “Efficacy” [by the Instructor, Faculty, or Teacher] (that is equivalent to Cartesian Coordinate “y” which is equal to the “y–Tri–Factor” or rectilinear ordinate on the Tri–Coordinate Progression Measurement Scale); and
 = The Tri–Factor “Content” [that is delivered by the Instructor, Faculty, or Teacher to the Student, Learner, or Participant] (is equivalent to Cartesian Coordinate “z” which is equal to the “z–Tri–Factor” rectilinear applicant on the Tri–Coordinate Progression Measurement Scale).
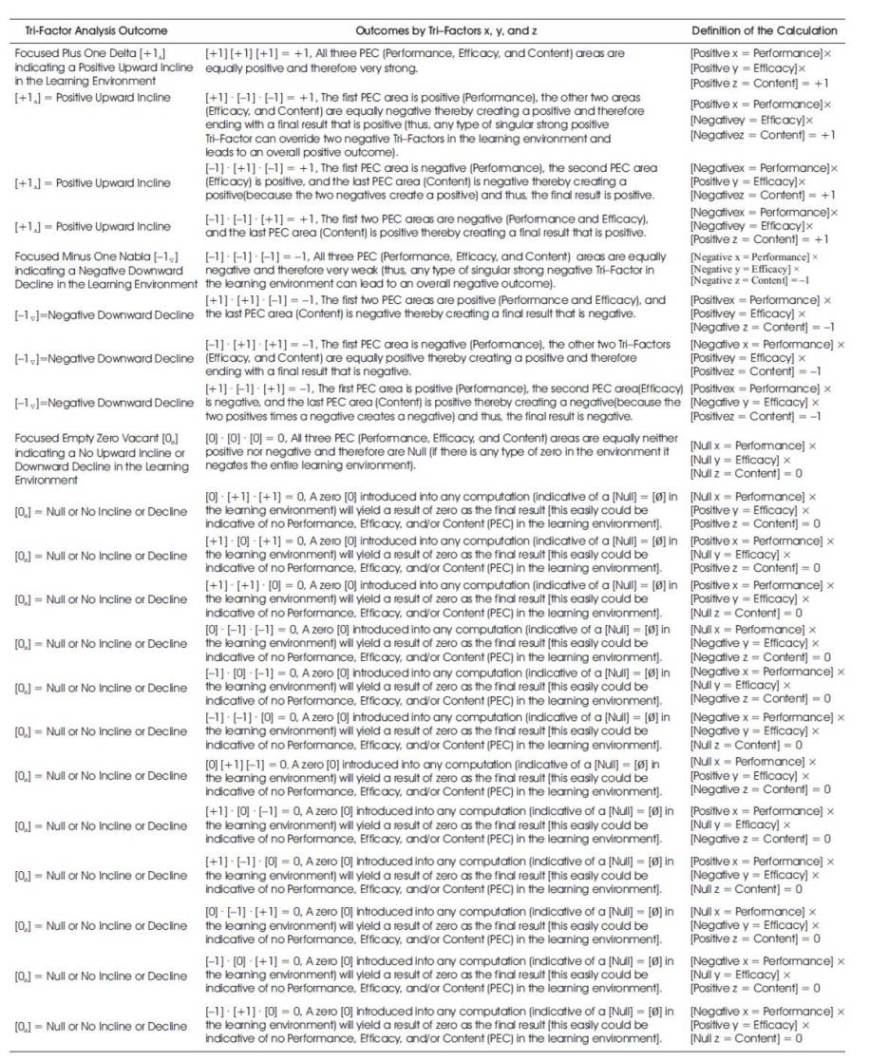
It is important to note that in Tri–Factor Analysis all factors in the digital learning ecosystem environment must be holistically focused on an overall positive outcome = [+1]* [+1]* [+1] = +1). Any negative [–1] or null [0] interjected into the environment will bring about a negative outcome or non–effect (as zero). This means that the learning environment in terms of “PEC” (“Performance”, “Efficacy”, and “Content”) is extremely sensitive to any type of negative or non–effect and must be maintained as positive at all times to have a positive inclination indicating sustained growth and increase in all of the aforementioned “Digital Learning Ecosystem” [defined as “PEC” factor (see Figure 4)] areas. This is clearly illustrated in Table 1. Definitions of the outcomes highlighted in Table 1 appear in Table 2 that immediately follow.
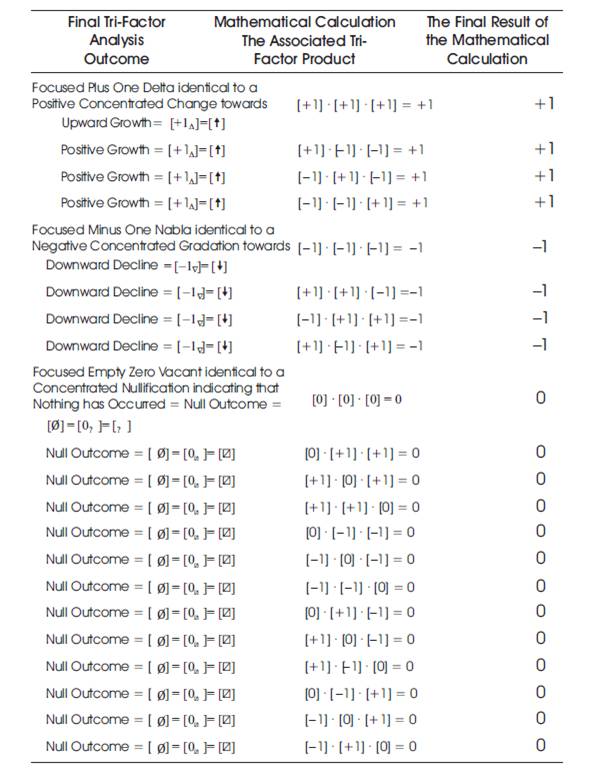
Table 1. Total Tri–Coordinate Product of Tri–Factor Analysis Outcomes that are[+1Δ ], or [–1 ∇ ], or [0 ⍁] indicating [+1Δ ] ≠ [–1 ∇] ≠ [0 ⍁]
Table 1 provides all of the possible Tri–Factor outcomes in a comprehensive columnar list. The first column includes all of the “Tri–Factor Analysis Outcomes”. The possible outcomes of a Tri–Factor Analysis are:[+1 Δ]; [–1∇ ]; or [0 ⍁ ] (that also indicate: [+1Δ ] ≠ [–1 ∇ ] ≠ [0 ⍁] respectively). The second column contains the actual Tri–Factor equation used to determine the final outcome of the analysis. The third and final column displays the final “Tri–Factor Analysis Product”. Table 2 follows and displays the “Total Tri–Coordinate Product of Tri–Factor Analysis”.
Table 2. Total Tri–Coordinate Product of Tri–Factor Analysis Definitions of Outcomes that lead to [+1Δ], [–1∇] or [0⍁]
Table 2 illustrates and defines all of the possible Tri–Factor outcomes in a comprehensive triple columnar list. The first column includes and defines all of the final “Tri–Factor Analysis Outcomes”. The second column contains the complete comprehensive definition of all of the actual Tri–Factor equations used to determine the final outcome of the Tri–Factor Analysis. The third and final column displays the mathematical definition for the final “Tri–Factor Analysis Product”.
4. Tri–Coordinate Product of Cartesian Vector Graphing
In Tri–Factor Analysis the Tri–Coordinate Product of Cartesian Vector Graphing can be used to illustrate the precise trajectory of a Tri–Factor Analysis in terms of Eduscientific learning environment outcomes in tandem with the final Tri–Factor Analysis outcome of: [+1Δ ], [–1 ∇ ], or [0⍁ ]. The representation of the “real world” result of a  analysis is illustrated in the first positive octant of a tri–coordinate “triplanar” graph (due to actual, tangible, and authentic Eduscience effects). The Tri–Factor Analysis graphic representation is measured in the following form (where, x = [P] or “Performance”, y = [E] or “Efficacy”, and z = [Content] or “Content”):
In the case of this particular vector graphical modular form (presented as Figure 1), the digital learning ecosystem as an “eduscientist” (Osler, 2013b) is an instructional design researcher that must be aware of the final conclusive result as a “Final Rectilinear Outcome” based on the Total Tri–Coordinate Product of Tri–Factor Analysis Definitions of Outcomes that lead to a “[+1 Δ ]”;“[–1 ∇ ]”; or a “[0⍁ ]” as presented in Table 2. Thus, the three possible outcomes of Tri–Factor Analysis in terms of the Tri–Coordinate Product of Cartesian Graphing are represented graphically (in terms of [+1Δ ], [–1 ∇ ] or [0⍁ ]) as follows (Figure 2) :
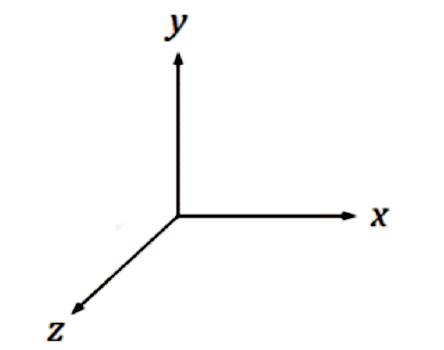
Figure 1. The Tri–Factor Analysis Cartesian Vector Graphic Tri–Coordinate Model
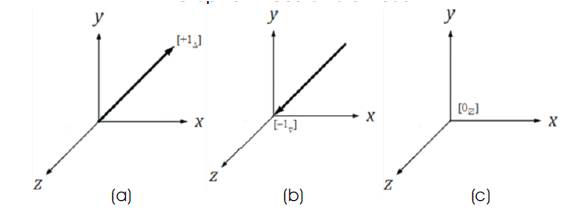
Figure 2. The Tri–Factor Analysis Cartesian Vector Graphic Tri–Coordinate Model[a. through c.] Illustrating a “Final Rectilinear Outcome” to Determine the Overall Practicality of the Digital Learning Ecosystem
5. Defining Total Cubic Trichotomous Trajectory Test Mathematical Foundations
In terms of mathematics, Apostol in his book on calculus defined “The Law of Tricohotomy” as: Every real number is negative, 0, or positive. The law is sometimes stated as “For arbitrary real numbers “a” and “b”, exactly one of the relations: (1.) a < b; (2.) a = b;and (3.) a > b, holds (Apostol, 1967). It is important to note that in mathematics, the law of trichotomy is most commonly the statement that for any (real) numbers x and y, exactly one of the following th relations holds. Until the end of the 19 century the law of trichotomy was tacitly assumed true without having been thoroughly examined (Singh, 1997). A proof was sought by Logicians and the law was indeed proved to be true. If applied to cardinal numbers, the law of trichotomy is equivalent to the axiom of choice. More generally, a binary relation R on X is trichotomous if for all x and y in X exactly one of xRy, yRx or x = y holds (Osler, 2013b). If such a relation is also transitive it is a strict total order; this is a special case of a strict weak order. For example, in the ≠ ≠case of three elements the relation R given by: (1.) aRb; (2.) aRc; and (3.) bRc is a strict total order. While the relation “R” is given by the cyclic “aRb, bRc, cRa is a “non–transitive trichotomous relation” (Sensagent, 2012).In the definition of an ordered integral domain or ordered field, the law of trichotomy is usually taken as more foundational than the law of total order, with y = 0, where 0 is the zero of the integral domain or field. In set theory, trichotomy is most commonly defined as a property that a binary relation “<” has when all its members  satisfy exactly one of the relations listed above. Strict inequality is an example of a trichotomous relation in this sense. Trichotomous relations in this sense are irreflexive and antisymmetric (Sensagent, 2012).
6. The Total Cubic Trichotomous Trajectory Test [Tri3Traj ] for Tri–Factor Analysis
The test of the Tri–Factor Analysis Outcomes is a vector that has both magnitude (size) and direction and it is represented in a tri-coordinate “vector graph” (this is similar to a regression line in traditional statistical measures, however this line does not refer to mean squares and has three Cartesian coordinates instead of two). The vector graph uses geometric primitives (which are Cartesian coordinate: points, lines, and arrows) to illustrate the final outcome of a Tri–Factor Analysis in terms of “Trajectory” (where the term “Trajectory” is defined here as the “Cubic Product of the Total Trichotomy of Tri–Factor Analysis”). This same vector graphic is used to clearly illustrate “Total or Complete Eduscience Proficiency” in terms of the three Tri–Factors of: “Performance”, “Efficacy”, and “Content” in terms of “Faculty”, “Students”, and “Content” in the learning environment under analysis. The Total Cubic Trichotomous Trajectory Test for Tri–Factor Analysis is similar to the infrastructure of the mathematical hypothesis format that is used in more traditional “classical” or “frequentist” statistical methodology.
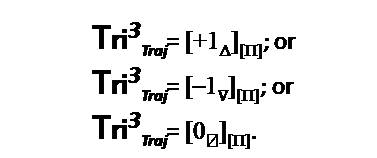
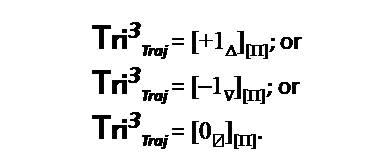
However, the Total Cubic Trichotomous Trajectory Test differs in several aspects. Primarily, it is “trichotomously trinary”. This means that the specific outcomes of the test are determined according to the “mathematical law of trichotomy” (Apostol, 1967). Therefore, this particular test has one of three possible outcomes ([+1Δ ], [–1∇ ] or [0⍁]). Thus, the Total Trajectory Test for Tri–Factor Analysis has the following mathematical format:
Total Cubic Trichotomous Trajectory Test = [+1Δ ] ≠ [–1 ∇] ≠ [0 ⍁].
Thus, the Final Outcome of the Tri–Factor Analysis is trichotomously (similar to a more traditional classical statistical hypothesis test) one of the following:
The Tri–Squared Test instrumentation [referred to as an “Inventive Investigative Instrument” (Osler, 2012)] can be parsimoniously called a “Tri–Factor Triple I”. The “Tri–Factor Triple I” is used to acquire data and the subsequent mathematical formulae are used to conduct the Total Cubic Trichotomous Trajectory Test for Tri–Factor Analysis and are represented in Figure 3.
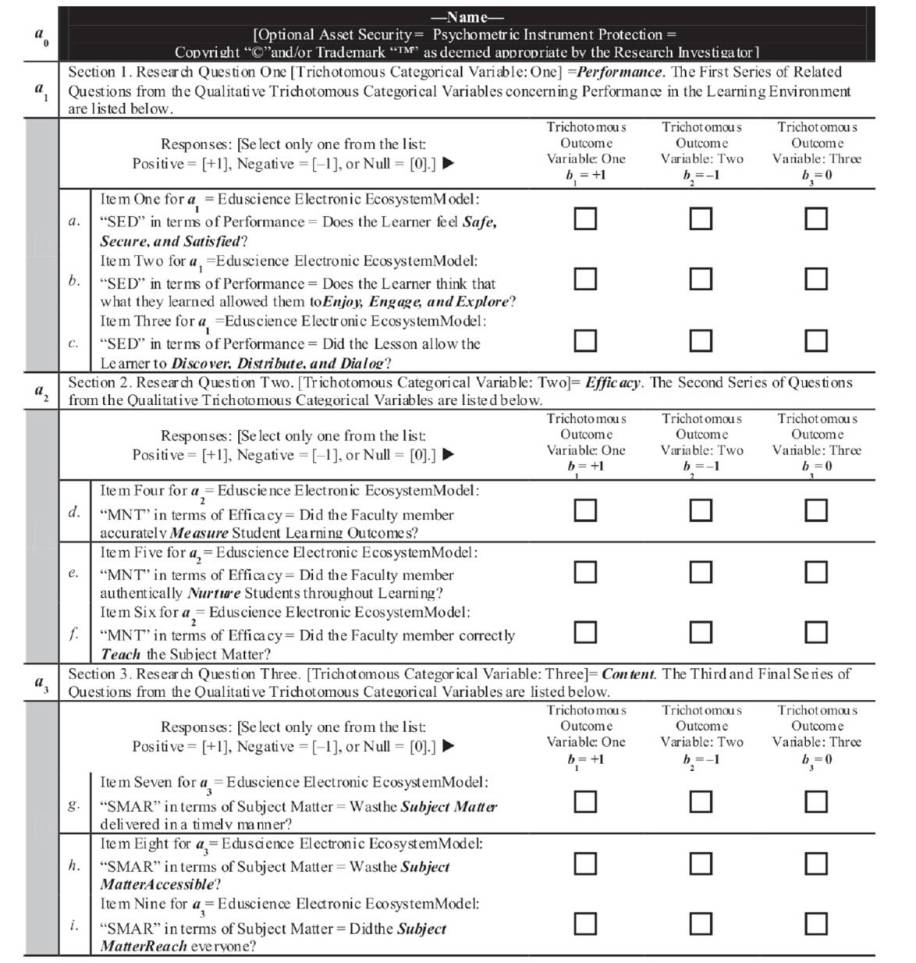
Figure 3. Tri–Factor Analysis as an Eduscience Electronic EcosystemTri–Squared Test Inventive Investigative Instrument [or “Tri–Factor Triple–I”]
Figure 3 provides the Invariant Model for a Tri–Squared Test Triple–I instrument that could be used in a Tri–Factor Analysis. This is an example of Tri–Factor Analysis as an “Eduscience Electronic Ecosystem Tri–Squared Test Inventive Investigative Instrument” [or “Tri–Factor Triple–I”] measurement instrument [or “ Metric”] that is trichotomously invariant [or unchanging] (Osler, 2013a) .
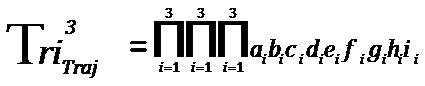
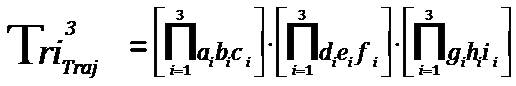
7. The Calculation Process Used to Determine the Holistic or “Collective” Outcome from the Tri–Factor Triple–I
The trinary mathematical calculation for the Tri–Factor Analysis research instrument (the Tri–Factor Triple–I) is the Eduscience Electronic Ecosystem “Trinary Trajectory Test” or a “Triple Tri–Factor calculated on the Tri–Factor Triple–I”. This will ultimately yield a Tri–Factor Analysis“ Triple Product” (or the Cubic Total for the Trichotomous Trajectory Test) of the Trinary Trajectory Test which is calculated using the following equations:
The two models that follow (presented in Figures 4 & 5 respectively) graphically illustrate via cyclic digital learning models precisely how the Eduscience Electronic Ecosystem Tri–Factors are used collaboratively and with systemic efficacy in the Digital Learning Ecosystem measured for “overall efficacy” using the Tri–Factor Analysis approach.
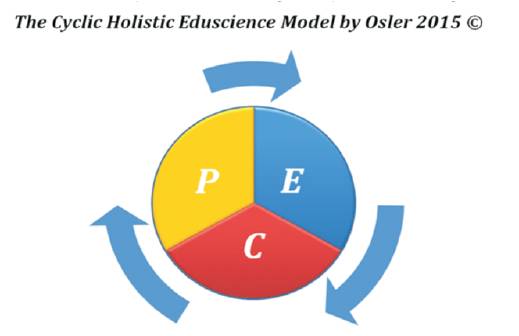
Figure 4. The Eduscience Digital Ecosystem Education Model
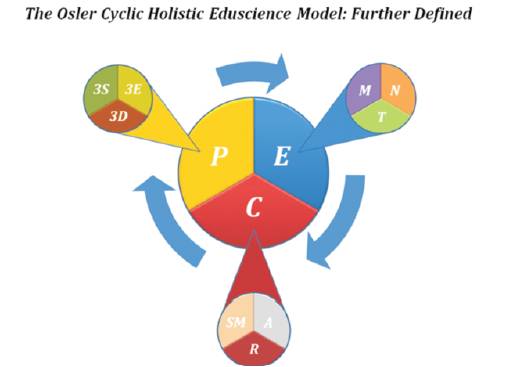
Figure 5. The Digital Learning Environment Eduscience Ecosystem “Within”HolisticModel Featuring the Three Ecosystem Sub–Models: SED; MNT, and SMAR
8. The Digital Learning Ecosystem Model
The Eduscientific Tri–Factor Analysis on the “Holistic Eduscience Electronic Ecosystem Model” (present in Figure 4) concisely explains and defines the three independent but cohesive factors (of Performance = P; Efficacy = E; and Content =C) that comprise the application of Eduscience in the digital learning environment. This parsimony of triple holistic factors specifically establishes what must be accomplished in the learning environment by the student and faculty to ensure successful learning. It also defines how the subject matter must be presented for effective teaching and continuous learning to occur. This model is “systemically cyclic”, meaning that it is continuously rotating indicating a continuous growth process that illustrates how each factor relies on the other factor thus creating a cycle of system independent interdependence within the system. Due to this “digital learning engine” no one factor can be effective without the other. The illustrated model can be further broken down into the specific sub–models that are contained within each of the three electronic eduscientific factors. Figure 5 follows and displays the specific Eduscience sub–models (contained within each of the individual PEC factors). Each of the sub–models is carefully, critically, and holistically analyzed during Tri–Factor Analysis (see Figure 3).
The “Eduscience Holistic Model” further defines the previous model (presented in Figure 5) by illustrating each of the three sub–models that are inherent in each of the three core factors (PEC) of the initial “Eduscience Model”. This model also defines the three trichotomously separate but also cohesive factors of: Performance = P; Efficacy = E; and Content =C (in terms of their three separate but equal sub–models that are: Performance = P = “SED”; Efficacy = E = “MNT”; and Content = C = “SMAR”. The three sub–models are comprised of the following: SED = “Safe, Secure, and Satisfied” + “Enjoy, Engage, and Explore” + “Discover, Dialog, and Distribute”; MNT = “Measuring, Nurturing, and Teaching”; and SMAR = “Subject Matter, Access, and Reach”. The application of the sub–models is an exemplary example of “Applied Eduscience” in the learning environment. The parsimony of the sub–model explicative factors within sub–factors specifically illustrates the various components that must be applied to create efficacy at all levels within the digital learning environment. As such, all sectors and stakeholders involved in teaching and learning now have an outstanding model of “applied efficacy” that can be replicated and accurately measured (using Tri–Factor Analysis).
9. Methodology: A Sample Application of Tri–Factor Analysis
In the Methodology of Tri–Factor Analysis the following Sample Hypotheses would be used in a sample study:
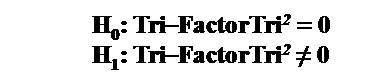
Tri–Factor Tri 2H0 : There are no significant differences in the perception of the use of the PEC: Eduscience Digital Ecosystem Education Model by Distance Education [DE] Faculty for 2015 courses in comparison to the current DE Ecosystem in terms of their overall perception of the utility of the Course Management System [CMS] currently in place at the University.
Tri–Factor Tri 2H1 : There are significant differences in the perception of the use of the PEC: Eduscience Digital Ecosystem Education Model by Distance Education [DE] Faculty for 2015courses in comparison to the current DE Ecosystem in terms of their overall perception of the utility of the Course Management System [CMS] currently in place at the University.
The aforementioned Post Hoc Research Hypotheses yield the following mathematical hypotheses using the Tri- Squared Test as the Post Hoc data analysis procedure:
Tri–Factor Analysis Tri–Squared Test Sample Mathematical Hypotheses
In applying Tri–Factor Analysis a Tri–Squared Test is conducted to determine the viability, verifiability, and validity of the aforementioned “Eduscience Holistic Model” using Figure 3 Eduscience Electronic Ecosystem Tri–Squared Test Inventive Investigative Instrument [or “Tri–Factor Triple–I”]. The table that follows (see Table 3) provides sample data in a Standard 3 × 3 Tri–Squared Table format (Osler, 2012) for the purposes of conducting a Tri–Factor Analysis.
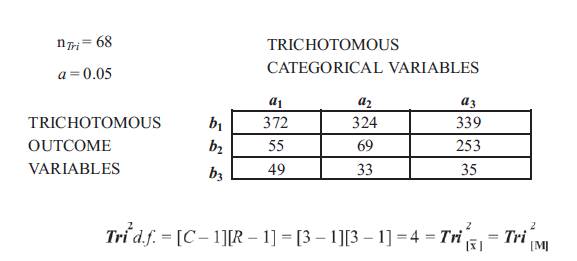
Table 3. Sample Data Tri–Factor Analysis Tri- Squared Test Analytics
Post Hoc Data Analyzed Using the Trichotomous-Squared Test Three by Three Table is designed to analyze the research questions from the Mind Garden Leadership Efficacy Questionnaire with the following Trichotomous Categorical Variables: a1 = P = SED; a2 = E = SMAR; and a3 = C = MNT. The 3 × 3 Table has the following Trichotomous Outcome Variables: b1= Maximum (A High Level of Confidence) = [+1Δ ]; b2= Minimum (A Low Level of Confidence) = [–1∇ ]; and b3 = Moderate (A Medium Level of Confidence) = [0 ⍁]. The Inputted Qualitative Outcomes are reported.
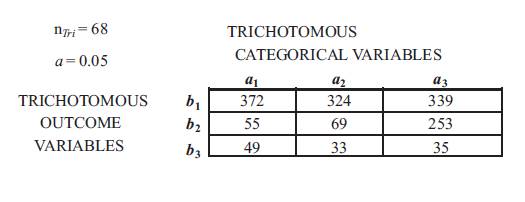
The PEC Tri–Factor Analysis Sample Data Tri–Squared Test determined the alternative hypothesis: the null hypothesis (H0) is rejected at p> 0.05 is 9.488 for nTri = 68. There are significant differences in the perception of the DE Faculty in terms of the following Trichotomous Categorical Variables: a1= P = SED; a2 = E = SMAR; and a3= C = MNT. The 3 × 3 Table has the following Trichotomous Outcome Variables: b1 = Maximum (A High Level of Confidence) = [+1 Δ ]; b2 = Minimum (A Low Level of Confidence) = [–1∇]; and b3= Moderate (A Medium Level of Confidence) = [0⍁]. Trichotomous Outcome Variables overwhelmingly selected “Moderate” = a1b1=372, as opposed to other variables: a 2b1= 324, and a3b1= 339. Thus, the Alternative Hypothesis is accepted as, H1 : There are significant differences in the perception of the use of the PEC: Eduscience Digital Ecosystem Education Model by Distance Education [DE] Faculty for 2015 courses in comparison to the current DE Ecosystem in terms of their overall perception of the utility of the Course Management System [CMS] currently in place at the University.
As a result of the aforementioned Tri–Factor Analysis Tri–Squared Test, the Total Cubic Trichotomous Trajectory Test of the Sample Data is based upon the Total Cubic Trichotomous Trajectory Test = [+1Δ ] ≠ [–1 ∇] ≠ [0 ⍁] (as calculated and detailed in Figure 2). Thus, the Outcomes of the Tri–Factor Analysis are mathematically represented as follows:
Tri–Factor Analysis Sample Data Trichotomous Outcomes
Thus, the results are determined as follows:
The Total Tri–Coordinate Product of Tri–Factor Analysis
 is defined using the sample data as
= The Tri–Factor “Performance” [by the Student, Learner, or Participant, according to the sample data] (is equivalent to Cartesian Coordinate “x” or rectilinear abscissa which is equal to the“x–Tri–Factor” on the Tri–Coordinate Progression Measurement Scale) = [x–Tri–FactorActual Value Yield] = 372 324 339 = 40858992 for [+1 Δ] (focused plus one delta);:
= The Tri–Factor “Efficacy” [by the Instructor, Faculty, or Teacher, according to the sample data] (is equivalent to Cartesian Coordinate “ y ” which is equal to the“ y–Tri–Factor ” or rectilinear ordinate on the Tri–Coordinate Progression Measurement Scale) = [y–Tri–Factor Actual Value Yield] = 55 69 253 = 960135 for [–1∇ ] (focused negative one nabla); and
= The Tri–Factor “Content” [that is delivered by the Instructor, Faculty, or Teacher to the Student, Learner, or Participant, according to the sample data] (is equivalent to Cartesian Coordinate “z” which is equal to the“ z–Tri–Factor ” rectilinear applicant on the Tri–Coordinate Progression Measurement Scale) = [z–Tri–Factor Actual Value Yield] = 49 33 35 = 56595 for [0⍁] (focused empty zero vacant).
Clearly the results show in terms of [+1Δ ] ≠ [–1 ∇] ≠ [0⍁ ] that the sample data research outcomes extracted from the Tri–Factor Analysis (Tri–Squared Test) where, 40858992 ≠ 960135 ≠ 56595 and 40858992 > 960135 > 56595. Thus illustrating that the sample data was overwhelmingly positive or focused as a positive change (focused plus one delta) in regards to the sample data. In addition, values from the Tri–Factor Analysis Inventive Investigative Instrument sample data can be scaled to determine the exact positive, negative, or null values associated with each 3 × 3 table cell for an overall comprehensive and cumulative Tri–Factor Analysis. The scale is 0 = 0 for “null” or “no value”; 1 to 150 for “low” or “negative value”; and lastly, 151 to 300+ for “high” or “positive value”. As such the outcomes from the Tri–Factor Analysis Tri–Square Test are as follows (Table 4):
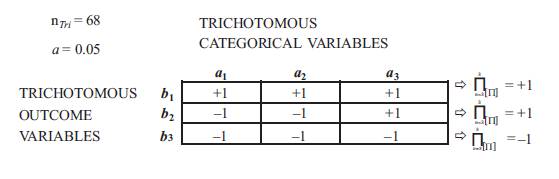
Table 4. The Dual Sample DataSeries of Tri–Factor Analysis Calculations Conducted from the Initial Tri-Squared Test
This then converts to the following Table for the calculation of the “Final Sample Tri–Factor Analysis Calculation”:
The final cumulative calculation to determine the overall Tri–Factor Analysis is the Total Tri–Coordinate Product of Tri–Factor Analysis (Table 5 ). The initial outcomes as listed above yielded the following:
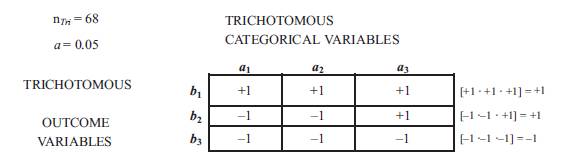
Table 5. The Final Sample Tri–Factor AnalysisCalculation
The final Total Tri–Coordinate Product of Tri–Factor Analysis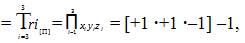 this in turn is equivalent to the following (see Figure 6 and Table 6 that sequentially follow):
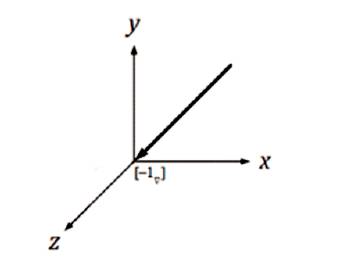
Figure 6. The Final Sample Data Tri–Factor Analysis Cartesian Vector Graphic Tri–Coordinate Model [b.] Illustrating a “Final Negative [Downward] Rectilinear Outcome” to Determine the Overall Use of the Digital Learning Ecosystem Model from Distance Education Faculty
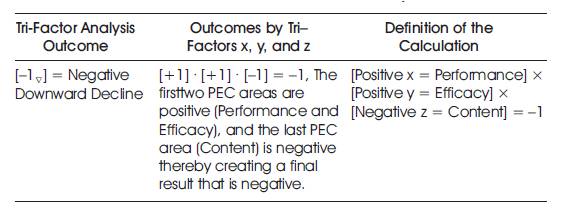
Table 6. The Final Total Tri–Coordinate Product of Tri–Factor Analysis Definitions of Outcomes that lead to [+1Δ], [–1∇] or [0⍁] for the Sample Data
Thus, as Table 6 indicates the final sample data Total Tri–Coordinate Product of Tri–Factor Analysis indicates that there is downward decline in faculty perceptions of the current University CMS [Course Management System] in regards to the use and implementation of the “Digital Learning Environment Eduscience Ecosystem Holistic Model”. This is despite faculty’s overwhelmingly positive perceptions of learner performance in the “Performance” sector of the Holistic Model. Most likely faculty perceive that future iterations of the current CMS can better implement a digital ecosystem that reflects the “Cyclic Holistic Digital Ecosystem Model” however, the preponderance of the evidence leans most towards the negative in accordance with the sample data Tri–Factor Analysis scale.
10. Recommendations
This paper provides an epistemological rational for the novel “Tri–Factor Analysis” statistical model and metric. Additional benefit to the body of research pertaining to Distance Education in terms of information delivery would be gained from exploring the metric in future research. Follow-up studies should be conducted to provide more information regarding this new method of analysis. It is critical that more qualitative data be collected as well to inform researchers of to apply the methodology in their various disciplines as the statistic has broad and flexible use.
In terms of delivery and use in different and multiple fields (that are associated with digital learning), professional development should be conducted on modern psychometrics (Rust& Golombok, 1989) to ensure that faculty and any all associated staff are well equipped to use the metric as the primary method of analysis. For post hoc analysis, Tri–Factor Analysis as a base analytic has the potential to lay the foundational groundwork for use with advanced trichotomous analytic methods that can be found in the field of “Triostatistics” (Osler, 2014). This would add even greater value to the new method of analysis as it would allow for further application of its findings via post hoc statistics that are designed for a more in–depth analysis of trichotomous research and trichotomous investigative methods and their subsequent outcomes through (but not limited to) twelve advanced post hoc statistical calculations.
Conclusion
As mentioned in the introduction section “the advent of digital learning has greatly challenged and changed traditional learning environments”. As such, the novel measures and associated models provided in this narrative are now needed. These measures and models carefully and effectively describe and examine digital learning as an innovative “Digital Learning Ecosystem”. This new ecosystem empowers research engineers, designed to engage creative educators, and allows invention by instructional designers who together are creating and pioneering new and novel digital learning platforms. These individuals now have a systemic and high–powered analysis methodology with an associated sequential, engaging, and interactive model which are designed to ensure quality in instruction and efficacy in learning. Tri–Factor Analysis and the novel “Holistic Eduscience Model” are the new digital learning ecosystem that has in–depth analysis at its core. This new ecosystem is designed to determine and safeguard high quality instruction and learning at all levels in the digital learning environment.
References
[1]. Apostol, T. M. (1967). Calculus, second edition, Volume one: One–variable calculus, with an introduction to linear algebra. Waltham, MA: Blaisdell.
[2]. James Edward Osler (2012). Introducing: Trichotomy–Squared – A Novel Mixed Methods Test and Research Procedure Designed to Analyze, Transform, and Compare Qualitative and Quantitative Data for Education Scientists Who are Administrators, Practitioners, Teachers, and Technologists. i-manager's Journal on Mathematics, 1(3) Jul - Sep 2012 Print ISSN 2277-5129, EISSN 2277-5137, pp. 23-32.
[3]. Osler, J. E. (2013a). The Psychometrics Of Educational Science: Designing Trichotomous Inventive Investigative Instruments For Qualitative And Quantitative Inquiry. imanager's Journal on School Educational Technology, 8(3), Dec-Feb 2013, Print ISSN: 0973-2217, E-ISSN: 2230- 7133, pp. 15-22.
[4]. James Edward Osler (2013). The Psychological Efficacy of Education As A Science Through Personal, Professional, And Contextual Inquiry of The Affective Learning Domain. i-manager's Journal on Educational Psychology. 6(4), Feb-April 2013, Print ISSN 0973-8827, EISSN 2230-7141, pp. 36-41.
[5]. Osler, J. E. (2014). Triostatistics: The Application of Innovative In–Depth Advanced Post Hoc Statistical Metrics for the Assessment and Analysis of Statistically Significant Tri–Squared Test Outcomes. Kentucky Journal of Excellence in College Teaching and Learning, 12 (3), pp. 27–39.
[6]. Rust, J. & Golombok, S. (1989). Modern psychometrics: The science of psychological assessment nd (2 ed.). Florence, KY, US: Taylor & Frances/Routledge.
[ 7 ] Sensagent:Retrieved,May9,2012:http://dictionary sensagent.com/ trichotomy + (mathematics)/en–en/
[8]. Singh, S. (1997). Fermat's last theorem. Fourth Estate.