Figure 1. QAM System
In wireless communication systems, the transmitted signal is subject to different channel impairments, such as noise and multipath propagation. The demand for more reliable and higher speed wireless services has led to the development of digital communication techniques. This new development direction resulted in an increasing interest in new modulation formats that overcome the limitations associated with the wireless communication channel which degrades the performance of the communication system. The new sought modulation formats are expected to have high spectral efficiency and better immunity to transmission impairments. Of these modulation formats are the Quadrature Amplitude Modulation (QAM) and the Orthogonal Frequency Division Multiplexing (OFDM). This paper analyses through computer simulation the performance of: QAM, OFDM and QAM combined with OFDM under different channel impairments and compares which technique gives better performance under these conditions. The analysis was carried out using MATLAB and the results showed that QAM is used to effectively increase the channel capacity while OFDM is attractive because of its effective way in reducing the effect of inter-symbol interference (ISI). Furthermore a combination of these techniques has been proven to enhance the performance of a communication system.
Nowadays, digital communication with its various applications has become an essential tool in everyone's personal life. For example, mobile phones, digital televisions, radios, computers with internet connectivity and fixed telephone lines are all ways of communications. The idea of wireless radio signalling communication was first demonstrated by Guglielmo Marconi in 1897 [1] when he successfully demonstrated a wireless telegraphy system. He was able to communicate with ships sailing across the English Channel. In 1901, he established radio reception across the Atlantic Ocean[2]. In 1914 Fessenden has successfully built electric alternators that were able to transmit voices and music over thousands of miles; and this was the first voice communication over radio waves. This development played an important role during World War I (1914-1918) [3].
In 1957 the first artificial satellite called Soviet Sputnik 1 was launched. In 1960 NASA launched an Echo satellite and since then new wireless communication technologies and methods had been developed by people all around the world[4].
In recent years, the exponential growth of digital wireless communication systems has led to the demand for high speed services with high bandwidth efficiency and Quality of Service (QOS) levels. Currently, the annual revenues for wireless services and equipments around the world have exceeded 1 trillion US dollars with more than 1 billion wireless telephone customers. And since 1994, the wireless industry has been increasing annually by 50% [5]. Considering this increasing demand, a low power, high capacity and low cost wireless techniques became a necessity. Meeting this huge demand is a challenging task especially in harsh wireless environments.
In wireless environments, the transmitted signal may be distorted by several channel impairments. Among these impairments, multipath propagation is the dominant contribution [6]. Multipath occurs when multiple copies of the transmitted signal arrive at the receiver. During transmission from the source to destination, the transmitted signal may be obstructed by large objects such as hills and buildings. As a result, the received signal may consist of a combination of signals that may be attenuated, time delayed or phase shifted. Multipath propagation may cause a related phenomenon known as inter-symbol interference (ISI). In this effect, the previous symbols may overlap with the following symbols, causing distortion to the received signal [7]. Therefore, in order to improve the performance of the received signal in the presence of these channel impairments and to combat the effect of multipath, while achieving high data rates and efficient bandwidth at the same time, new methods have been developed. Considerable research efforts have been going on in this area over the past years in order to develop new efficient wireless services [6]. Some of these techniques include: Quadrature Amplitude Modulation (QAM) and Orthogonal Frequency Multiplexing (OFDM).
Quadrature Amplitude modulation is a multi-level (M-ary) modulation technique which is widely used in modern communication systems where high data rate transmission with efficient bandwidth is required. In M-ary techniques the number of symbols that will be transmitted is less than the number of bits and as a result the bandwidth is compressed. In general terms, QAM is defined as the modulation technique where the information data is conveyed in the amplitude and phase of a single carrier. It is therefore a combination of two modulation techniques M-PSK (M-ary phase shift keying) and M-ASK (M-ary amplitude shift keying). M-ary QAM is represented as a constellation of points in the complex plane (I-Q plane). These constellation points represent the different values that I and Q signals can take, and accordingly the diagram is referred to as a constellation diagram. The number of points in the diagram is generally a power of two (2, 4, 8 …) [8].
The total number of amplitude values that I and Q can take determines the modulation order M.
In communication systems, in order to avoid or decrease the effect of Inter-Symbol Interference (ISI), the symbol period (Ts) should be greater than the delay time [9]. But as the symbol period is inversely proportional to the data rate (R) (Ts= 1/R), having a long symbol period, decreases the data rate, which means inefficient communication. Therefore, one way of making efficient use of the available bandwidth is to divide the bandwidth into a number of closely separated subcarriers, so that data can be transmitted simultaneously at the same time. However, despite the fact that placing the carriers closely to each other makes efficient use of the bandwidth, it leads to an effect know as inter-carrier interference (ICI) [10]. OFDM is a multicarrier modulation technique that addresses both of these issues.
OFDM provides a way of dividing the available bandwidth into a number of closely separated or even overlapped carriers without ICI by using the orthogonality property [11]. It also provides high data rate transmission with long symbol periods, which greatly reduces ISI. Therefore, OFDM may be considered as a strong candidate in broadband, multipath environments. Although the idea of OFDM dates back to the late 1960's, it hasn't been widely used until the last decade[12] when it has become the underlying technology for various applications [13]. Navin Sabharwal, director of residential & networking technologies for Allied Business Intelligence says that: "OFDM-based products span everything from wireless LAN to mobile access to digital television"[14].
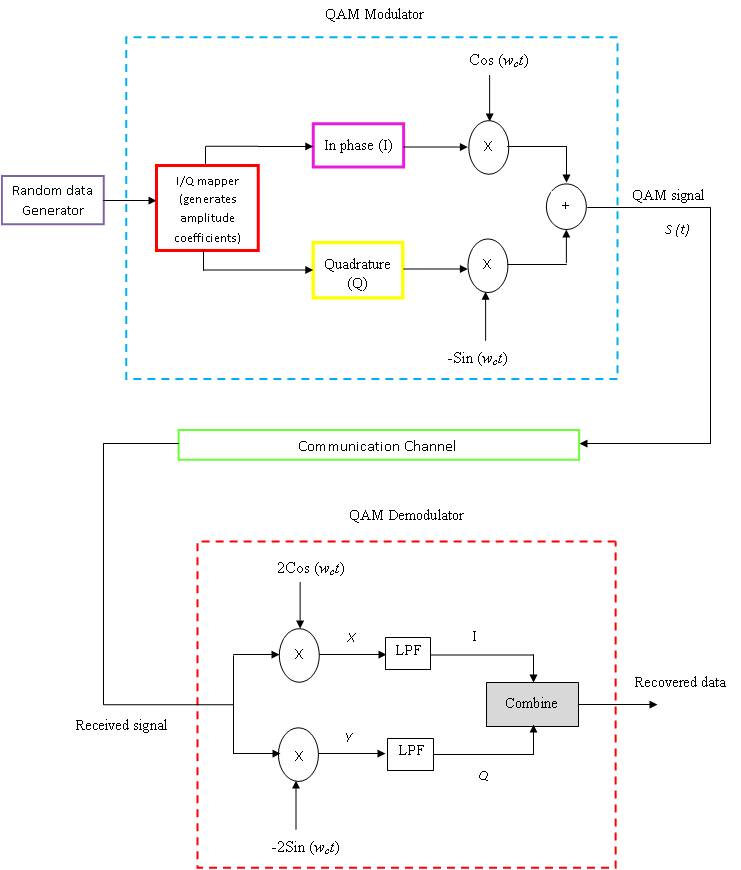
Figure 1 shows the basic structure of a QAM system. The system combines two separate carrier waves whose amplitudes are modulated by the same frequency and are out of phase by 900. Due to this phase difference the carriers are called Quadrature carriers and accordingly the name of the method [15]. For simulation, this system was divided into several stages as shown in Figure 2.
The first step in the simulation was to generate a long sequence of pseudo random binary bits having the values of 0 or 1. The output of the random data generator is shown in Figure 3. The Figure shows the first 20 random binary bits that were generated.
The random data generator output is then input to the QAM Transmitter shown in Figure 4.
Stage 1: First the random binary bits are taken into blocks of b bits according to the chosen modulation order M, where b = log2 M. This process is known as bit to symbol mapping, in which every b bit sequence is mapped to form one symbol. The symbols can take any amplitude value ranging from 0 to M-1. The output of this process, denoted by point (a) in Figure 4, is shown in Figure 5 for M = 16.
Stage 2: The random symbols are then input to an I/Q mapper. The I/Q mapper maps the symbols into the complex notation (I + jQ) as shown in Figure 6 according to the Gray coding method. In Gray Coding, the bits are assigned in such a way that successive symbols differ in only one bit [16].
Stage 3: The last stage in the QAM transmitter involves using an Inverse Fourier Transform (IFFT). The IFFT is used to convert the complex numbers into a time domain waveform that is suitable for transmission over the channel. The complex numbers are assigned serially, one at a time, to the appropriate IFFT bin, including the complex conjugate, and the rest of the bins are set to zero.
Figure 1. QAM System
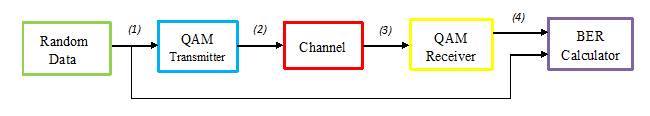
Figure 2. QAM Simulation System
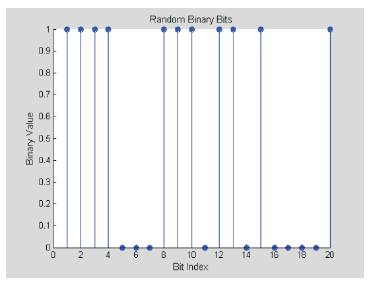
Figure 3. Portion of the Random Binary Bits
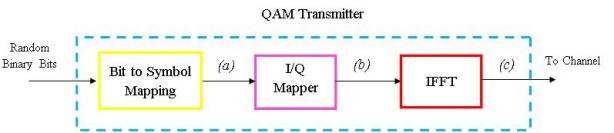
Figure 4. QAM Transmitter Block Diagram
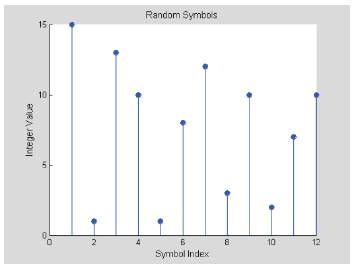
Figure 5. Generated Random Symbols
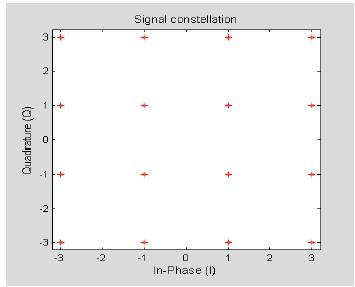
Figure 6. 16-QAM Constellation Diagram
The output of the IFFT block is the time domain QAM waveform that will be sent over the channel. Figure 7 illustrates how the complex numbers are assigned to the required IFFT bin.
The required bin (n) is calculated using the relationship:
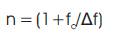
Where: fc is the carrier frequency and Δf is the frequency spacing. The complex conjugates are placed on bin n' which is calculated according to equation (2):
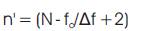
Where: N is the IFFT bin size. The following equations describe the mathematical operation of the IFFT[17]:
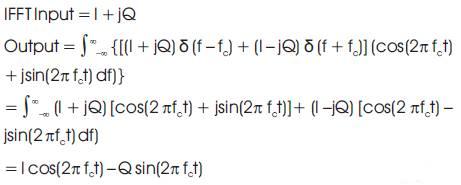
Where: equation (3) represents the expression of a QAM time domain waveform.
Table 1 shows the parameters that were used for the simulation. The implementation is done with a carrier frequency of 80 MHz, bit period (Tb ) of 32 nsec and a symbol period (Ts) equal to: Tb log2 M.
Figure 8a shows the generated QAM time domain waveform for M = 16 (16-QAM). It is clear from the Figure that the signal has varying amplitude levels, i.e. a multilevel signal. Figure 8b shows a zoomed version of Figure 8a that shows the first two symbols having two different amplitude levels and phases.
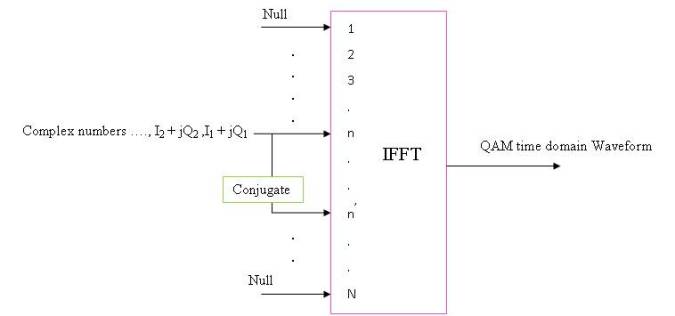
Figure 7. Complex Numbers Allocation to IFFT of Length N
The noise in the communication channel is modelled as an Additive White Gaussian Noise (AWGN) as shown in Figure 9. The mathematical representation of a received signal passing through an AWGN is represented in equation (4).
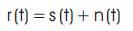
Where r (t) is the received signal, s (t) is the transmitted signal and n (t) is the additive while Gaussian noise.
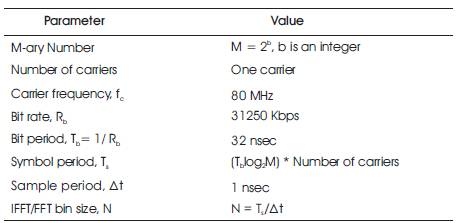
Table 1. Parameter Settings for QAM Simulation
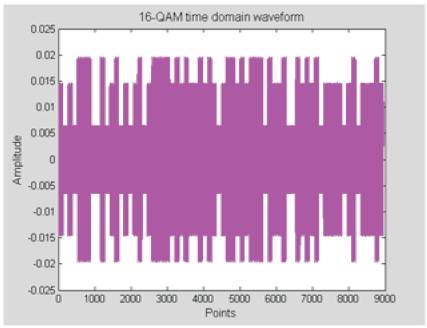
Figure 8(a). 16-QAM Transmitted Waveform
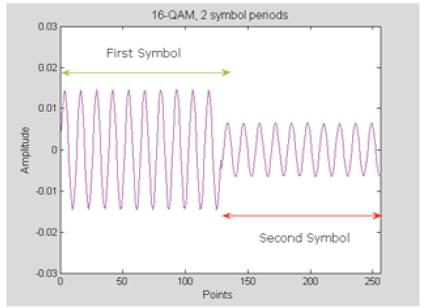
Figure 8(b). Waveform of the first 2 Symbols
Figure 10 shows the 16-QAM signal after transmission over the noisy channel. It is clear from the Figure that AWGN destroys the amplitude level of the transmitted signal.
The receiver performs the reverse operation of the transmitter. Figure 11 shows the functional block diagram of the QAM receiver.
Stage 1: The first stage in the demodulation process involves taking the FFT of the corrupted received signal. The FFT converts the time domain waveform to its equivalent frequency domain spectrum. The amplitude and phase of the sinusoidal components represent the frequency domain spectrum of the time domain signal, i.e. the output of the FFT are the complex numbers in the form (I + jQ), which are now corrupted with noise. The following scenario explains how noise distorts the transmitted signal.
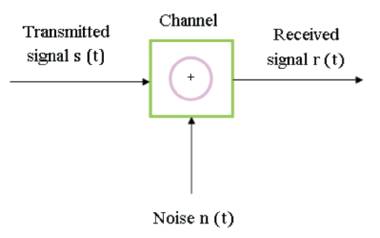
Figure 9. AWGN Channel Model
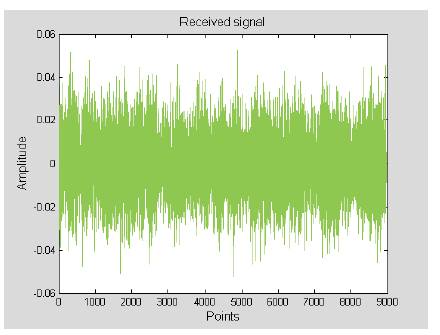
Figure 10. 16-QAM Signal After Adding Noise
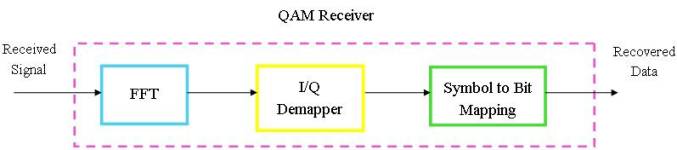
Figure 11. Block diagram of QAM Receiver
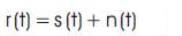
When the first symbol is transmitted over the noisy channel; suppose the symbol is '1111'; the channel randomly mixes this symbol with noise and as a result the received symbol has a different amplitude and phase from what was transmitted as shown in Figure 12a. Although the received symbol in this case has larger amplitude from what was transmitted, it's amplitude and phase are still close to the ideal position and the receiver could still interpret the symbol as '1111'.
The next time the symbol '1111' is transmitted, the channel randomly mixes it again with noise. But this time, the received symbol's amplitude is smaller and the phase is shifted as shown in Figure 12 b. The phase and amplitude is also still close to the ideal position and could still be interpreted as '1111'.
The same symbol is transmitted several times and the channel mixes it with noise every time. As a result the received symbol's position in the constellation diagram is different every time leading to a cloud of points as shown in Figure 12-c.
This effect alters every point in the constellation diagram and this can clearly be noticed from the output of the FFT which is shown in Figure 13. The red points are the transmitted symbols, while the green points are the received symbols affected by noise.
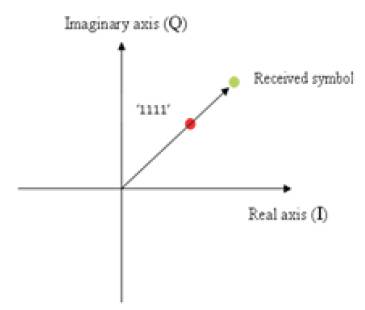
Figure 12 (a)
Figure 12 (b)
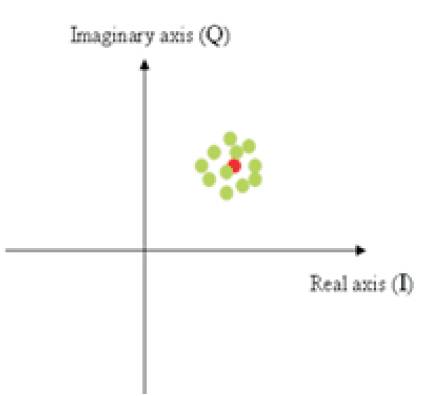
Figures 12 (a, b, c). Effect of Noise, Red Point is Transmitted Symbol, Green Point is Received Symbol
Stage 2: The complex numbers are then converted back to the original data word by using an I/Q de-mapper. The I/Q de-mapper converts every complex number back to its equivalent digit, which could be any number between 0 and M – 1.
Stage 3: Finally, the symbols are converted back to their corresponding binary bits, in order to recover the original message. For example, for the 16-QAM case every symbol is mapped back into 4 bits.
In order to measure the performance of the system over the noisy channel, the recovered binary bits are compared with the original bits and the bit error rate (BER) is calculated. The BER is a measure of how many received bits are in error. The BER is calculated for different values of signal to noise ratio (SNR) and the results are plotted as a curve. The simulation was repeated for different QAM modulation orders and results were plotted on the same graph for ease of comparison as shown in Figure 14 below.
As shown in the graph, the BER vs. SNR curve is a decaying curve, because as the SNR is increased the received constellation becomes less affected by noise and hence the numbers of errors tend to decrease. Figures 15 (a, b, c) show the received constellations for corresponding SNR values of 6 dB, 12 dB, and 20 dB. These figures demonstrate that as the SNR increases, noise decreases and the received constellation becomes less affected by noise.
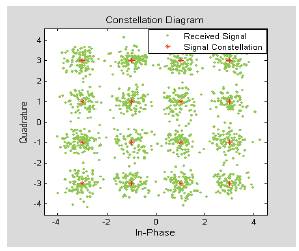
Figure 13. Constellation Diagram of the Received Signal
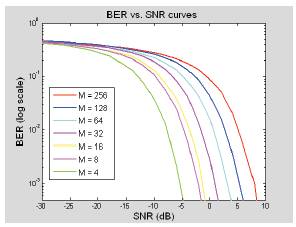
Figure 14. BER vs. SNR graph for different M-QAM
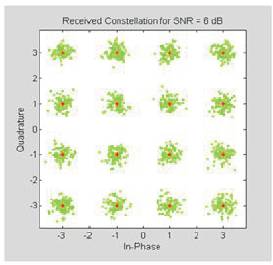
Figure 15 (a). SNR = 6 dB
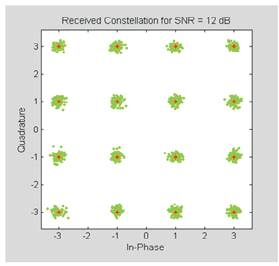
Figure 15 (b). SNR = 12 dB
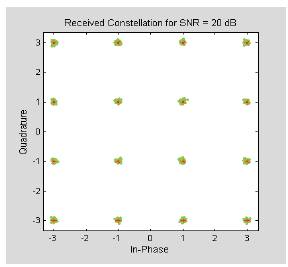
Figure 15 (c). SNR = 20 dB
However, it can be noticed from Figure 14 that the performance of BER vs. SNR varies from one modulation order to another. The curves clearly show that the BER of the lower modulation orders is far less than the higher modulation orders for a given SNR. The graph shows that only 16 QAM and lower levels are attractive to achieve a BER of 10-3 with a SNR between -5 and 0 dB, while the 256 QAM requires at least a SNR of 9 dB to achieve a similar performance. This behaviour is expected because as the modulation order increases, the constellation points become closely separated and as a result the receiver fails to correctly detect the original data. But, despite this disadvantage, higher modulation orders are more bandwidth efficient, because as the order of modulation increases, more bits can be transmitted per symbol. Therefore, this is a trade-off between efficiency and reliability in communication systems [18]. Figure 16 illustrates this. The graph proves that as the modulation order increases, the points in the constellation get closer but the bandwidth reduces.
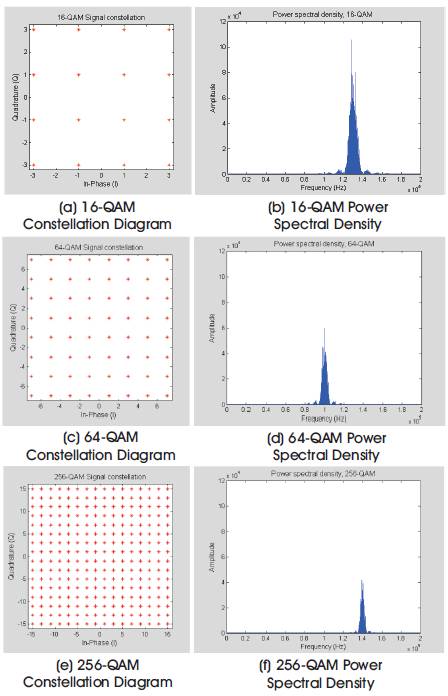
Figures 16 (a, b, c, e, f). M-QAM Constellation Diagrams and Power Spectral Density
Solution to reduce noise: the results show that higher SNR values decrease the effect of noise. Therefore in order to reduce the effect of noise in a communication system it is recommended to use a high SNR.
Another solution that opens the door for future research is to use error correction coding techniques such as convolution coding or turbo cording for higher orders to eliminate or minimize the effect of noise.
The performance of the QAM signal was also tested with a multipath channel. The multipath channel is simulated with a signal containing a single reflected path. Figure 17, shows the multipath scenario that is simulated. In this scenario, the receiver receives two signals from two sources: one from the transmitter and one from a reflector (the tall building) which is located d meters away from the receiver. This means that, part of the transmitted signal directly arrives at the receiver while the other part is reflected from the building and then reaches the receiver. Therefore the total received signal is a combination of these two signals.
The reflected signal is modelled by attenuating and delaying the original transmitted signal. Equation (5) describes the model for the received signal.
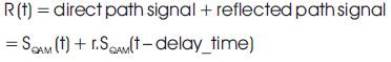
Where: SQAM (t) is the transmitted signal (i.e. direct path signal), r is the reflection coefficient and delay _ time is the time delay. The amount of delay (in seconds) is computed by dividing the distance travelled by the speed of light (c = 3*108 m/s) as shown in the following equation

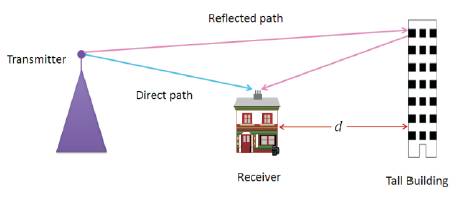
Figure 17. Scenario for Multipath Propagation
Figure 18 shows the first symbols of the direct and reflected signals. These two signals are combined at the receiver and the resulting signal is shown in Figure 19.
The received signal has been distorted, and this distortion is due to two types of interferences
These two interferences have two effects on the received constellation diagram.
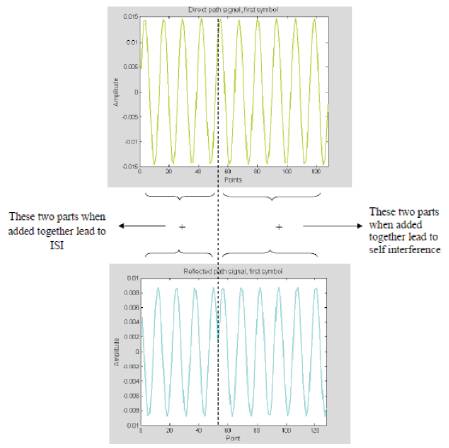
Figure 18. Direct and Reflected Paths
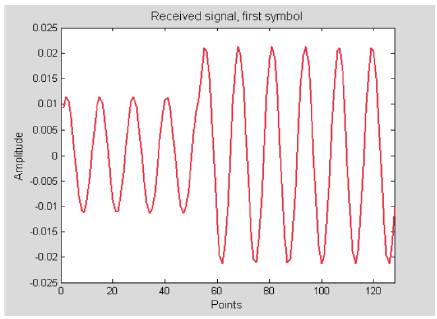
Figure 19. Received Signal, First Symbol
The effect of ISI and self-interference can be clearly noticed in Figure 20 for the 16-QAM signal, in which the constellation diagram is rotated due to self-interference and each point now consists of 16 new points in the shape of 16-QAM constellation because 16 other symbols interfered with the transmitted signal.
These effects lead to high probability of errors because the points are wrongly detected and therefore a correction method is required at the receiver. The effect of ISI cannot be corrected, but the rotation can be corrected by calculating the rotation angel needed to rotate constellation back to the original position. Figure 21 and the below equations illustrate how the rotation angle is calculated.
If original point = I1 + jQ1 and Rotated point = I2 + jQ2 , then:
Rotated point = original point *correction factor
Correction factor = (I2 + jQ2 )/ (I1 + jQ1 ) = aejɸ
Where a and ɸ are the amplitude and phase required for correcting the constellation. Figure 22 shows the received constellation diagram after the correction had been applied compared with the original constellation. The red points represent the original points where the cyan points represent the corrected points.
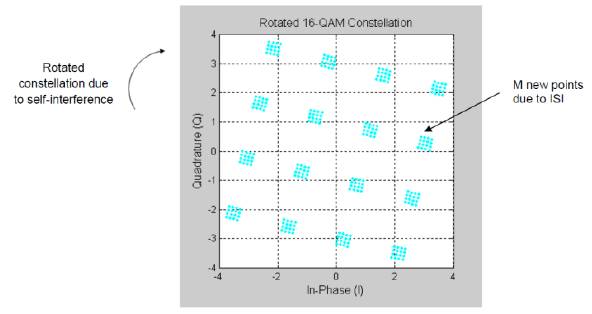
Figure 20. Constellation Diagram of the Received Signal
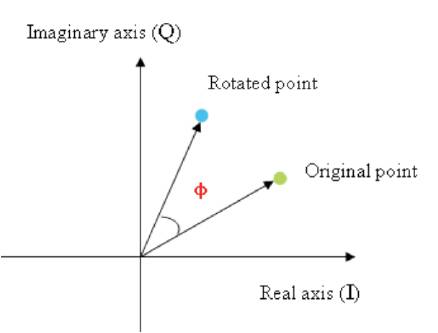
Figure 21. Rotation Angle Φ Needed to Correct Constellation
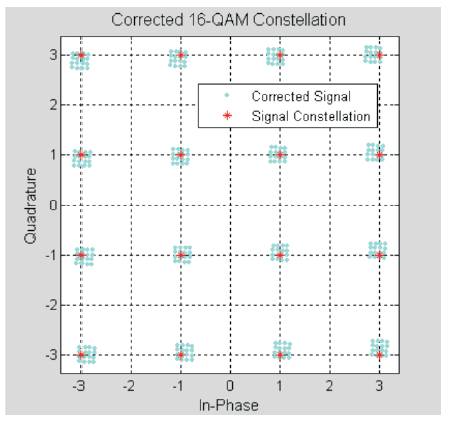
Figure 22. Corrected Constellation Diagram
The performance of the single QAM system under the multipath channel was measured by calculating the BER for different reflection coefficients and delay times. Figure (23 a & b) shows the BER versus multipath delay curves for 64-QAM and 256-QAM. The simulation results show that as the reflection coefficient increases (i.e. as the reflection becomes stronger) the system performance deteriorates. The results also show that in all cases, BER increases as the delay time increases; or in other words; the performance of the system deteriorates as the delay increases. This result is consistent with the fact that ISI increases with delay and hence resulting in higher BER.
Figure 24 shows BER vs. maximum multipath delay for 16- QAM with different reflection coefficients. The maximum BER that will occur is when the delay exceeds the symbol period; i.e. when delay _ time > Ts ; as this will result in strong s effect of ISI. Once the delay exceeds the symbol period, the effect of ISI on the performance becomes insignificant and the BER becomes constant at the maximum value. This can be noticed in the figure, where the BER increases rapidly at the beginning and then gradually approaches an error ceiling as no significant effect on the BER will further occur because the delay has exceeded the symbol period. The symbol period for the 16-QAM is about 128 nsec and therefore it can be noticed from the Figure when the delay has nearly approached this value, the BER reaches its maximum value and then remains constant at this value.
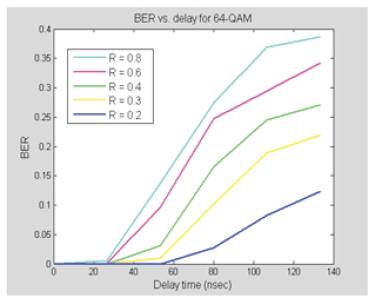
Figure 23 (a). 64-QAM
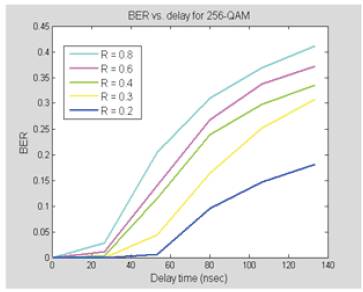
Figure 23 (b). 256-QAM
Figure 23. BER vs. Multipath Delay for 64 and 256 QAM
The performance of the system under the multipath channel has also been measured for different modulation orders. Figure 25 shows the BER vs. delay time with the reflection coefficient R fixed to 0.5 for 4, 16, 64 and 256 QAM.
Generally, the symbol period is calculated based on the relation: Ts = (log2 M) x Tb , which implies that, the symbol period increases as the modulation order increases. When the symbol period becomes longer, the number of distorted samples due to ISI compared to the total number of samples per QAM symbol decreases and hence the BER also decreases. But despite this advantage, as the modulation order increases the symbol spacing decreases and the points in the constellation diagram become closely spaced giving rise to a higher BER. Therefore, as a result this disadvantage, overcomes the benefit of the longer symbol period and this is clearly noticed in Figure 26, where lower modulation orders are less susceptible to errors than higher orders.
The effect of ISI causes a major problem in high data rate systems, because in high data rate communications as the speed increases, the time interval to transmit a symbol becomes shorter. Therefore, in order to reduce the effect of ISI the symbol period must be made longer and this can be achieved by implementing a multi-carrier system as will be discussed next.
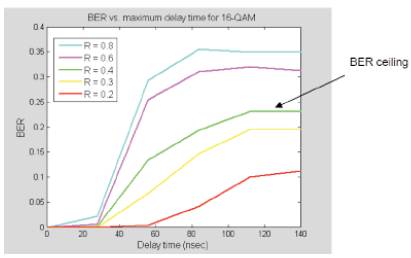
Figure 24. BER vs. Maximum Delay for 16-QAM
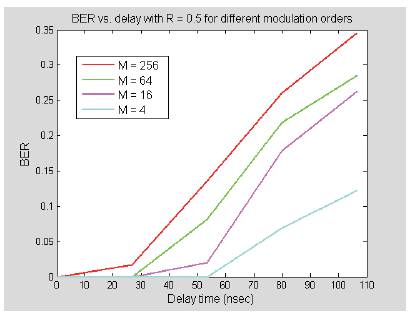
Figure 25. BER vs. Delay time for different Modulation Orders
The single carrier program was then extended to a multicarrier system by dividing the available bandwidth into a number of sub carriers in which each sub carrier is modulated using M-ary QAM and the system is known as M-ary QAM OFDM. The system was simulated for different modulation orders and for different number of subcarriers and the results were plotted and analysed. Finally, the single carrier QAM system was compared to the multicarrier OFDM system in terms of spectral efficiency and immunity to noise and multipath effects.
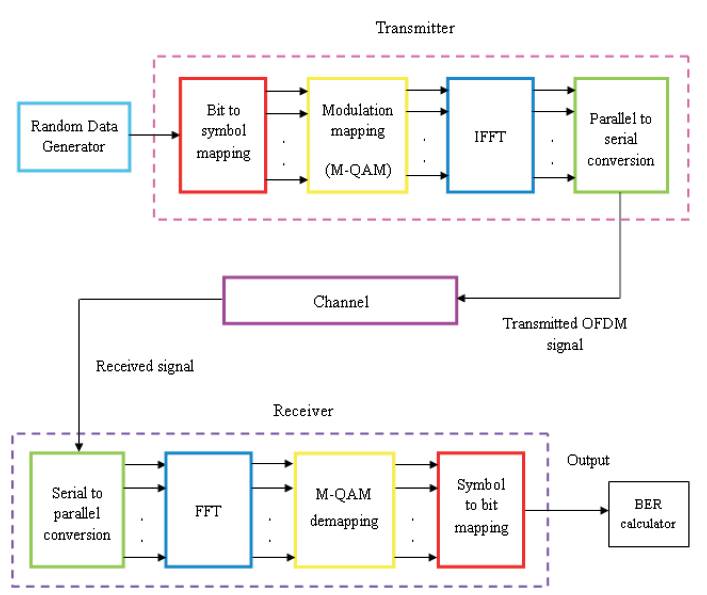
Figure 26. Block Diagram of the OFDM system
The functional block diagram of the OFDM system as shown in Figure 26 is similar to that of a single carrier except that here multiple carriers are used. The system is divided into several stages
Usually the N is taken to be a power of two in order to enable a highly efficient IFFT and FFT algorithms for modulation and demodulation. The IFFT converts each complex number to a time domain sinusoidal as demonstrated in the above figure. Equation (7) shows the mathematical representation of the IFFT output [13]
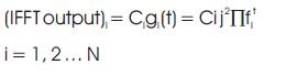
Where: Ci represents the complex numbers, gi(t) is the expression for the subcarriers having frequencies of fi
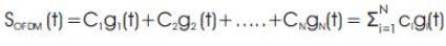
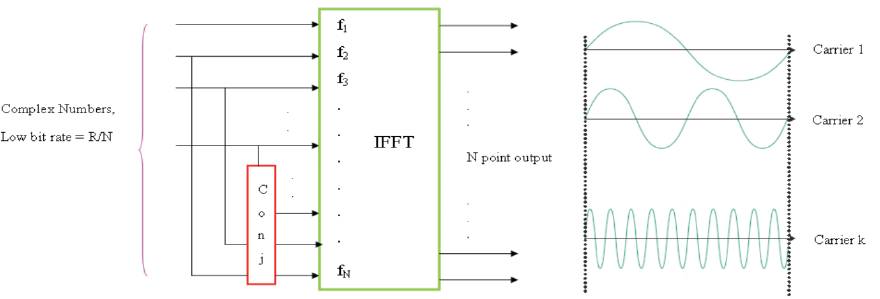
Figure 27. Assignment of the Complex Numbers to IFFT bins
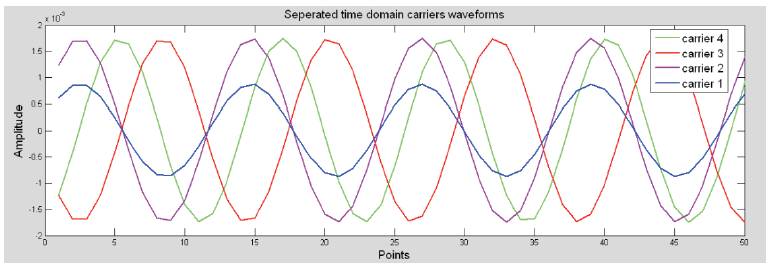
Figure 28 (a). Separated Components of the OFDM Waveform
The same parameters of Table 1 were used for the OFDM program. The number of carriers used is set to 4 and each carrier is 16-QAM modulated. The symbol period in this case is four times longer than that of the single carrier case, i.e. (Ts )OFDM = (Ts)Single_carrier * number of carriers = 128*4 = 512 nsec.. The total number of binary bits used in this example is 6400 and the total number of OFDM symbols is therefore 6400/ (4*4) = 400 symbols, each symbol is N = 512 samples long (512*400 = 204800 total samples). Figure 28(a) shows the output of the IFFT. The graph shows the separate sinusoids that make up one OFDM symbol. The Figure is 'zoomed', i.e. all 512 points of the IFFT are not shown. Theses carriers are combined and the resulting OFDM symbol is shown in Figure 28(b). The 400 OFDM symbols are transmitted serially; and the overall transmitted OFDM signal is shown in Figure 29.
The mathematical expression for the OFDM signal bandwidth is given by [19]:

So from the equation it could be observed that increasing the symbol duration decreases the frequency spacing between the carriers and therefore for a given bandwidth more carriers can be accommodated. Furthermore, for a fixed number of carriers, increasing the symbol duration decreases the bandwidth. Figures 30 a & b compare the frequency spectrum of the OFDM signal and the spectrum of a single carrier system. The graphs clearly show that the OFDM is more bandwidth efficient than the single carrier spectrum.
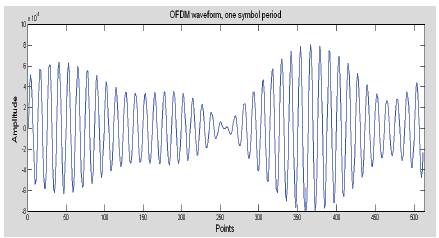
Figure 28 (b). OFDM Time Waveform for One Symbol Period
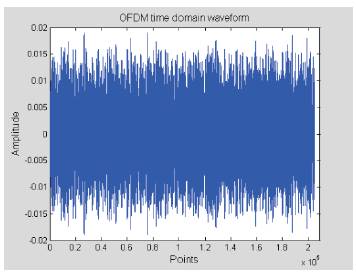
Figure 29. OFDM Transmitted Signal
The performance of OFDM in AWGN channel was measured for different M values and for different number of carriers. Figures 31 a, b show BER vs. SNR curves for MQAM OFDM with 32 and 64 carriers respectively. It was found from the results that the performance of OFDM in AWGN channel is similar to the single carrier case. The results show that the number of carriers does not affect the overall BER performance. This is because every carrier is M-ary QAM modulated and noise affects each carrier's constellation separately, and therefore the performance is similar to a single carrier case. The graphs also show that lower modulation orders are less affected by noise than higher orders.
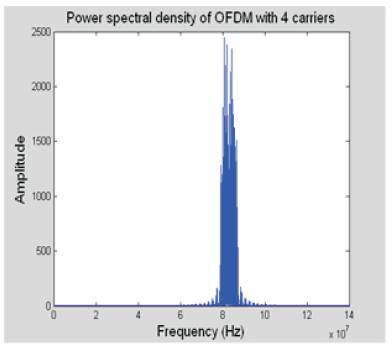
Figure 30 (a). OFDM with 4 Carriers
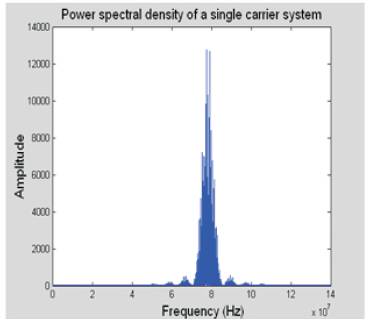
Figure 30 (b). Single Carrier
Figure 32 shows the 16-QAM received constellation diagrams for a 4 subcarrier OFDM system after being transmitted over the multipath channel. All 4 carriers are 16-QAM modulated and the multipath propagation has affected each carrier constellation diagram. These constellations are corrected for each carrier separately as shown in Figure 33. The rotation is corrected by calculating the rotation angel for each carrier separately. This means that the same method used for a single carrier is used here but instead of one carrier it is repeated for n carriers; where n is the number of carriers. The following equations demonstrate this approach:
If original point for carrier 1 = I1 + jQ1
Rotated point = I2 + jQ2 , then:
Correction factor for carrier 1 = (I2 + jQ2 )/ (I1 + jQ1 ) =αejΦ
Corrected point for carrier 1 = original point *correction factor
Therefore for n carriers a loop in MATLAB is used as in the following equations:
For n carriers:
(Original point)n = (I1 + jQ1 )n
(Rotated point)n = (I2 + jQ2 )n
(Correction factor)n = (I2 + jQ2 )n/ (I1 + jQ1 )n
= [αejΦ]n
(Corrected point)n = (original point)n * (correction factor)n
Where n = 1, 2, 3… number of carriers
As it can be noticed in the figures, the correction mechanism was only able to correct the rotation (i.e. the effect of self-interference), while the effect of ISI was not corrected. OFDM can reduce the effect of ISI by increasing the number of carriers, because as the number of carriers increase the symbol period also increases and as a result the effect of ISI compared to the whole symbol period decreases. Figure 34 shows the constellation diagram when the number of carriers was increased to 64 carriers. The graph shows that the effect of ISI has decreased, i.e. fewer points are now scattered.
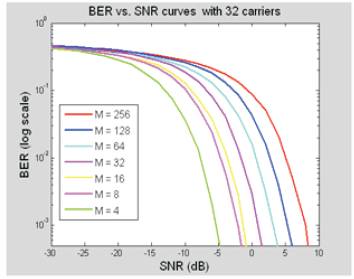
Figure 31(a). 32 Carriers
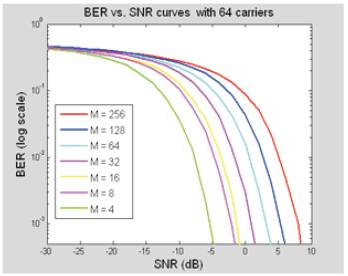
Figure 31(b). 64 Carriers
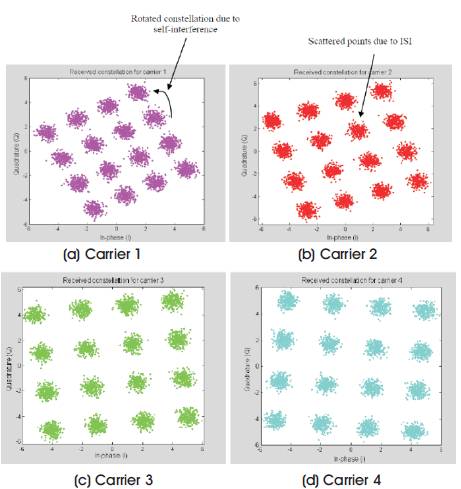
Figure 32. 16-QAM Received Constellations for a 4 Subcarrier OFDM System Showing Multipath Effect
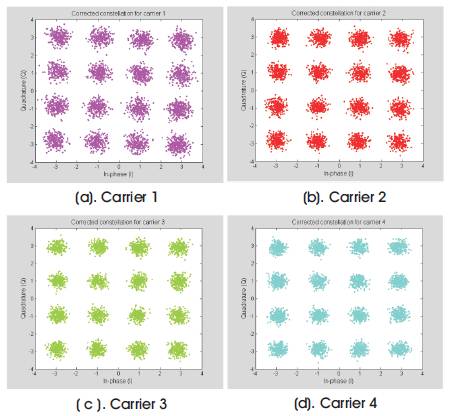
Figure 33. Corrected Constellations for the 4 Subcarrier OFDM System
Figures 35 (a, b) shows the BER vs. delay time curves for 16- QAM OFDM system with different number of subcarriers. The reflection coefficient of the multipath channel is set to R = 0.6.
Figures 35 (a, b) BER vs. delay curves for 16-QAM OFDM system with different number of carriers
The results show that in all cases, as the delay time increases the BER also increases, and this is because the effect of ISI increases with delay. The graphs also show that, for a given delay time BER decreases as the number of carriers increase. For example, in Figure 35(a) when comparing the single carrier case with the 8 carriers' case for the 120 nsec delay time; the single carrier achieves a BER of 0.3 while the 8 carriers system achieves a BER of about 0.05 for the same delay time. This is true because as the number of carriers increase the symbol period also increases and the ratio of distorted samples due to ISI compared to the total symbol period decreases and as a result the BER decreases (i.e. the system performance improves).
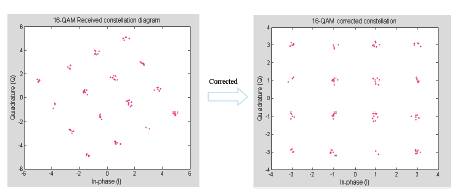
Figure 34. 16-QAM Constellation Diagram for 64 subcarrier OFDM system
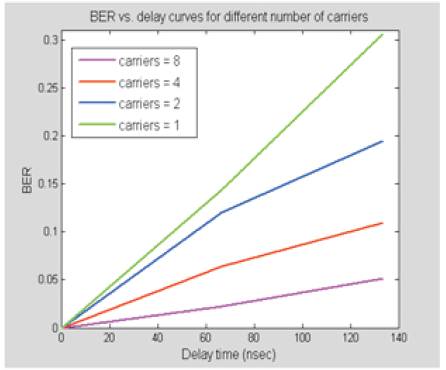
Figure 35 (a). Number of Carriers 1, 2, 4 and 8
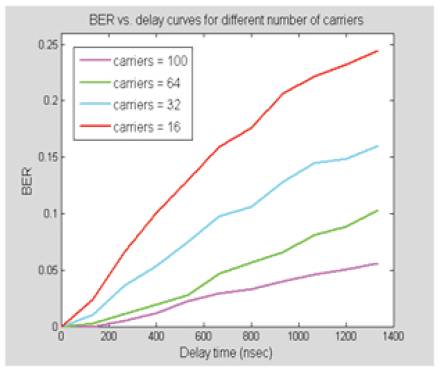
Figure 35 (b). Number of Carriers 16, 32, 64 and 100
Figure 35(b) shows the performance of the system under severe multipath conditions (i.e. for longer delay times).
The figure clearly shows that higher numbers of subcarriers are more immune to multipath delays. It could be noticed that for a delay time of 1200 nsec a 100 subcarrier system can achieve a BER of 0.05 compared to a BER of 0.23 for a 16 subcarrier system.
Further analysis has also been done for a 16-QAM OFDM system with 200 carriers in a severe multipath channel with different reflection coefficients and the simulation results are shown in Figure 36. The results show that using a 200 carriers system can improve the performance even more. For example, for a channel that has a delay of 1300 nsec and a reflection coefficient of 0.4, a BER of 10-3 could be achieved.
Figures 36 (a, b) BER vs. delay for 16-QAM OFDM system with 200 carriers
When comparing the performance of the 200 carriers system with the single carrier system under severe multipath conditions, as shown in Figure 37, it was found that the 200 carriers system has a higher level of immunity to multipath delay than the single carrier. For example, for a given delay of 1600 nsec, the 200 carriers system can achieve a BER of 0.03 compared to a BER of 0.3 for the single carrier system. For the single carrier curve, BER increases rapidly at the beginning until it reaches a maximum value of about 0.3 and then remains constant at this value. This maximum value indicates that the delay time has exceeded the symbol period and after this value ISI has no effect on the BER. On the other hand, the multiple carriers curve increases at a much lower rate than the single carrier case. This is because the symbol period of the 200 carriers' case is 200 times longer than the single carrier case, and this makes the effect of ISI compared to the whole symbol period small.
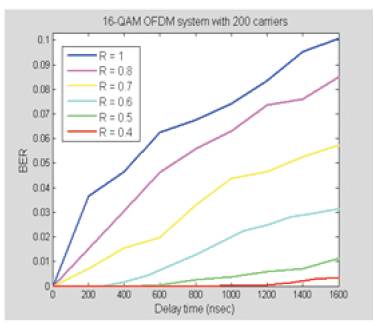
Figure 36 (a). BER vs. Delay Curves
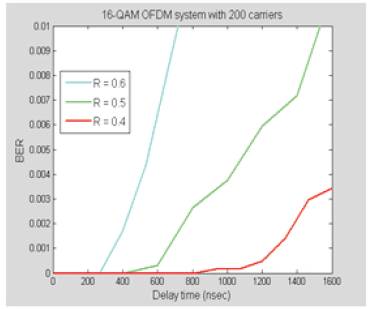
Figure 36 (b). Zoomed Version
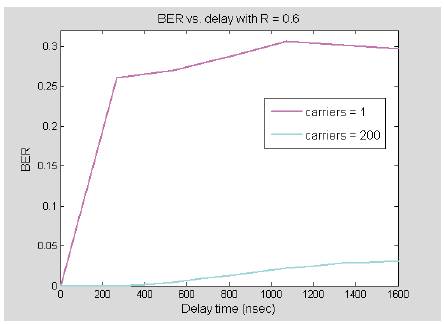
Figure 37. Single Carrier vs. Multiple Carriers' 16-QAM System
Therefore, from all the simulation results that were obtained, it can be concluded that a multiple carrier system can reduce the effect of ISI under sever multipath conditions, i.e. it achieves a higher performance compared to a single carrier system.
The simulation results showed that when the channel is subjected to noise, the transmitted signal's amplitude and phase are distorted and this in turn scatters the points in the constellation diagram. These scattered points cause the receiver to wrongly detect the original transmitted message and errors are therefore introduced. The performance of M-ary QAM in a noisy channel showed that higher modulation orders are more susceptible to noise effects than lower orders and this is consistent with the fact that the separation between adjacent points in the constellation diagram decreases as the order increases. But despite this drawback, higher modulation orders increase the spectrum efficiency, i.e. as the modulation order increases the spectrum becomes more efficient because more bits can be transmitted.
Furthermore, a similar study was done when the signal was subjected to multipath environments. The results showed that the received signal under these conditions encounters two types of interferences: self-interference and Inter-symbol Interference (ISI). The impact of these types on the received signal was studied and the results showed that self-interference causes the constellation diagram to rotate while ISI alters the phase and amplitude of the transmitted symbols and as a result the points are scattered. The study showed that the distortion caused by ISI could not be corrected, but the effect of selfinterference could be corrected by applying a correction mechanism at the receiver. The correction mechanism involves calculating the correction angle required to rotate the constellation back to its original position.
The performance analysis of the single carrier M-ary QAM system under the multipath environment showed that the system performs poorly under this type of channel. The reason behind this poor performance is basically due to the fact that the distortion caused by ISI increases with delay and as the ISI increases the ratio of the distorted samples compared to the total number of samples also increases until the effect of ISI becomes the dominant contribution. At this point it was found that when the delay exceeds the symbol period the BER reaches a maximum value and then remains constant at this value because the effect of ISI on the system becomes insignificant beyond this point.
The same analyses were performed for the OFDM system and the results were compared to the single carrier case. The OFDM system uses multiple closely spaced carriers in which each carrier is M-ary QAM modulated. The spectrum of the OFDM system was compared to the single carrier spectrum and the results showed that using multiple carriers is more bandwidth efficient. The OFDM signal was transmitted through an AWGN channel and the performance analysis of system showed that the system has a similar performance as the single carrier system i.e. it was found that the number of carriers have no effect on the BER. This is because each carrier is M-ary QAM modulated so noise affects each carrier separately regardless of the number of carriers.
Furthermore, the OFDM signal was also transmitted through a multipath channel and the impact of channel on the different carriers was analysed. It was found that the multipath channel affects each carrier separately and therefore the same correction mechanism that was applied for the single carrier system was also applied here but this time for each carrier. The performance results proved that using multiple carriers can effectively reduce the effect of multipath and improve the performance. The study showed that when the number of carriers increases, the symbol period also increases and this in turn has a benefit in reducing the effect of ISI. As the symbol period increases the portion of distorted samples due to ISI compared to the total symbol period decreases and as a result the BER is improved. The effectiveness of the OFDM system was also proved even when the delay of the channel was enlarged and therefore the system is suitable for harsh wireless environments.
Finally, it could be concluded that M-ary QAM modulation technique is used to effectively increase the channel capacity while the OFDM technique is attractive because of its effective way in reducing the effect of ISI. So an OFDM system with low M-QAM modulation orders is suitable for low capacity applications, while OFDM with higher M-ary QAM schemes is best suited for large capacity applications, but at the cost of a slight increase in the bit error rate.
In this project it was shown that higher modulation orders per formed poorly under AWGN and multipath environments than lower orders due to the fact that interference between adjacent symbols increases with the order. Therefore it is suggested to use error correction coding techniques such as convolution coding or turbo cording for higher orders to eliminate or minimize the interference from the adjacent symbols in the constellation diagram. Techniques such as convolution coding or turbo coding increases the survivability of the transmitted signal in AWGN and multipath channels and hence enhances the overall performance of the system. The project addressed only two types of wireless channel impairments: noise and multipath; therefore it is suggested to study and evaluate the performance of the system over other types of wireless channel impairments such as Doppler shift and clipping effects.
Another suggestion is to develop an interactive and user friendly environment for M-ary QAM and OFDM modulation program by implementing graphical user interfaces (GUIs) in MATLAB. The environment could be used as a computer-aided teaching facility in a digital communication course, so that the user can understand the effect of the different modulation parameters on the modulation and demodulation outputs by interacting with these GUIs. Furthermore this environment can also be provided as an educational tool for students over the internet by using the MATLAB web server facility.
The author would like to thank Dr. John Walker, Associate Professor and Reader, Faculty of Engineering, university of Nottingham for his endless support, systematic guidance and valuable advice during the period of this project; University of Khartoum for the MSc scholarship it gave her; and her family for their encouragement and continuous support.