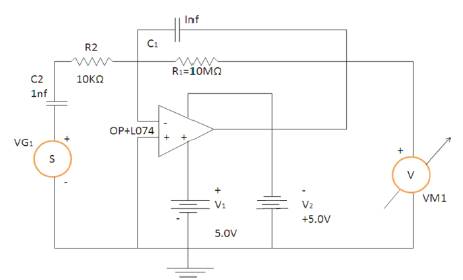
Figure 1. Circuit Diagram of Pre-amplifier Section
In the field of rotating machines, it is necessary to monitor and carry out online diagnosis for the analysis of vibrations of the machine. This paper focused on vibration signals which are taken from developed prototype of a Rubber Roll Sheller Machine and FFT analysis is performed on the acquired signals under no load & load Conditions. This newly developed data acquisition system is capable of acquiring vibration data from various rotating machines under different load conditions which can further be utilized efficiently for the condition monitoring of machines under various test conditions. This approach carries simplicity & flexibility from other techniques and also it is easy to operate, quickly installed, computer friendly approach and it is cost effective.
Condition monitoring is the process for monitoring any parameter of condition in machinery, such that a significant change is indicative of a developing failure [1]. The use of condition monitoring allows maintenance to be scheduled or other necessary actions to be taken to avoid the consequences of failure before the failure occurs. Nevertheless, a deviation from a reference value must occur to identify impeding damages in the machinery. Condition monitoring for any machine is much more cost effective than allowing the machinery to fail. The most commonly used method for condition monitoring is the vibration analysis. The prime aim of vibration analysis is the detection of changes in the vibration condition of the machine under investigation during its operation [4, 6]. By measuring & analyzing the vibration of a machine, it is possible to determine both the nature & severity of the defect and hence predict the machine failure. Previous researches on the development of vibration based machine condition monitoring system has focussed on designing the vibration sensor introducing new methods to detect, measure & diagnose the vibration of the machine. Holger Fritsch et al. (1997) developed a micromechanical low frequency range for wear monitoring. Odin Taylor and John Macintyre (1998) developed a novel self-improving architecture for data fusion, novelty detection and dynamic learning which was applied in condition monitoring. Adam G.R. et al.(2004) used a printed circuit board(PCB) piezotronics model 352c68 piezoelectric accelerometer to measure the vibrations and investigate the fault of the spindle positioning drive(z-axis)on a proteo D/94 precision machining center [2, 7]. Marin Marinov et al. (2004) used a MEMS accelerometer ADXL250 family from analog devices as a sensor to measure vibrations. Li Wang et al. (2007) developed an embedded intelligent local set for machine condition monitoring and fundamental diagnosis. Paul Wright et al. (2008) used a MEMS accelerometer ADXL320 from analog devices for monitoring of machine tool vibration wirelessly. Andreas Vogl et al. (2009) developed a MEMS accelerometer for wireless vibration measurements on AC motors for condition monitoring. This paper deals with the development of a vibration monitoring data acquisition and analysis system which is easy to operate, simple in construction and less in cost as compared to the MEMS accelerometers discussed above. The paper is organized as follows: The next section discusses the basics of vibration analysis and reasons for generation of vibration signals which are further used for monitoring application. Following this the next section then explains various techniques used for vibration monitoring. Thepaper then discusses the material and method used for the development of said data acquisition system and details of the developed prototype of Rubber Roll Sheller machine for signal acquisition. The last section deals with results and conclusions.
Machine vibration can be defined as simply the cyclic or oscillating motion of a machine or machine component from its position of rest [3]. Forces generated within the machine cause vibration. These forces may be due to one of the following reasons:
Some of the most common machinery problems that cause vibration include misalignment of couplings, bearings and gears, unbalance of rotating components, looseness, deterioration of rolling-element bearings, Gear wear, rubbing, electrical problems in motors and resonance.
Machine fault can be defined as any change in a machinery part or component which makes it unable to perform its function satisfactorily or it can be defined as the termination of availability of an item to perform its intended function. Any machine which contains some faults will increase its vibration from natural rate to abnormal rate. Classification of failure causes are as follows:
Modern manufacturing plants & industries are highly complex in terms of machines & operation. Failure of process equipments and instrumentation in the plant increased the operating costs and reduces production. Undetected or uncorrected machines can induce failures in related equipments and in extreme cases, can lead to disastrous accidents. Malfunction of machine or machines lead to severe machine damage, high power consumption, machine unavailability, unnecessary maintenance & quality problem.
There are certain objectives of machine fault identification:
Various monitoring techniques are available which can be employed for detection of machine faults. They are discussed as follows:
Visual monitoring can sometimes provide a direct indication of the machine's health condition without any need for further analysis. The available techniques can range from using a simple magnifying glass or low-power microscope. Other forms of visual monitoring include the use of dye that penetrates to provide a clear definition of any cracks occurring on the machine surface and the use of heat-sensitive or thermo graphic paints. But this technique is not so accurate & its scope is limited.
Temperature monitoring consists of measurement of the operational temperature of machine and the temperature of machine component sur faces. Monitoring operational temperature can be considered as a subset of the operational variables for performance monitoring. This technique can include the use of optical Temperature monitoring consists of measurement of the operational temperature of machine and the temperature of machine component sur faces. Monitoring operational temperature can be considered as a subset of the operational variables for performance monitoring. This technique can include the use of optical pyrometers, thermocouples, thermography and resistance thermometers.
Acoustic emission refers to the generation of transient waves during the rapid release of energy from localized sources within a material. The source of these emissions is closely associated with the dislocation accompanying plastic deformation and the extension of fatigue cracks in material under stress. Acoustic emissions are measured by piezoelectric transducers mounted on the surface of the structure under test and loading the structure.
It is not possible to examine the working parts of a complex machine on load. However, the oil which circulates through the machine carries with it substantiation of the condition of parts encountered. Assessment of the oil, any particle it has carried with it allows monitoring of the machine on load or at shutdown. A number of techniques are applied, some ver y simple, other involving painstaking tests and expensive equipments.
Motor current signature analysis is a novel diagnostic process for condition monitoring of electric motor-driven mechanical equipment. The MCSA process identifies characterizes and trends overtime the instantaneous load variations of mechanical equipment in order to diagnose changes in the condition of the equipment.
The method of non-destructive testing is able to use the components or structure after examination. The inspection should not affect the component involved and it must be non-destructive. It includes many different technologies, each suitable for one or more specific inspection tasks with many different disciplines overlapping or complimenting others.
Vibration signatures are extensively used as a diagnostic tool for mechanical systems [5]. In most cases, some kind of signal processing is undertaken on those signals to extract specific features of such vibration signatures. Selection of transducers used as pickup for capturing vibration signal is very important. Signature-based diagnostic makes extensive use of signal processing techniques involving one or more method to deal with the problem of enhancement in the signal to noise ratio. These methods can be separately applied for time domains, frequency domains and joint time-frequency domains. This work utilizes the vibration signature analysis technique for the condition monitoring of Rubber Roll Sheller machine which is used to remove hull from paddy in rice mills.
The newly developed data acquisition system contains the acquisition & recording of machine vibration signals. This system is divided into two parts-hardware section & software section. The hardware part consists of a piezoelectric sensor & a pre-amplifier circuit while the software section consists of data acquisition & data storage block.
The hardware consists of a piezoelectric shock sensor which produces a voltage which is proportional to the acceleration of an impact or a vibration to which it is exposed. This shock sensor utilizes piezoelectric ceramics to convert the energy of impact into a proportional electric signal. The piezoelectric shock sensor uses a 'unimorph' diaphragm which consists of piezoelectric ceramic disk laminated to a metal disk. The diaphragm is supported along its circumference in housing. This sensor is suitable in wide range of applications in vibration sensing. Signals from sensor are fed into pre-amplifier circuit which amplifies the signal level to a desired level for further processing in a personal computer. A charge amplifier IC-TL074 is used which is high speed J-FET input quad operational amplifier for this purpose.It produces an output which is a function of the electrical charge flowing into the input. Circuit diagram for the pre-amplifier section is shown in Figure 1. Signals from pre-amplifier section are fed into a personal computer through its line-in port.
Figure 1. Circuit Diagram of Pre-amplifier Section
The software section is used to perform data acquisition and to display machine vibration signals in a personal computer. It is developed with the intention to acquire and record machine vibration signature which can be efficiently used for further processing & analysis. For this purpose, the system hardware output is fed directly to the line-in port of the personal computer which contains an on-board signal conditioning, an analog to digital converter and a digital signal processing hardware. SIMULINK blockset of MATLAB 7.9 is used to acquire and display the machine vibration signatures which will be of great diagnostic importance [8].
For testing the newly developed system, a prototype of Rubber Roll Sheller machine is developed which is used in rice mills for the separation of paddy from the hull. A typical Rubber Roll Sheller consists of two metallic cylinders surrounded by rubber rolls. These rolls are rotated in opposite direction with differential speeds to remove paddy from hull. The developed prototype of Rubber Roll Sheller is shown in Figure 2.
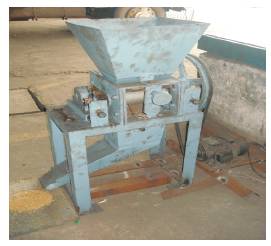
Figure 2.Prototype of Rubber Roll Sheller machine
Piezoelectric sensor is placed on the bearing of the Rubber Roll Sheller for capturing the vibrations. Vibration signals were taken from the newly developed data acquisition system on prototype of Sheller machine. The complete setup is shown in Figure 3.
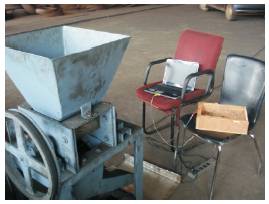
Figure 3.Complete Setup for Data Acquisition of Rubber Roll Sheller Machine
For each trial, a 10 seconds data was captured and stored in personal computer. The acquired signals are then transferred to a personal computer in the form of *.wav files and saved for the purpose of subsequent analysis. SIMULINK blocklset of MATLAB 7.9 is used to display the recorded vibration signals. Signals from Rubber Roll Sheller machine are acquired in no load & load conditions & FFT values are taken for the acquired signals at no load & load conditions as shown in Figure 4 & 5.
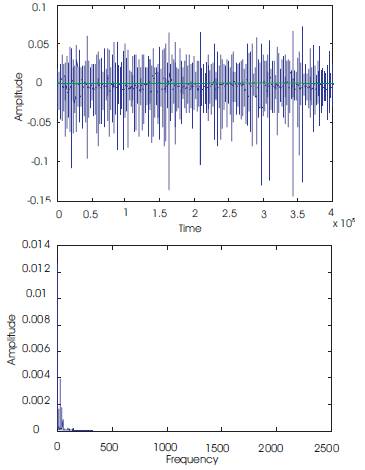
Figure 4. Vibration Signal & Power Spectral Density at no Load Condition
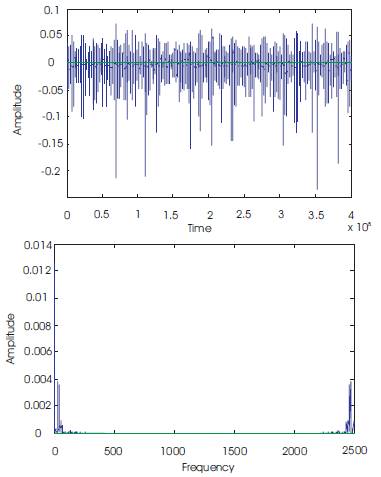
Figure 5. Vibration Signal & Power Spectral Density at Load Condition
From the analysis of number of samples obtained from the prototype of Rubber Roll Sheller machine using the newly developed device, following conclusions are drawn: