Application of PV generators for water pumping applications, especially in remote area of developing countries, has received much attention. Since the output of a PV generator is essentially dc in nature, a dc motor is an obvious choice for the prime mover of the pump. This avoids the use of an inverter, which will be required to drive the induction motor in case the conventional water pumping systems is chosen. The dc motor option gives better overall efficiency for low power applications. Therefore, for low power applications dc motors are preferred in spite of maintenance problem. In this work MATLAB /SIMULINK software is used for modeling PV cell which is further modified to develop a PV array model. Simulation model was also developed for PV based water pumping system and the performance of the system is analyzed with various configurations of PV array.
Photovoltaic cells convert radiant energy from the sun directly into electricity. Photovoltaic cell provides a clean, reliable energy without consuming fossil fuels, and is free from hazardous product. Sun is the mother of all energies (except nuclear and geothermal) that provides almost all the energy needed to support life, and can be used in variety of applications. Recent global developments appear to guarantee a market for green renewable energy. Of course, the sun is the original primary source of most of the other renewable energy resources: wind, wave, hydroelectric, biomass, geothermal etc. On average, the earth receives about 1.21017W of solar power. The challenge for a sustainable future is to tap a tiny fraction of this energy to supply the relatively modest demands of human activities. The increasing use of solar cells is linked to economic factors, better efficiency, reliability and recent advances in solid state technologies. This has given a boost to the attractiveness of solar cells. High efficiency solar cells are now available [1].
The PV modules production is rising steadily and is expected to reach 10GW by 2010 if the current trend in advancement of solid state technology continues [2]. Although the price is still high in comparison with other renewable energy resources, solar cells have advantages in terms of long-term reliability, maintenance, and minimal environmental and social impact.
For isolated regions, where connection to the utility grid is highly expensive, if not technically unaffordable, solar electricity an excellent solution to their needs. In developed countries, it has become another alternative energy source and is seeing application in residential electrification, refrigeration and air conditioning.
Solar cell generator is neither constant voltage nor constant current source. The current is proportional to solar insolation and voltage is a function of the current required by the load [5].
A typical i-v characteristic of a solar cell for a certain ambient irradiation S and a certain fixed cell temperature T is shown in Figure 1. For a resistive load, the load characteristic is a straight line with slope I/V=1/R. The power delivered to the load depends on the value of the resistance only.
If the load R is small, the cell operates in the region M-N of the curve in Figure 1, where the cell behaves as a constant current source, almost equal to the short circuit current. On the other hand, if the load R is large, the cell operates on the regions P-S of the curve, the cell behaves more as a constant voltage source, almost equal to the open-circuit voltage [2].
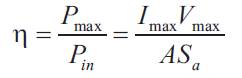
The operating point A (Vmax Imax ) in Figure 1, at which the power dissipated in the resistive load is maximum is the maximum power point. It is desirable to operate the system at this point. Maximum efficiency is the ratio between the maximum power and the incident light power.
Where, Sa is the ambient irradiation and A is the cell area.
The i-v characteristics of a PV cell are weather dependent, the effect of change in ambient temperature and solar insolation on the i-v characteristics is shown in Figure 2.
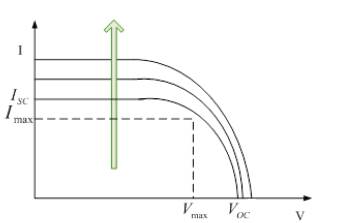
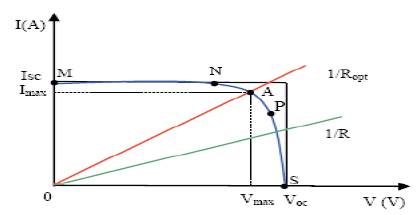
Figure 1. A typical, current-voltage i-v curve for a solar cell for different resistive loads.
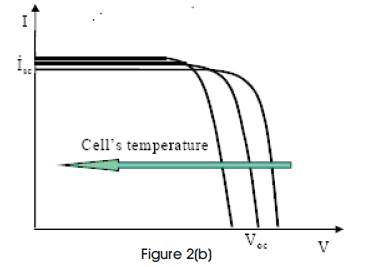
Figure 2. Change in cell i-v characteristics with change in 2 (a) ambient irradiation, 2 (b) cell temperature
The open circuit voltage decreases linearly with the increase in the cell temperature and open circuit voltage increases logarithmically with the ambient irradiation, while the short circuit current is a linear function of the ambient irradiation. The arrow shows the sense in which the irradiation and the cell temperature, increases [2,7, 9].
In this work the PV cell is simulated using an equivalent circuit model with moderate complexity, as shown in Figure 3. The model consists of a current source (ISC ), a diode (D), and a series resistance (RS).
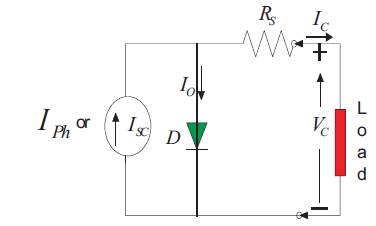
Figure 3. Model, with moderate complexity
To make a better model, temperature effects on the shortcircuit current (ISC ) and the reverse saturation current of diode (Io) has been included. It uses a single diode with the diode ideality factor (A), set to achieve the best i-v curve matching. The i-v equation can be written as [5, 6, 8]
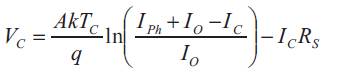
Both k and Tc should have the same temperature unit, C either Kelvin or Celsius. The curve fitting factor A is used to adjust the i-v characteristics of the cell to the actual characteristics obtained by testing.
When the ambient temperature and irradiation levels change, the cell operating temperature also changes, resulting in a new output voltage and a new photocurrent value. The solar cell operating temperature varies as a function of solar irradiation level and ambient temperature. The variable ambient temperature Ta affects the cell output voltage and cell photocurrent. These effects are represented in the model by the temperature coefficients CTV and CTI for cell output voltage and cell photocurrent, respectively as, [4] .
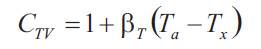
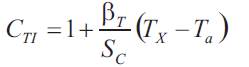
Where, βT=0.004 and βT= 0.06 for the cell used and Ta=250C is the ambient temperature during the cell testing. This is used to obtain the modified model of the cell for another ambient temperature Tx. Even if the ambient temperature does not change significantly during the daytime, the solar irradiation level changes depending on the amount of sunlight and clouds. A change in solar irradiation level causes a change in the cell photocurrent and operating temperature, which in turn affects the cell output voltage. If the solar irradiation level increases from Sx1 to Sx2, the cell operating temperature and the photocurrent will also increase from Tx1 to Tx2 and from Iph1 to Iph2 , respectively. Thus the change in the operating temperature and in the photocurrent due to variation in the solar irradiation level can be expressed via two constants, CSV and CSI , which are the correction factors for changes in cell output voltage VC and photocurrent Iph , respectively:
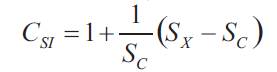
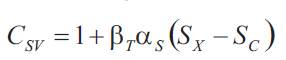
Where,Sc is the benchmark reference of solar irradiation level during the cell testing to obtain the modified cell model. Sx is the new level of the solar irradiation. The temperature change, ΔTC, occurs due to the change in the solar irradiation level and is obtained using
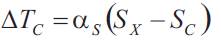
The constant β s represents the slope of the change in the cell operating temperature due to a change in the solar irradiation level [10] and is equal to 0.2 for the solar cells used. Using correction factors CTV,CTI,CSV and CSI , the new values of the cell output voltage VCX and photocurrent I Pxx are obtained for the new temperature Tx and solar irradiation SX as follows:
Where CV =CTVCSV is the coefficient of change in voltage and CI=CTI CSI is the coefficient of change in current. VC and VPH are the benchmark reference cell output voltage and reference cell photocurrent, respectively.
The use of photovoltaic as the power source for pumping water is one of the most promising areas in photovoltaic applications. With the increased use of water pumping system, more attention is paid to maximize the output of water with maximum utilization of solar isolation and proper matching of DC motor with PV source. The use of photovoltaic for water pumping is appropriate as there is often a natural relationship between availability of solar energy and the water requirement. The water requirement increases during hot weather periods when the solar radiation levels are highest and the output of the solar array is maximum. In rural areas with no access to grid power, national water authorities and private farmers have to rely on hand pump and diesel driven pump, many of which remain out of service due to technical defects or lack of fuel. So application of PV generators for water pumping applications, especially in remote area of developing countries, has received much attention. Utilities are finding it more economical to use a photovoltaic powered pump than to provide and maintain a distribution line to remote area. The cost of photovoltaic installations mostly depends on PV array area. The major disadvantages of using PV are the high installation costs and its low energy conversion efficiency. Significant cost penalties result from over sizing of PV system. Therefore in order to improve the cost effectiveness of PV array powered system, the electric powered generated by PV array should efficiently utilized. A typical PV pumping system consists of a photovoltaic (PV) cell array, a power conditioner, load and other accessories such as energy storage, cabling, transducers and protection.
The power conditioning stage consists of a power converter associated with a suitable control unit. To avoid the use of an inverter, which will be required to drive the induction motor direct coupled water pumping system is chosen. Since the output of a PV generator is essentially dc in nature, a dc motor is an obvious choice for the prime mover of the pump as direct-coupled systems, it is simple and reliable, but do not operate at maximum power operating point of the array, due to continuous variation of solar radiation. Sufficient radiation must be available for a PV pumping system to start its pumping operation. The dc motor option gives better overall efficiency for low power applications. Therefore, for low power applications dc motors are preferred in spite of maintenance problem. The matching of separately excited and series excited DC motor with PV array for maximum daily gross mechanical energy reveals that separately excited DC motors are more suitable for such applications [2, 8]. Separately excited motor driving a centrifugal load is most compatible with PV array, Performance further improves by use of dc compound motors(having both constant and series excited field components) [6].
As separately excited motor requires a separate PV source to energize the field winding, so permanent magnet dc motor (PMDC), is the most popular choice for water PV pumping. Moreover it avoid the losses of the field excitation, the efficiency improves however, even with PMDC motors, and perfect matching with the PV source is possible only at unique ambient condition. Normally close matching takes place at high insolation that occurs for short period of time, therefore sun tracking (a mechanical method) is employed which some how improves the matching condition at low insolation. Normally sun tracking PV panel are designed to manually change the orientation of PV panels three times a day to maximize the incident solar energy. By sun tracking 20% more output can be obtained as compared to fixed tilted PV panel [6, 7]. The water discharge rate is calculated using fixed azimuth angle as well as variable azimuth angle, the variation shows the improvement in the discharge rate. A method is developed to predict the long-term performance of direct-coupled PV pumping systems. The method uses only information available from the PV module and pump-motor manufacturers.Weather data are ''generated'' from monthly averages of horizontal radiation and ambient temperatures using wellknown weather data statistics [7] . Using an array tracking system or a specially designed DC motor are the other options to maintain optimum matching at most radiation levels. Application of this method requires the knowledge of long-term meteorological data for the design site and the technical specifications of the PV-panel, the DCmotor, and the pump [2]. An alternative method of improving the matching is using different series-parallel array configurations for different ambient conditions [2].
The more accurate matching needs interfacing of dc-dc converter between the PV source and load, the duty ratio of converter is changed to match the load to solar cell array. If converter is assumed ideal then all the array power will deliver to the motor. When solar cell operating at maximum power point, the power absorbed by the motor is equal to the power delivered by the solar cell array [2, 10].
The more accurate matching needs interfacing of dc-dc converter between the PV source and load, the duty ratio of converter is changed to match the load to solar cell array. If converter is assumed ideal then all the array power will deliver to the motor. When solar cell operating at maximum power point, the power absorbed by the motor is equal to the power delivered by the solar cell array [2, 6].
More than 2 billion people, mostly in developing countries, live in remote areas without access to gridconnected power. In India, there are four to five million diesel-powered water pump sets, each consuming about 3.5 kW. The requirements of PV modules are around 1000 peak MW, for converting these diesel pump sets into the PV pump system [2].
The equations of PV cell in section 2 are simulated using simulink MATLAB software. Figure 4 shows the simulink block representation of a fundamental PV cell. The details of the PV cell block are shown in Figure 5. Here the coefficient of change in voltage CV and coefficient of change in current CI are implemented using CV and CI calculation blocks and cell output voltage VC is obtained using PV cell equation block.
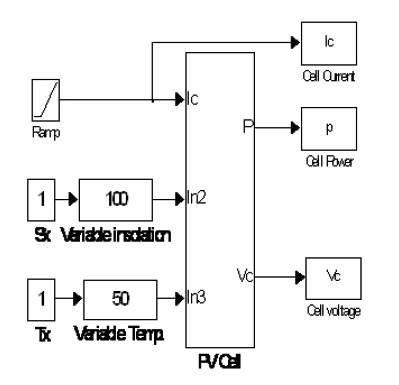
Figure 4. Simulation Model of a PV cell.
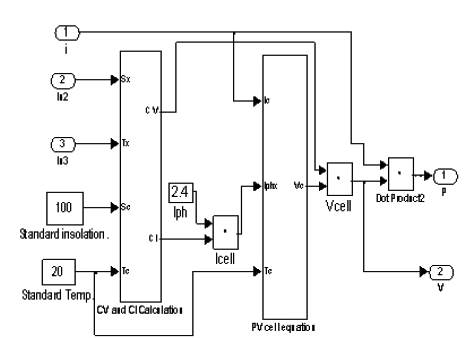
Figure 5. Details of PV cell block
Details of PV cell equation are shown in Figure 6. The simulink block consists of different math operation block taken form MATLAB simulink library. The saturation limiter block imposes upper and lower bounds on a signals IC ,(IPHX +IO -IC ) and cell out put VC .When the input signal are within the range specified by the Lower limit and Upper limit parameters, the input signal passes through unchanged, otherwise signals are clipped to the upper or lower bound.The effects of the changing temperature and solar irradiation level are modeled inside the block called as “CV &CI calculation block” shown in Figure 7.
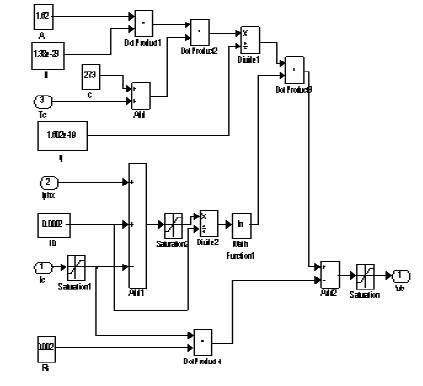
Figure 6. Details of PV cell equation block
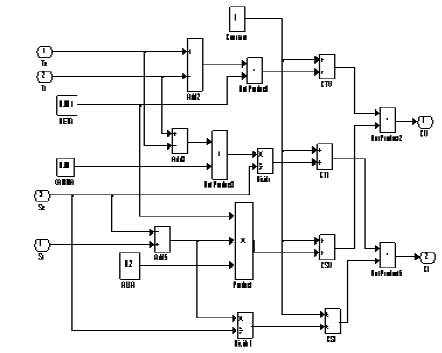
Figure 7. Details of CV and CI calculation block
The variable ambient temperature Ta affects the cell output voltage and cell photocurrent. These effects are represented in Figure 7 by the temperature coefficients CTV and CTI . Similarly the effect of solar insolation is represented by two constants CSI ,CSV . These four values are the correction factors for the cell output voltage VCX and Iphx photocurrent for new temperature TX , and solar irradiation SX.
The resulting i-v and p-v curves of the PV for various temperatures and solar irradiation levels are illustrated in Figure 8 (a, b, c). The PV cell output voltage and current are sensitive to change in solar radiation and ambient temperature thus the effect of changes in the ambient conditions are taken in the proposed PV cell model.
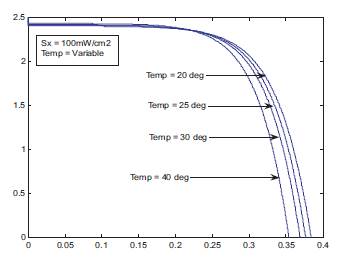
Figure 8(a). i-v characteristics at variable Tx
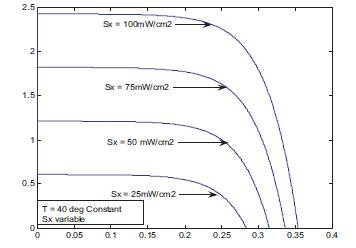
Figure 8(b). i- v characteristics at variable Sx
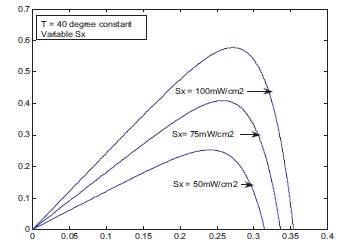
Figure 8(c). p-v characteristics at variable Sx
Figure 8: Different output curve of simulink model of PV cell.
The simulation model of PV array from the PV cell model is presented in section 4. The output voltage VC of the cell is multiplied by the number of the cells in series NSE to obtain the array voltage “Varray” The no. of series connected cell in the array is given by NSE = NSM NCN.
Where NSM is no. of series connected module in the array and NCN is the no. of cells in each module.
The array current “Iarray” is obtained by multiplying the cell current with the number of modules connected in parallel (NP) as shown in Figure 9. The array power is simply obtained by multiplication of the array voltage and current using dot product block.
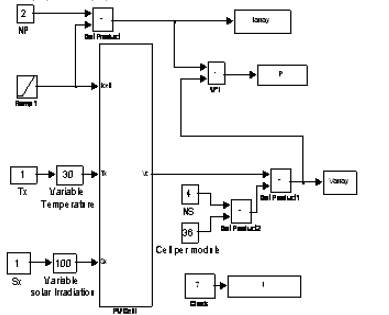
Figure 9. Simulink block diagram of PVG / Solar array
The simulation model was run for NS = 4, NP = 2 for different solar irradiation and temperature. Figure 10(a) and (b) shows the characteristics of the PV array for different insolation at constant temperature of 25βC. The characteristics of PV array for different temperature at constant solar irradiation of 100 mW/cm2 are shown in Figure 11(a) and (b).
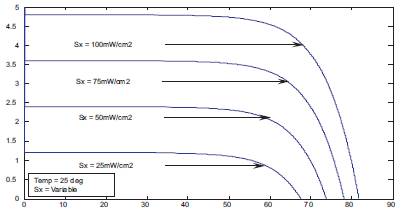
Figure 10 (a) i-v Characteristics at Tx=25 oC
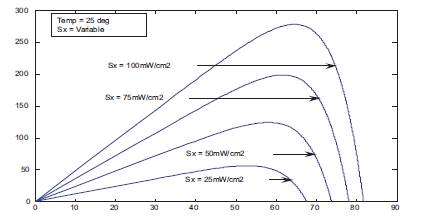
Figure 10 (b). p-v Characteristics of PV array with o variable insolation at Tx = 25 oC .

Figure 11 (a). i-v Characteristics at Sx=100mW/cm2
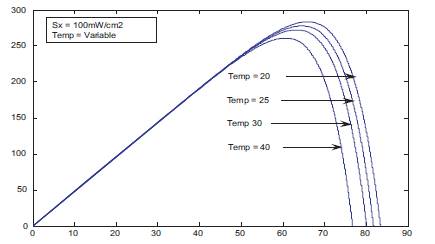
Figure 11 (b). p-v Characteristics of PV array with variable 2 temperature at Sx = 100mW\cm2
The Simulink MATLAB software is used for simulation of the directly coupled photovoltaic water-pumping system. Figure 12 shows the simulation model of the system. The PVA block represents the simulation model of PV array. Motor-pump system block are shown in Figure 13. The model implements the following equations of the system described using various functional blocks. The voltage equation of the motor is given by
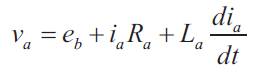
Where La is the self inductance of the armature winding and eb is back emf..
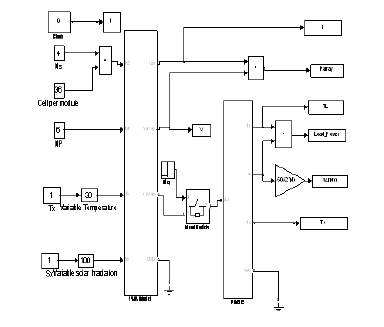
Figure 12. Simulink model of directly coupled PV powered water pumping system
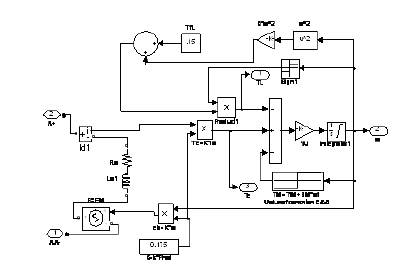
Figure 13. Simulink model of PMDC with centrifugal load
The dynamic equation of the motor-pump system is given by
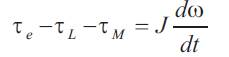
Where J is the moment of inertia of the system in kg-m2 . Te is the electromagnetic torque developed by the motor.
The load torque for a centrifugal load is given by
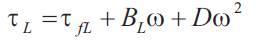
Where TfL and BL are the coulomb friction torque and friction torque constant of the load, respectively. D is another constant of the load. The friction torque of the motor is given by
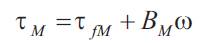
Where TfM and BM are the coulomb friction torque and friction torque constant of the motor respectively.
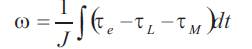
Using above equations
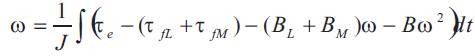
Simulation was carried out upto 35 seconds for various ambient conditions using different series parallel combinations of PV modules. The different waveforms for 2 insolations of 100 mW/cm for one configuration of PV array is shown in Figure 14. Initially DC motor speed is zero, as soon as PV array is connected to it, open circuit voltage is directly applied to the motor terminals, armature current rises sharply and the maximum starting current of the motor is mainly limited by the short circuit current of PV array. This is because the PV panel is virtually short circuited by low resistance armature circuit of the motor. Thus, the panel current rises sharply almost equal to short circuit current of 14.4 Amp for insolation of 100 mW/cm2 .The panel voltage drops to a very low value (to 30 V for 100 2 ) mW/cm The reduction in the voltage depends on the insolation. After 1 second armature current starts reducing and simultaneously voltage increases and settled down at steady state condition almost after 13-14 seconds. The the current, voltage, load power, speed v/s time characteristics are shown in Figure 14(a, b, c, d). All the three quantities increases with time and finally settle down to steady state value in about 15 seconds.
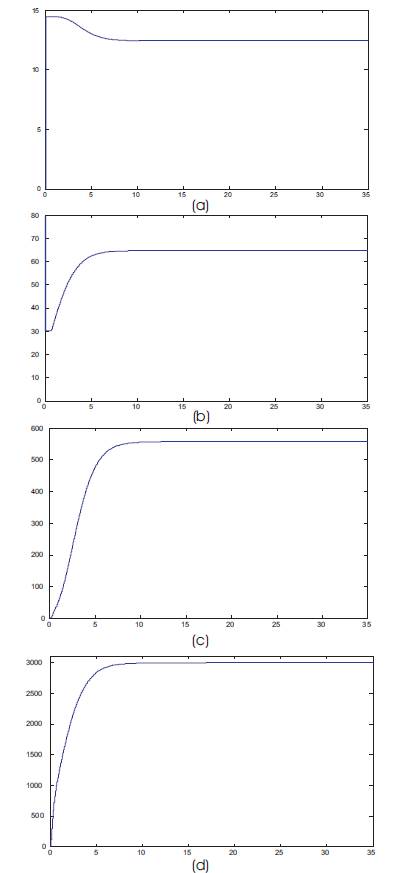
Figure 14. Simulation waveforms of (a) current (b) voltage 0 (c) power of PV panel (d) speed for Tx = 30o C, 2 Sx = 100mW/cm2 , Ns = 4, Np = 6
The PV based water pumping system used for experimental analysis is shown in Figure 15 and 16. A total of 16 PV modules are used. Four modules are connected in series to form one string. Four such strings are connected in parallel. The PV array has a fixed tilt of 30 degree with the horizontal axis. The PV panel can be moved on a vertical axis to change its orientation from east to west. The panel may be fixed at three different orientations, to face the sun for most part of the day. In position 1, the panel is fixed facing east-south direction, in position 2 it faces the south direction and in position 3 it is oriented in south-west direction. Out put of the PV array is directly applied to a 60 V, 1 hp PMDC motor coupled to a centrifugal pump. The suction pipe is immersed in a 100 liter water reservoir tank providing a suction head of 1.2 meter. The water is discharged in the same water tank through the delivery pipe via Karanti water-meter and a throttle valves. The water-meter measures the total volume of water pumped. The throttle valve is provided before the water meter to increase the effective head. The whole arrangement forms a closed loop water pumping system. The effective head of the system is about 1.3 meter.
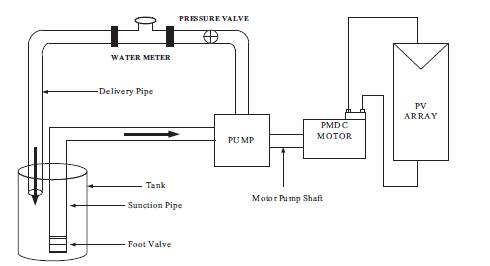
Figure 15. Experimental setup diagram of directly coupled water pumping system.
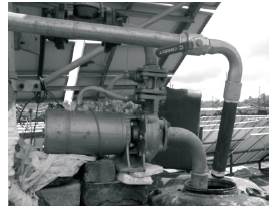
Figure 16. Photograph of the PMDC motor pump.
The water-pump was operated from 8:20 AM to 4:50 PM in the month of June. To investigate the flow rate with panel fixed in position 2 (Facing south direction), the reading of water-meter was recorded at every 30 minutes. These readings were used to calculate the amount of water pumped in each interval of 30 minutes and average flow rate in each interval. Similar readings were recorded with manual tracking. In this, the panel is fixed in position 1 in the morning and position 2 in the noon and in position 3 in the afternoon. The results are shown in Figure 17. Figure 18 shows the bar graph of volume of water in different intervals of day for fixed and manual tracking. It shows that volume of water-pump with manual tracking is more between 8:50 to10:50 AM and 12:50 to 3:50 PM as compared to fixed but it is almost constant in between 11:20AM to 12:20 PM.
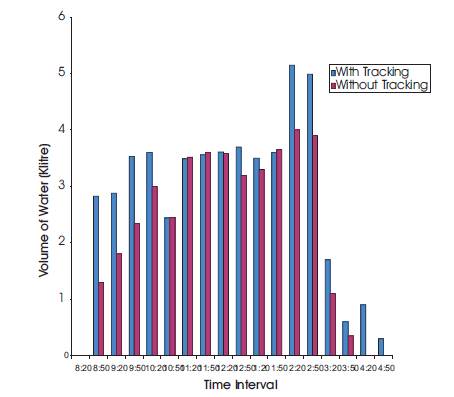
Figure 17. Discharge of water in different intervals of a day.
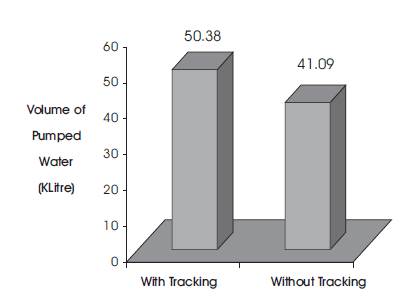
Figure 18. Total discharge in a day, with and without Tracking.
This paper presents modeling and simulation of a photovoltaic cell and array. A SIMULINK model of the cell is developed considering the effects of insolation and temperature. Modification in solar cell SIMULINK model is done to obtain the model of a PV array. SIMULINK model was developed for a PV based water-pumping system consisting of a PMDC motor coupled to centrifugal pump. The performance of the system for different array configurations of the PV array is analyzed. It was observed that both motor and array operate efficiently at high insolation and the performance deteriorates at lower insolations. It is concluded that the effective insolation can be increased if a sun tracking PV array is used.
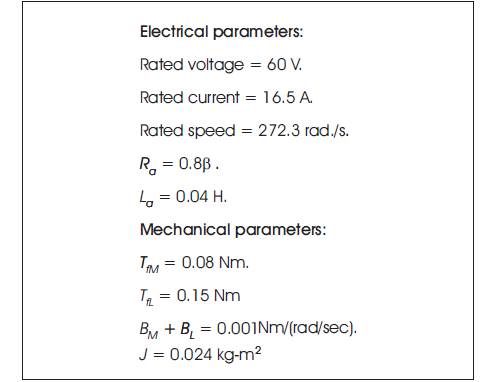
The water-pumping system used for theoretical study has the following parameters.