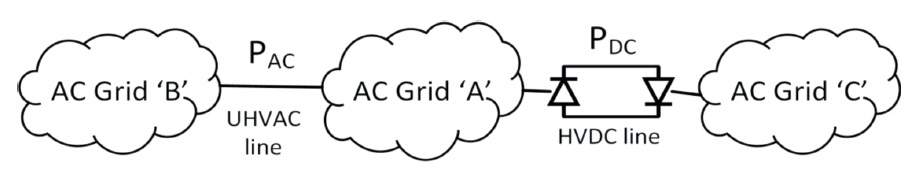
Figure 1. Interconnected AC Grid System with HVDC Link
This paper proposes a novel method of rapid calculation of the peak amplitude of the power surge at one of the AC side in the asynchronous grid connected with a HVDC network due to other AC side fault. The proposed approach is based on simple linear modeling of a HVDC network connecting two asynchronous AC grids. The proposed approach helps in the rapid estimation of peak value of power surge at the AC grid and hence quickly initiating protection measures. The proposed method has been implemented on standard PSCAD HVDC system and results have been compared with calculated values which verify the aforementioned approach.
One of the major applications of HVDC link is to bridge two asynchronous AC grids. There are many ways to establish HVDC link to join two asynchronous AC networks (Kim et al., 2010; Padiyar, 1990). This kind of link creates additional protection as fluctuations from in one AC network usually do not transfer to another AC network through HVDC link. However, it is not always the case. Commutation failure (Thio et al., 1996) in CSC based HVDC network is a good example where fluctuations created in one AC grid could actually move through HVDC line and affect the other AC network. In the year 2012, China's power grid experienced a similar situation where commutation failure occurred in HVDC network multiple times (Cao et al., 2018). As per reports, this commutation failure led to a high amplitude power surge in UHVAC 1000kV line, connecting China to Central China power grid (Liu et al., 2015).
There are multiple methods for the calculation of power surge under commutation failure in traditional CSC HVDC networks, like utilizing highly detailed dynamic models of HVDC linked AC grid (Yin & Li, 2020; Wu et al., 2020; Rahimi et al., 2011) or using artificial neural networks based models (Venkatesh & Rao, 2016) that require a lot of real fault related data which is not really easy to obtain owing to less number of commutation failures around the world.
In this paper, a practical and very fast executable approach has been taken to estimate peak values of power surge in the AC grid Connected to HVDC network. Instead of using highly detailed model of dynamic electrical system, this method utilizes linearized model for electrical system which is much simple and computationally less expensive as compared to standard dynamic model of AC grid. This method can help in quick estimation of peak power surge values and triggering protection sequences of AC power grid.
The proposed method establishes the calculation of power surge in AC grid connected to an HVDC network as shown in Figure 1. There are some considerations have to be taken while modeling this system:
Figure 1. Interconnected AC Grid System with HVDC Link
The AC grid network shown in Figure 1 can be reduced to two machine system as shown in Figure 2, where input going to DC link has been shown as a simple DC sink.
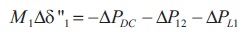
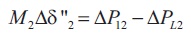
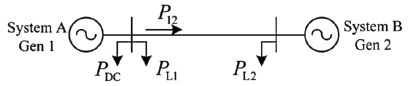
Figure 2. Linear Model of Two Machine System of AC Grid A and B
where M1 , M2 are inertia constant; δ1, δ2 are power angles; ∆Pdc is the power deviation from HVDC link; ∆P12 is power deviation in AC link; ∆PL1, ∆PL2 are load connected at machine 1 and 2.
The difference between power angle of Gen 1 to Gen 2 can be deduced in following Equation.
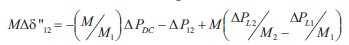
where, 
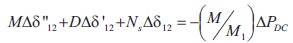
The Equation (3) could also be arranged as,
where, 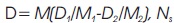
D= M(D1/M1- D2/M2), Ns is Synchronizing coefficient, D1 D2 are damping constants.
The Equation (4) is a second-order differential equation for power angle difference ∆δ12. This could be again modified as,
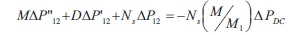
where, 
From the second-order Equation (5), the solution could be derived for an impulse input which is given as,
Where damping coefficient 
natural frequency 
DC side fluctuations in interconnected HVDC network have relatively high frequency as compared to AC side fluctuations, especially Commutation Failure Fluctuations (CFF) frequency is 100 Hz or more in HVDC line while HVAC line the CFF frequency goes below till 0.1 Hz. So, the fluctuations in the DC line will be considered as an impulse DE which is given as,
Here n is the number of actual DC branch, tci is the commutation failure time period, PDCi and P DCi0 are the HVDC link power during CFF and before CFF.
We get first peak value of the Equation (6) by  ,for practical AC grids ζ <<1 when the modified equation will be as given in Equation (8).
Here, time of the peak value is,
Equation (8) is the proposed a question from which peak value of the power surge can be calculated and the time taken in this calculation is way much less than standard equation (PowerFactory, 2009).
For the validation of the proposed solution, a test system has been modeled in PSCAD-EMTDC program. The parameters of AC system Grid A and B have been given in Table 1.
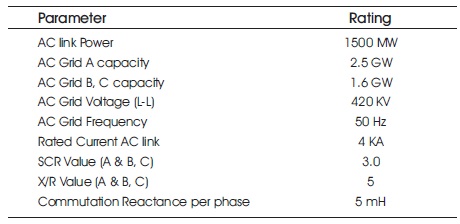
Table 1. AC System Specifications
The HVDC link has been modeled as per the CIGRE standard (Szechtman & Wess, 1991). The parameters of DC link are given in Table 2.
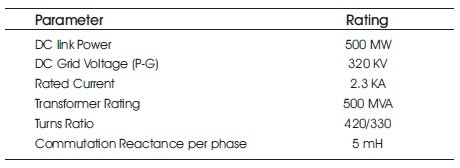
Table 2. DC System Specifications
The power impulse in Equation (6) will give the surge value in UHVAC link between Grid A and Grid B as per Figure 1. The HVDC link is connected between Grid A and Grid C. If Current Source Converter (CSC) near Grid A experience Commutation Failure (CF), that will be observable at Grid A.
In the test setup, two CF introduced at CSC near Grid A and a phasor measurement unit is connected in Grid A for the observation of power surge. Prior to CF introduction, it has been assured that the modeled system works properly. From the reference point at PMU record, the simulation gets started 1 min before and at the time just before application of CF the system is under steady state condition.
An additional mathematical model for implementation of the Equation (8) and Equation (9) has been executed for the calculation of power surge. The outcome of proposed method is further compared with standard PSCAD model HVDC link interconnected with two AC machine models. The result has been shown in the Figure 3, where commutation failure fluctuation has been recorded in phasor measurement unit (PMU). The results have also been included in Table 3. It is evident that fluctuations due to CF are close to the calculated results.
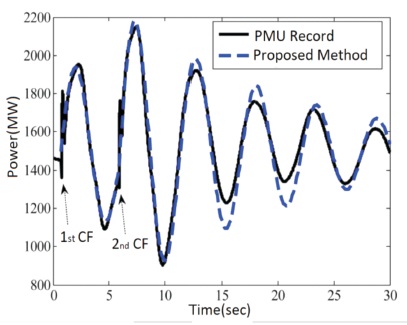
Figure 3. Power Surge at UHVAC Line
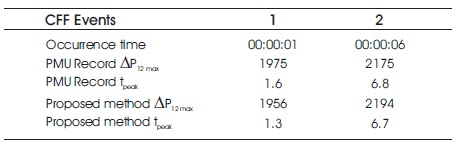
Table 3. Calculation Results
The result in the Table 3 indicate that in a particular peak oscillation time 't ', it shows the delay in PMU record and peak calculated peak values. This is due to the delay function of PMU in the standard simulation. The proposed method as mentioned, assumes that AC grid has very high inertia, but in practical situations AC grids have limited inertia as it has been modeled in the standard simulation. This leads to difference in calculated and simulated power oscillations as observable in the Figure 3.
For the practical situations the method requires power fluctuation data at the time of triggering. Any computational unit connected to the grid can start calculating the estimated power surge time and surge value. With the help of this method the power surge will be known few seconds earlier and precaution measures can be taken accordingly.
The proposed method finds much closeness to the simulated standard model in PSCAD program which validates the method. This method can easily be implemented in interconnected HVDC link system in India where commutation failure is not uncommon and computation quickness is necessary for the quick reaction of protective sequences.