Figure 1. Dimensions of Rotor Bearing
Being an integral part of any engineering system, electrical machines are used in all industries. Among all these machines, very common type of machine is induction motors. Motor faults can lead to untimely shutdown of machines and consequently lead to loss of productivity. This can be avoided by the proper detection of fault in the incipient stage itself, which requires a detailed analysis of the fault and clearly understand its effect on the motor. This paper presents a method to analyse the frequently occurring rotor bearing fault on an induction motor. The fault analysis is conducted using two ® parameters: Stator current and voltage by Motor Current Signature Analysis and the motor flux distribution using ANSYS Maxwell 2D.
Induction motors have a wide range of applications in industrial applications. These machines are robust, require low maintenance, and relatively operating at higher efficiency. Although they are highly reliable, open circuit and short circuit faults are common to Induction machines. Statistical data depicting the frequency of occurrence of faults on a motor shows that the possibility of occurrence of bearing fault is high according to IEEE Standard 493-1997 (IEEE Std.493-1997). Similarly, another statistical survey conducted by the Electric Power Research Institute (EPRI) provides further proof that the chances of bearing fault in an induction motor is high compared to any other fault. The results state that 41% of the total occurring faults were bearing faults. 37% of total occurring faults were stator faults, 10% of the total occurring faults were rotor faults and the remaining 12% of the total occurring faults, in an induction motor were other types of faults.
The various faults that occur in an induction motor are the stator inter-turn fault, open circuit fault, broken rotor bar fault, and the rotor bearing fault. An open circuit fault occurs when the stator windings are open circuited. Although induction motors are reliable, the possibilities of faults are unavoidable. Failures may be caused due to faulty operating condition or due to failures that are inherent to the machine itself. Among the above mentioned faults, the most frequently occurring faults is the rotor bearing fault. (Siddiqui, Sahay, & Giri, 2014; Chaturvedi, Iqbal, & Singh, 2013). The rotor bearing fault, if not diagnosed at earlier stage, might lead to decrease in machinery availability, reduction in machine life, and as a whole reduce production. Hence, it becomes essential to detect the occurrence of faults in the machine and analyze the same in order to understand it.
Induction motors are with simplest construction and because of that the monitoring of the health condition also must be simple. There are different methods reported in literature for the health monitoring of the induction motors. Basically, the energy conversion in these machines are through magnetic medium, whatever faulty operation happens in the system will reflect on the air gap flux. So, if the air gap flux is properly analyzed, most of the fault can be identified at the earliest stage itself. One of the common method to analyse the air gap flux is using Finite element method (Saied & Ali, 2013; Zagirnyak, Romashihina, & Kalinov, 2013). Whenever there is an abnormal variation in the air gap flux, it will immediately reflect in the stator current and voltage of the induction machines. So if these signals are captured in real time and do the proper analysis of it, most of the fault conditions can be diagnosed.
Motor Current Signature Analysis (MCSA) is a method used for the identification of faults in the machines. In this, the winding of the stator itself can be used as a search coil. Stator currents are captured and monitored closely. The main advantage of this method is that the current signature captured for the analysis is independent of the type of load or the asymmetries in the load (Thomson & Gilmore, 2013).
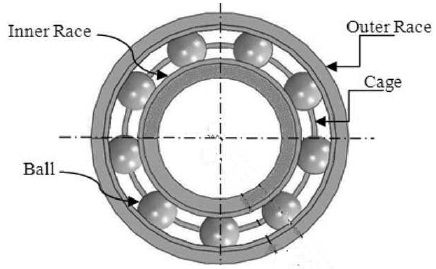
In most of the machines, ball bearings or rolling element bearings are used for the smooth rotation. These bearings will have an outer race, inner race, balls, and tracks. Fault can happen in any of these parts of the bearings. This fault can be due to vibrations, electrical and mechanical stresses, eccentricity present inherently in the system or the currents in the bearings. Mainly this can happen due to the high loading of the machine, which can cause a temperature increase inside the bearings. Usage of bad lubricant also can cause high heat in the bearings (Singal & Khandekar, 2013; Benbouzid, 2000). Normally, outer race and inner race are placed at a distance and all the balls in the bearings are placed at equal distance.
MCSA is a system used for analyzing or trending dynamic, energized systems. Analysis is mainly based on the nature of the current spectrum captured during fault conditions. Studies are conducted for the identification of different types of faults in induction (Mehala, 2010; Hardik, Sinha, & Vijayaraj, 2013).
Some of the common types of faults that occur in any motor used in industrial applications are stator inter turn faults, broken rotor bar faults, and broken end ring faults. The effect of these faults on induction motors are the unbalance in stator voltage and stator current and oscillations in the motor torque (Mehala & Dahiya, 2010). These faults, when left undetected, can lead to catastrophic effects, such as excessive vibration, overheating, and ultimately lead to motor failure thereby creating a loss in productivity of the motor.
Various statistical studies were conducted (Sakhalkar & Korde, 2017; Bhattacharyya, Sen, Adhvaryyu, & Mukherjee, 2015; Singh, Kumar, & Kumar, 2014) in the past to find out the frequency of fault occurrence in various industrial motors. According to IEEE Standard 493-1997, it was found that the bearing fault is the most frequent fault.
To successfully analyze any type of fault present, there are various condition monitoring techniques available. Some of the prominent techniques include thermal monitoring, noise monitoring, and current signature analysis (Vinothraj Kumar, & Isha, 2018).
This paper mainly deals with proving the presence of a bearing fault in a faulty induction motor by analyzing two parameters of the motor – voltage and current signatures, and the motor flux distribution. By analyzing the motor in terms of these parameters, one can clearly understand the effects of these faults.
In this paper, to identify the presence of fault in the motor, MCSA technique is used. This technique takes advantage of the fact that the occurrence of a fault is reflected on the stator current. After the successful detection of fault, further analysis is done and the effects of fault at various load conditions of the machine have been observed. The focus of the next phase of the paper is to analyze the effects of the bearing fault in the electromagnetic domain. The design and modeling of the machine was achieved in ANSYS Maxwell 2D simulation environment. Additionally, various parameters like flux distortion, current waveforms, and its fast Fourier transforms were studied in order to clearly understand the effects of bearing fault on the machine.
This is a powerful analysis method for monitoring the operating conditions of AC machines. Most of the times, the incipient faults can be resulted in a total system failure due to unnoticed changes in the operating behavior of the machines. MCSA is a method by which early detection of abnormal behavior of the machine is possible. The complete analysis by this method is based on the motor current signature captured during the operation of the machine and it does not require any additional transducers for the signal extraction. Because of this, this method is not expensive.
The fault identification is based on the patterns of the current signature and its frequency spectrum. The frequency spectrum of a faulty motor is different from a healthy motor. By properly analyzing the harmonics and the frequency band in the current spectrum, the types of fault and severity of the fault can be identified. It has been reported that the accuracy of the detection of fault by MCSA is very high, mainly in the incipient fault detection
Since the electrical signals can be captured easily, this analysis will avoid the sudden shutdowns of the motors. In this work, a hardware implementation of the detection of bearing fault using MCSA is done, which is explained in the following section.
A Bearing consists of two rings called inner raceway and outer raceway. A set of balls rotate in between these rings. Figure 1 clearly shows a bearing indicating the various parts present.
Figure 1. Dimensions of Rotor Bearing
Continual stress on the bearing may cause some parts to break free from it, resulting in increased noise and detectable vibrations. This may further lead to a distortion in the magnetic flux distribution, whose effect is clearly reflected on the stator current and a distortion in the stator current and voltage waveforms. Additionally, the defective part of the bearing always generates mechanical vibrations at the rotational speeds of each component. This gives rise to characteristic frequencies which are specific for the bearings and can be calculated by knowing the bearing dimensions. Bearing faults are of two types, namely distributed defects and single-point defects (Saied & Ali, 2013). In this paper, a 4 mm diameter hole is drilled in the outer raceway of the bearing in order to effectively analyze the effect of the fault on the motor as shown in Figure 2.
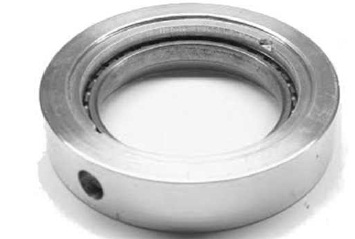
Figure 2. Faulty Bearing with Outer Raceway Fault Figure 3. Experimental Setup to Perform Signature Analysis
In order to successfully perform the signature analysis, the stator current of the machine was acquired. The setup that was used to achieve this is shown in Figure 3.
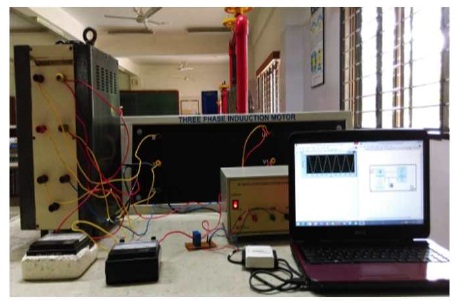
Figure 3. Experimental Setup to Perform Signature Analysis
The current is acquired with the help of a current transducer, which is in turn fed to a PC server via NI data acquisition card. The specifications of various components used in this setup are given below.
Three Phase Squirrel Cage Induction Motor:
Current Transducer:
NI USB-6009:
The stator current of the machine was acquired under various conditions: Figure 4 shows the stator current of a healthy motor under no load and full load conditions. Figure 5 shows the operation of a faulty machine with 4 mm outer raceway bearing fault under no load and full load conditions. It has been observed that as the system is faulty, the stator currents are distorted.
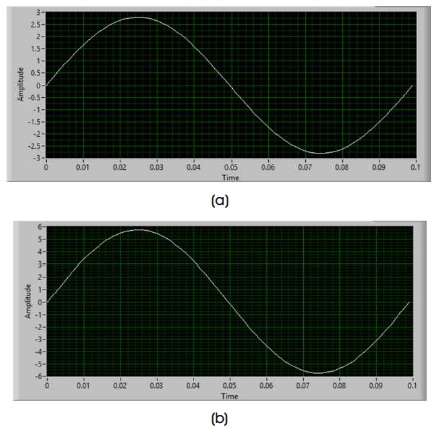
Figure 4. Stator Current of Healthy Machine Operating under (a) No Load (b) Full Load Conditions
After acquiring the current signals, it is fed to the NI LabVIEW to further analyze the signals. Various analysis like power spectrum analysis and fast Fourier transform analysis were done in order to study the effects of the fault.
Here for bearing fault detection, FFT based power spectrum is used for analysis. The spectrum is captured by interfacing the data acquisition system with LabVIEW. The specific frequency components are calculated by sampling the current signals in time domain. For each type of bearing fault for example, hole in inner or outer race of the bearings, number of balls damaged in the bearings, etc., the frequency components will be different and by closely detecting the frequency and amplitude, the type of fault and severity of the fault can be detected.
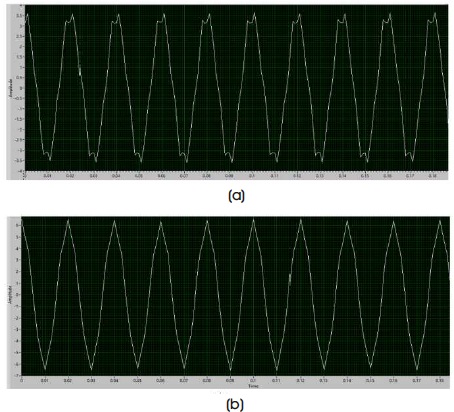
Figure 5. Stator Current of Faulty Machine Operating under (a) No Load (b) Full Load Conditions
1.2.1 Healthy Motor
The stator current of healthy motor is obtained and FFT is performed on it and similarly power spectrum is obtained. The magnitude of various slip frequency components are shown in Table 2, and are plotted in Figure 6 for no load and full load conditions, respectively.
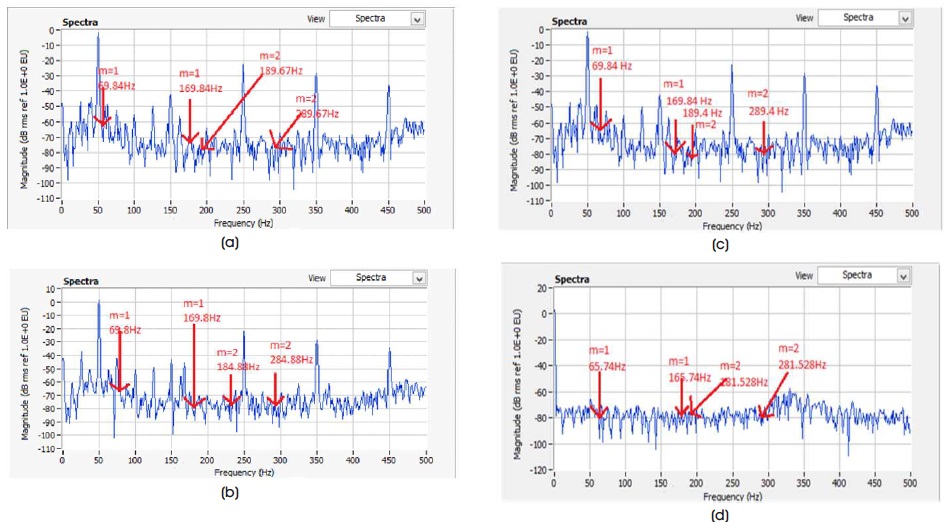
Figure 6. Power Spectrum of Healthy Motor under (a) No Load (b) Full Load Conditions. Power Spectrum of Faulty Motor under (c) No Load (d) Full Load Conditions. (Sampling Rate of 1K)
The power spectrum obtained from NI LabVIEW for the various conditions mentioned is shown in Figure 6.
In order to corroborate the presence of bearing fault in the machine, there should be an increase in magnitude of characteristic frequency components in the power spectrum (Chaturvedi, Iqbal, & Singh, 2013). The characteristic frequencies can be theoretically calculated from the knowledge of physical dimensions of bearings and the number of balls present. Thus, these frequencies can be calculated as:

where, fbr corresponds to the characteristic frequencies, fs being the supply frequency, and m takes various integer values. The value of fo, the frequency corresponding to outer-raceway fault, is calculated as:
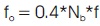
Nb corresponds to number of balls present in the bearing (6 in this case) and fr represents the rotor speed in Hertz. The value of f can be calculated as:

where, s represents the slip of the induction machine.
Thus, the characteristic frequencies were obtained for various operating conditions for healthy and faulty conditions and the corresponding magnitude of those frequency components were tabulated in Table 1 and Table 2, respectively.
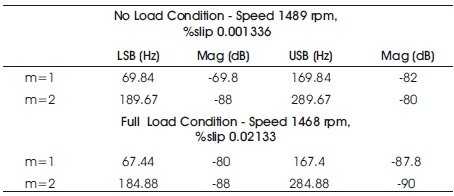
Table 1. Frequency Components of Healthy Motor
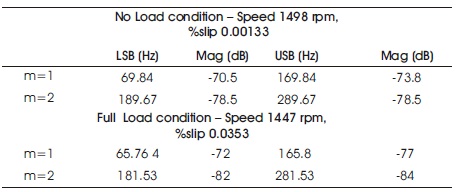
Table 2. Frequency Components of Faulty Motor
LSB and USB represent the Lower side band and Upper side band, respectively. It is evident from Table 1 and 2 that for a given load condition and for the same value of m, the magnitude of frequency component increases in the faulty motor. This proves the existence of bearing fault in the machine. Further, it was observed that when the machine is loaded, the magnitude increase is much greater. Thus, it becomes evident that when the machine is fully loaded, the fault in the system is more evident.
On completion of the spectral analysis of the motor stator current, the fast Fourier transform of the stator current is obtained. The FFTs of the healthy and faulty motors' stator current under no load and full load operation were obtained. The FFTs of the stator current were obtained by using the FFT extraction block available in NI LabVIEW. The FFT of the healthy motor's stator current is shown in Figure 7.
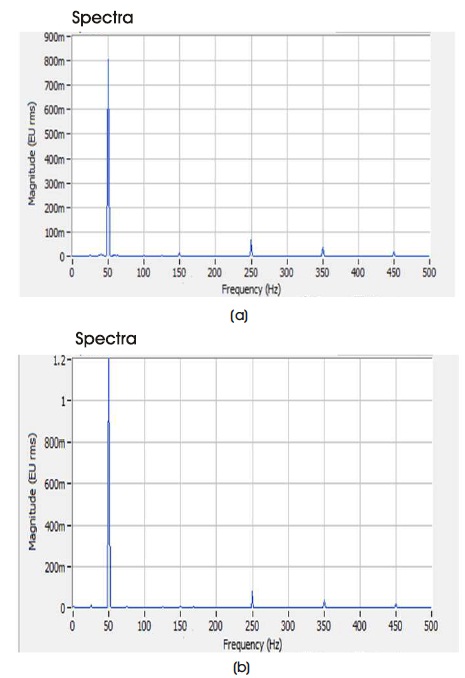
Figure 7. FFT of the Healthy Motor's Stator Current under (a) No Load and (b) Full Load Conditions
The FFT of the faulty motor's stator current is as shown in Figure 8. It can be observed from the FFTs in Figures 7 and 8 that as the bearing fault is introduced in the induction motor, the amplitude of the fundamental frequency component increases. In addition, as the healthy and faulty induction is loaded from no load to full load, the amplitude of the fundamental frequency components of the stator current increases. This increase hence corroborates the presence of a bearing fault.
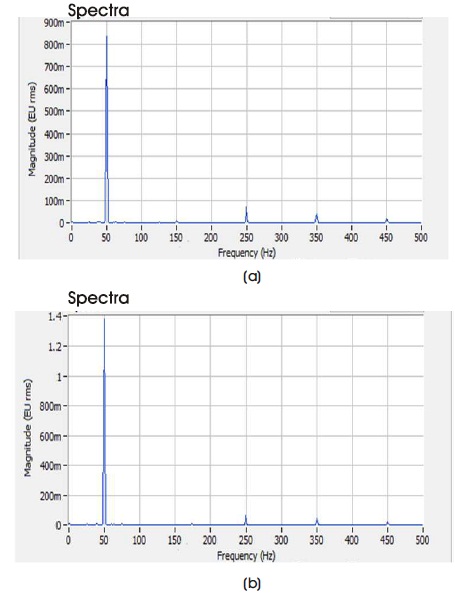
Figure 8. FFT of Faulty Motor under (a) No Load (b) Full Load Conditions
On completion of signature analysis using NI LabVIEW, a detailed analysis of bearing fault in an induction motor was studied by using ANSYS Maxwell 2D. Being one of the most reliable electromagnetic field simulation software, electrical engineers today implement this software for designing motors and actuators. By implementing ANSYS Maxwell 2D for rotor bearing fault diagnosis, one can clearly understand the effects of this fault in the induction motor internally. To implement this software for fault diagnosis, a three phase squirrel cage induction motor was modeled. The modeled induction motor was then analyzed by observing the flux distribution in the rotor, stator current, voltage and their corresponding fast Fourier transforms. A bearing fault was introduced in the induction motor and the same electrical parameters were analyzed, and inferences were drawn.
To perform analysis using ANSYS Maxwell 2D, a three phase squirrel cage induction motor was modeled using RMxprt, a package readily available in Maxwell 2D. Based on standard design formulae in equation (4), design parameters such as stator inner diameter, stator outer diameter, and stator bore were calculated (IEEE, 1997).
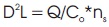
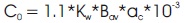
where L is the gross iron length, D is the stator bore, Kw is the rating power, Co is the output coefficient, Bav is the specific magnetic loading, and a is the value of specific electrical c loading (Siddiqui, Sahay, & Giri, 2014). D2L which was obtained from equation (5) was split into D and L. The ratio of core length to pole pitch (L/Ґ) for various design features is:
Good efficiency – 1.5
Good overall design – 1
Minimum cost – 1.5-2
Good power factor – 1.0 to 2.5
The optimum values of pole pitch and core length can be Estimated by using equation (6).

Standard values of insulation data have been used for modeling the induction motor. In order to successfully complete the motor design, slot data such as stator and rotor slot dimensions were required. These parameters were taken from standard values that are presently available. The values of stator and rotor slot dimensions are as shown in Table 3.
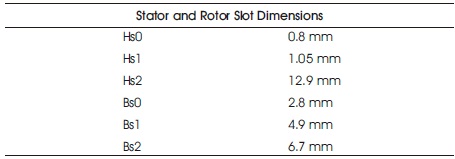
Table 3. Stator and Rotor Slot Dimensions
The number of conductors per slot was estimated by using equation (7).

where Sg is the number of stator slots and Tg is the total number of stator conductors.
In order to estimate the air gap of the induction motor, the following expression can be used:
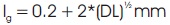
where lg is the air gap length, and D and L are expressed in meter.
Figure 9 illustrates a schematic diagram of stator and rotor slot design in Maxwell 2D with labels of its dimensions.

Figure 9. Stator and Rotor Slot Design
Table 4 represents a tabular representation of the design specifications of the three phase squirrel cage induction motor.
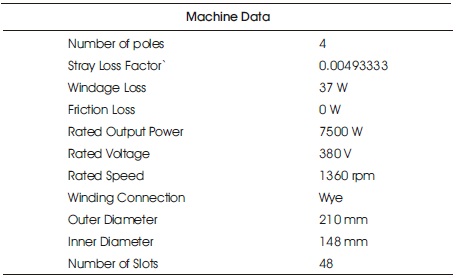
Table 4. Design Specifications of Modeled Induction Motor
On successful completion of the modeling of the induction motor using 'RMxprt', a validation check was performed on it. This was done to ensure that the design parameters were within the specified limits. A complete model of the three phase induction motor is shown in Figure 10.
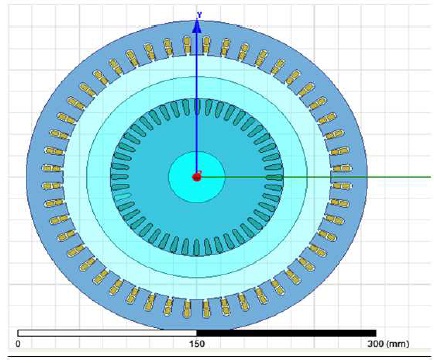
Figure 10. Model of Three Phase Squirrel Cage Induction Motor
After modeling the induction motor in RMxprt, the motor was analyzed by simulating the motor under different conditions of operation. As the software considers real time parameters of the motor, it performs finite element analysis. Keeping this in mind, the modeled motor was analyzed over a span of 325 ms with a time step of 1.75 ms. By analyzing the motor over this span of time, parameters, such as magnetic flux distribution, stator induced voltage, and current were obtained. The model of the analyzed three phase induction motor is as shown in Figure 11.
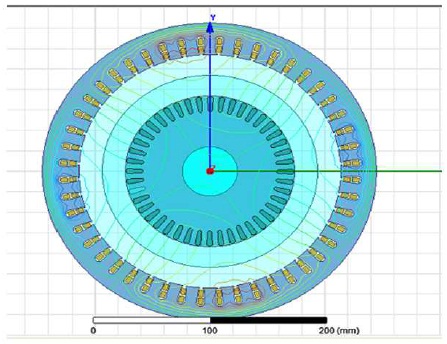
Figure 11. Model of Analyzed Three Phase Induction Motor
It is clearly evident from Figure 11 that the flux distribution is symmetric about the normal axis. This implies that no distortions are present in the magnetic flux distribution of the induction motor. In addition to the obtained flux distribution, the stator induced voltage and winding current were obtained. The waveforms of stator induced voltage, current, and its corresponding fast Fourier transform are shown in Figure 9.
It can be observed from Figure 12 that the motor draws a current of nearly 5 A and the induced voltage is nearly 230 V and the fundamental frequency component is dominant in the FFT of stator current.
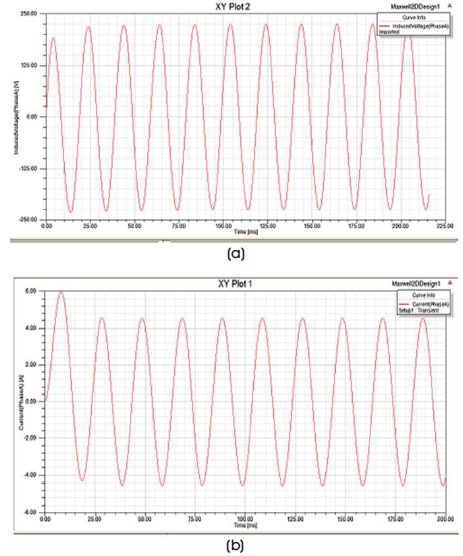
Figure 12. (a) Stator Induced Voltage (b) Stator Current of Healthy Induction Motor
After the analysis of the healthy induction motor, a bearing fault was introduced in the induction motor. Since Maxwell 2D is an electromagnetic CAD software, any physical disturbance on the machine model must be reflected on the electromagnetic domain of the machine model, i.e. parameters like magnetic flux distribution and winding currents. Hence the bearing fault was introduced in the simulation environment by displacing the rotor with respect to its origin.
The faulty induction motor was analyzed with the above mentioned time specifications in Maxwell 2D. Figure 13 shows the magnetic flux distribution of the analyzed faulty induction motor. Figure 13 (a) shows the rotor displacement of 4 mm and Figure 13 (b) for a rotor displacement of 8 mm.
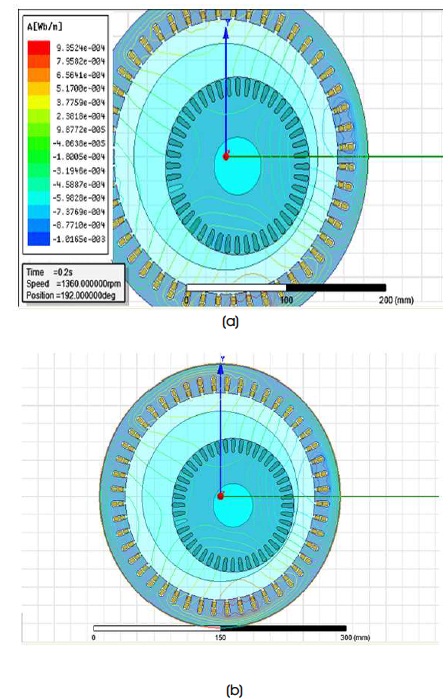
Figure 13. Flux Distribution of Faulty Motor with (a) 4 mm Rotor Displacement (b) 8 mm Rotor Displacement
It is clearly evident from Figure 13 that as the rotor bearing fault is introduced, a severe distortion in the magnetic flux distribution is observed about the normal axis. In addition, the severity of flux distortion increases as the rotor displacement increases. The stator induced voltage, current, and its FFT are shown in Figure 14.
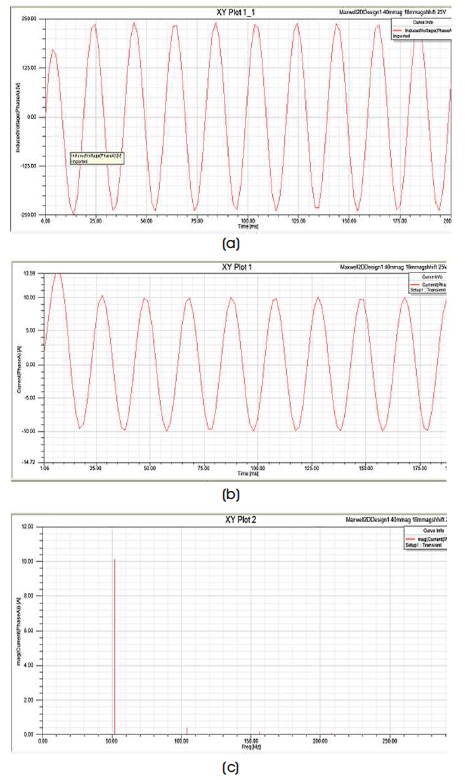
Figure 14. (a) Stator Induced Voltage (b) Stator Current (c) FFT of Stator Current of Induction Motor (Rotor Displacement of 8 mm)
It can be observed from Figure 14 that there exists a distortion in the induced voltage and every peak of its half cycle along with an increase in the amplitude of the induced voltage. In addition, the amplitude of current has also increased.
The presence of bearing fault was studied by performing motor current signature analysis using NI LabVIEW. Results of the analysis provide conclusive proof that bearing faults reflect as a distortion in stator current along with a severe increase in its amplitude. The effect of bearing fault was also studied by modeling and analyzing a healthy and faulty induction motor in ANSYS Maxwell 2D. The results obtained clearly explain the effect of bearing fault on the magnetic flux distribution and an increase in stator current of the induction motor.