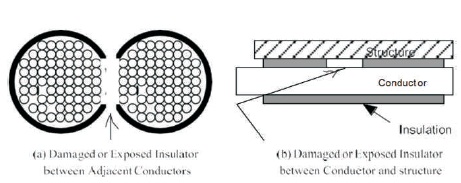
Figure 1. Insulation Breakdown Scenarios in Space Vehicle Power Distribution Cables
Weight is a critical factor in the design of deep space vehicles. Space bound electrical systems can be constructed to weigh less if designed as high voltage, high frequency AC power system. However, high voltage and high frequency power distribution systems have severe limitations in space exploration due to voltage breakdown and electrical discharge phenomena. Paschen law gives the breakdown voltage necessary to start a discharge between two electrodes in gas medium as a function of pressure and gap length. In the traditional experiment to verify Paschen law, pressure in a controlled vacuum chamber is set while a DC voltage across two electrodes is varied. This paper takes the reverse procedure, that is AC voltage across electrode gap is set and pressure in the vacuum chamber varied. The intention for this experimental approach is to observe the changes in the voltage across the electrode gap before, during and after voltage breakdown. At Nyquist sampling rate, the results recorded in the experiments is a near continuous graphical chronology of changes and oscillations in voltage across the electrode gap due to electron collision activities between the electrodes.
In space exploration, it is critical to minimize overall spacecraft weight to increase energy efficiency. For electrical systems and subsystems, it is emphasized in High Voltage Design Criteria (1978), that minimizing components’ physical size and weight require power systems operation at high voltage and high frequency. However, the risk of electric discharge, partial discharge (pd) and voltage breakdown also increases with higher system voltage level and frequency respectively. Such risk is realistic in power distribution within the spacecraft and also in situations where power cable insulation could be compromised due to hypervelocity impacts.
The European Space Agency (n.d.) has documented that hypervelocity from meteorites or space debris can have effects ranging from plastic deformation, cutting of cables, and clear hole perforations to ejection of materials. This type of impact is real with increasing probability of occurrence according to the location and duration of the spacecraft in space. Hypervelocity impact on power distribution cable could weaken the cable insulation, cause conductor to conductor exposure, or conductor to structure exposure as illustrated in Figure 1.
Figure 1. Insulation Breakdown Scenarios in Space Vehicle Power Distribution Cables
Such conditions can represent the separation of pair electrodes in a conductive medium. It is well known that when the voltage between two contacts separated by a distance in a gaseous medium of zero conductivity exceeds a critical value (breakdown voltage), the medium of electrical insulation will breakdown and current will flow across the gap. Paschen law gives the breakdown voltage necessary to start a discharge between two electrodes in gas medium as a function of pressure and gap length. In the traditional experiment to verify breakdown voltage, pressure in a controlled vacuum chamber is set while a DC voltage across two electrodes is varied (Chen, 2016). The study presented in this paper takes the reverse procedure, that is the AC voltage across electrode gap is set and pressure in the vacuum chamber is varied.
The motive for this experimental approach is to allow for observation of changes in the voltage across the electrode gap before, during and after voltage breakdown. Several theories have been postulated in the past regarding voltage breakdown categories, triggers and mechanisms in vacuum environments (Miller, 1991; Cross, Mazurek, & Srivatava, 1983). Some of these theories include Clump theory, Interaction Theories, Anodic theory, and Cathodic theories. The general conclusion is that, “No theory seems to explain all breakdowns, since by an appropriate choice of gap geometry, electrode material, and voltage waveform one can establish a situation where as desired, a clump, cathode, or anode process will be the primary cause of breakdown” (Miller, 1991). No attempt is made in this paper to align with any of the previously postulated theoretical frameworks, rather, experiments were designed and conducted for in-situ observation of how electrical breakdown phenomena in a near vacuum space environment is impacted by voltage and frequency magnitudes. The power system voltage and frequency focused upon in this study range from 400V to 800V RMS and 400 Hz to 1500 Hz respectively. At the Nyquist sampling rate, the result recorded in the experiments is a near continuous graphical chronology of changes and oscillations in the voltage across the electrode gap due to electron collision activities (Townsend avalanche) between the electrodes. The aim in this paper is to add to the body of knowledge of AC electrical discharge in ultra-low pressure environments.
The experimental setup is illustrated in Figure 2. The main components of the circuit include power supply, step-up voltage transformer; current shunt; rheostat; vacuum pump, bell jar, and the test jig. The power supply is the programmable Elgar Smart Wave Series, capable of creating complex waveforms. For this experiment, the 3 kW power supply was programmed to produce pure sine voltage at different frequencies from 400 to 1500 Hz. Using a step-up transformer, the source voltage was stepped up to magnitudes ranging from 400 to 800V across the electrode gap. The 0-6 kΩ rheostat was adjusted in concert with the applied voltage to limit the transformer current to design rating. The test jig - illustrated in Figure 3 comprises of two copper discs (electrodes) affixed to long adjustable screws that are threaded through Teflon fixtures.
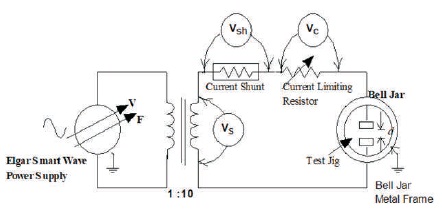
Figure 2. Experimental Setup
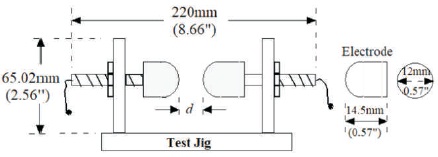
Figure 3. Test Jig
The discs are 14.5 mm (0.57’’) thick and 12 mm (0.47’’) diameter. The gap ends of the discs are rounded to a radius of 6.1 mm (0.24”). The left and right electrode support brackets are machined to identical dimensions to ensure that the electrodes are aligned and level when mounted. The shafts that held the discs were wrapped with layers of Teflon to minimize the effect of capacitance buildup between the jig part and the bell jar wall.
The bell jar vacuum pump is the Varian SD300 Dual Stage Rotary Vane pump. It is equipped with pressure gauges for digital and analog readouts. The bell jar has a 393.7 mm (15.5”) diameter opening. The test jig was mounted on a plane 152.4 mm (6”) from the bottom of the bell jar chamber. The bell jar glass dome has a ceiling height of 266.7 mm (10.5”). The test jig basic dimensions are 32.51 mm (1.28”) wide, 65.02 mm (2.56”) high and 219.96 mm (8.66”) long. Figure 4 illustrates the relative dimensions of the test jig and the bell jar while the test jig inside the bell jar is shown in Figure 5. The metal frame of the bell jar and the power supply neutral and frame are connected to the facility ground. The experiment was conducted in two phases.

Figure 4. Bell Jar Dimensions
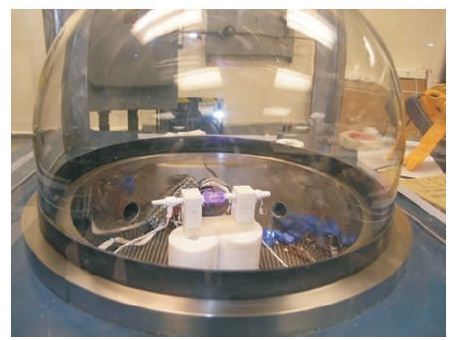
Figure 5. Test Jig in Bell jar
In the first phase fixed electrode gap, specific input voltage at specific frequency under gradually decreasing pressure conditions are considered.
In this phase, the electrode gap was fixed at 23.11mm (0.91’’). Table 1 summarizes the applied voltage and frequency combinations used in the experiments. The pressure cycle in the experiments was controlled and repeatable. It was varied from atmosphere 101.324 kPa (760 Torr) until voltage breakdown. The experiment continued through the breakdown phase until the voltage recovered. The objective was to provide graphical observation of changes in the gap voltage before, during and after voltage breakdown.
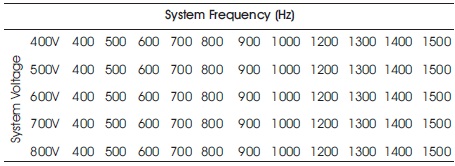
Table 1. Tests Conditions to Examine the Impact of Voltage and Frequency Levels on Voltage Breakdown (Phase I)
In this phase Fixed Voltage, fixed Frequency, Variable Gap are considered.
The objective of phase II was to explore how gap distance affects voltage breakdown. In particular, to examine if a distance exists, where voltage breakdown might not occur while system is operating in the pressure range where breakdown is known to normally occur. In this phase, the electrode gap was varied from 6.35 mm to 184.15 mm (0.25” to 7.25”). The upper limit allowed for physical space buffer to minimize capacitance effects between the bell jar wall and the test jig edges. The test input conditions are summarized in Table 2. Pressure, voltage and current data were collected for each experimental cycle.
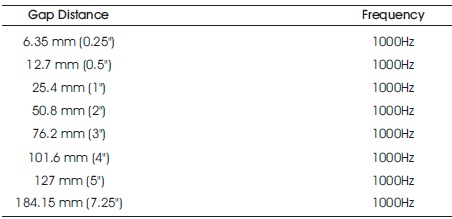
Table 2. Tests Conditions to Examine Impact of Distance on Voltage Breakdown at 500V Input (Phase II)
It has been shown that voltage breakdown in vacuum environment can be affected by a number of factors including (but not limited to) contaminants, temperature, and outgassing (Cross et al., 1983; Nevrovsky, 1998; Neuber, Butcher, Krompholz, Hatfield & Kristianse, 1999). These factors are potentially present in vacuum related experiments. To minimize the factors, standard procedures for this type of experiment were followed, i.e. use of materials with minimum outgassing characteristics; wrapping exposed conductive wire and components with appropriate electrical insulation tape. For experimental process - initially flushing the vacuum chamber to expel contaminants; flushing chamber with special bottled dry air to return chamber to atmospheric pressure and subsequently returning the vacuum chamber to ambient temperature and repeating the process at the end of each experimental cycle.
The experimental cycle was repeated at least three times successively for each applied voltage and frequency. The average of the successive readings was used for one experimental data point. The air used to flush the chamber is bottled High Purity Air (HPA). The air is certified to meet the MSFC-STD-3535 standard for propellants and pressurants used for test and test support activities at NASA. The air has the following characteristics: For 30 ft3 air volume: particle count (for particle size 30 to 100μ) = 2. For particle size >100μ, particle count = 0; Dew point/Moisture Content = 0.44 ppm.
Experimental data were collected using the DATAQ DI-730 data acquisition instrument. The 8-channel, USB recorder provides a measurement range of ±10 mV to ±1000 V with a corresponding data resolution of -3db @ 1.3 kHz and -3 db @ 5.0 kHz data resolution respectively. The recorder also provides channel-to-channel and input-to-output isolation. It has a maximum sampling rate of:

where
fs = sampling frequency in Hz/s
n = number of recording channels used simultaneously.
In this experiment, four recording channels were used and the sampling rate was programmed to the Nyquist rate of twice the frequency of the voltage applied to the electrode gap. The recorder has capability for different data acquisition methods including average, minimum, maximum, RMS and frequency. All voltages recorded in this experiment were by the RMS data acquisition method i.e.,
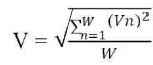
where: V = RMS value
vn = instantaneous voltage and
W = window size
The window size determines the size of the samples that the recorder uses to calculate RMS. The window size must be large enough (two complete cycles minimum) to have sufficient data to produce accurate results. Conversely, if the window size is too large, small voltage changes may get averaged out, making the RMS results less responsive. The equipment specification provides the general guideline to use a window size of several complete cycles. The window size adopted in this experiment is 10 cycles as illustrated in Figure 6.
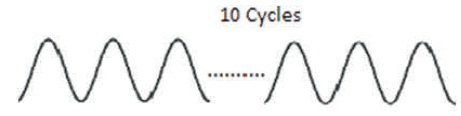
Figure 6. Window Size for RMS Calculation
This window size is considered adequate to capture the significant dynamic changes anticipated during electric discharge periods while at the same time, minimizing spurious transients that may not strongly affect the electric discharge profile.
The circuit used for measurements is illustrated in Figure 7 and the data recorded in the experiments were:
Vs – Input voltage to the electrode circuit
Vsh – Voltage across the 2 Ω current shunt resistor
Vcl – Voltage across the 0-3 kΩ current limiting resistor
P– Pressure inside the bellja.
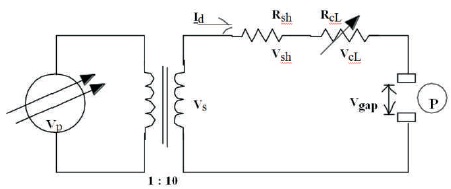
Figure 7. Circuit for Breakdown Voltage Measurement
Changes in pressure is brought about by the vacuum pump, normal operation of depressurizing the chamber from atmosphere to near vacuum level. Pressure data was recorded as analog voltages. The values were subsequently converted to Pascal or Torr using a conversion chart provided by the vacuum pump manufacturer. Similarly, the current (Ip) flowing in the circuit was measured as analog voltage across a dedicated shunt resistor and converted to Ampere using the ratio of voltage to resistance i.e.,r
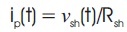
The shunt resistor used was rated 250W, 2Ω ±1%. The frequency data was manually recorded from the power supply frequency setting. Referring to Figure 7:
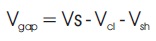
With Rcl >> Rsh,
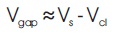
where:
Vgap = Voltage across the electrode gap
Vs, Vgap and Vcl are some of the data recorded in the experiment.
Figure 8 represents the analog graphical display of the raw data recorded by the data acquisition instrument (DATAQ DI-730). The data recorded by the instrument is stored in a computer or external storage device. At a sampling rate of over 20,000 samples/sec, by Nyquist criteria for 10 KHz, the data file for each experimental cycle is very large. The instrument software allows the stored data to be compressed to desired compression ratio and exported to excel as “CSV” file. This feature allows experimental data to be retrieved in full or compressed form. The feature was particularly useful as the size of the uncompressed experimental data sometimes exceeded the row capacity of Microsoft Excel. The data plot shown in Figure 8 is a compression of near real- time changes in input voltage, voltage across the electrodes, bell jar pressure, and current measured in the experiments. The unit of all data displayed in the figure is volt. Non-voltage data including pressure and current, have conversion chart or formula supplied by the manufacturer of the equipment/item used, to convert from voltage to the appropriate unit. Subsequent figures and tables in this paper were generated from excel files of data acquired for each experiment cycle similar to Figure 8.
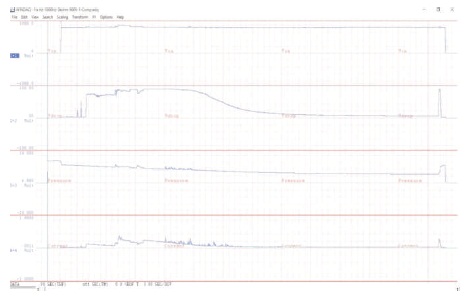
Figure 8. Sample Data Acquisition Graphical Display – Compressed Raw Data
Phase I of the experiment focused on the fixed electrode gap. Specific input voltages at given frequencies were applied to the gap while the pressure was reduced gradually from atmosphere to very low level. Going from higher to lower pressure, the electric discharge started as faint glow at pre-voltage breakdown level as illustrated in Figure 9 (a). It progressed to the partial discharge glow shown in Figure 9 (b). The glow size and intensity increased rapidly with further decrease in pressure. At full voltage breakdown, the glow ballooned to an intense glow ball as shown in Figure 10. As the pressure decreased further, the glow size and intensity reversed and trended toward quenching. With continuing decrease in pressure, the system voltage restored to normal value.
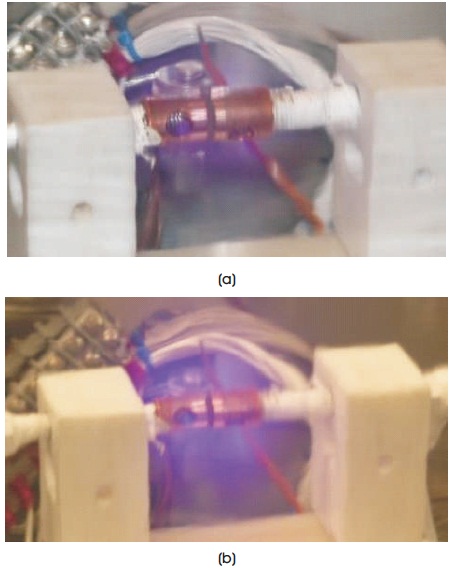
Figure 9. (a) Pre-Breakdown Glow, (b) Partial-Breakdown Glow
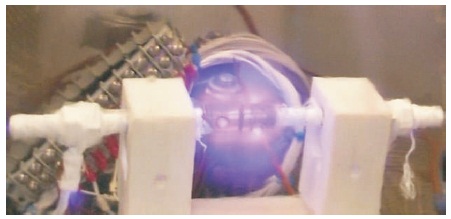
Figure 10. Full Breakdown Glow Discharge
At the completion of each experimental cycle, the typical information captured is as illustrated in Figure 11. The figure is the analog representation of the detail changes in the parameters captured in the experiments. The parameters include: system input voltage, pressure in the bell jar from atmosphere to breakdown level, voltage across, and current through the electrode gap. The figure is an analog visualization of the near real-time changes including oscillations, in the parameters before, during, and beyond breakdown.
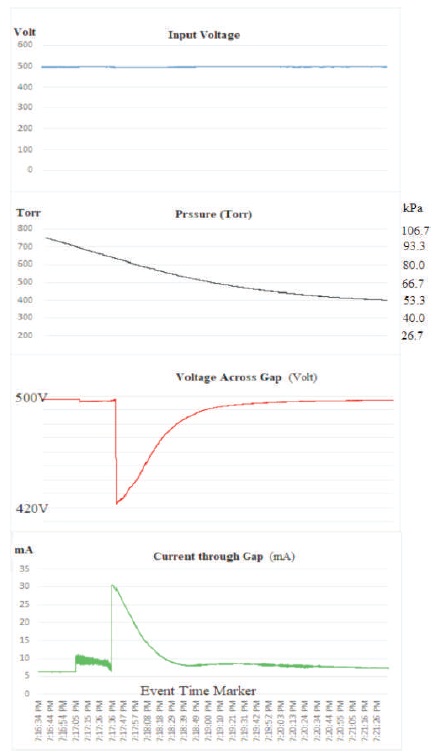
Figure 11. Typical Data Captured in Phase I
The Paschen Law defines the voltage necessary to start a discharge between two electrodes in a gas as a function of pressure and gap-length. It has nevertheless been observed that “an arc would sometimes take place in a long irregular path rather than at the minimal distance between the electrodes” (Wikepedia, Paschen's law, 2019; Wadhwa, 2007). The law is therefore noted to be roughly true over a limited range of the curve, Wikepedia (Paschen's law). Figures 12a – e shows the electrode gap voltage profiles for the conditions stated in the figures.
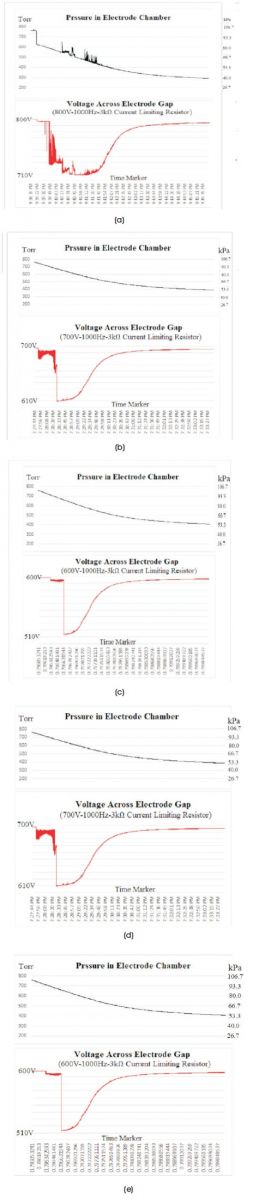
Figure 12. Voltage Across Gap (V ) (a) (800V-1000Hz-3kΩ), gap (b) 700V-1000Hz-3kΩ, (c) 600V-1000HzΩ, (d) 500V-1000Hz-400Ohm-3kΩ, (e), 400V-1000Hz-3kΩ
It is observed that the voltage profiles of Figure 12 compare favorably with the right side of the Paschen curve at higher applied voltages. Pre-breakdown currents are clearly identifiable in the breakdown profiles. It has been indicated that pre-breakdown currents may fall into two general categories: (a) Steady or quasi-steady currents emitted from areas of the electrode cathode by means of field emission or thermally assisted field emission and (b) microdischarges due to surface contaminants on the electrodes, (Miller, 1991). The result is that negatively charged electrons and positively charged ions oscillating between the electrodes.
The electrons/ions oscillation between the electrodes [Townsend avalanche] is mirrored by the voltage oscillation across the electrode gap as shown in Figures 12a-e. Observation is that the gap voltage oscillation under pre- breakdown as well as breakdown conditions is more vigorous and with higher oscillation amplitudes at higher applied voltage. Comparison of Figure 12a and 12e illustrates this observation. Additionally, the drop in voltage across the electrode gap increases as the input voltage increases. The relationship between the input voltage and voltage drop across the electrode gap is illustrated in Figure 13. Observation is that voltage drop across the electrodes will approach maximum limit as the applied voltage is increased.
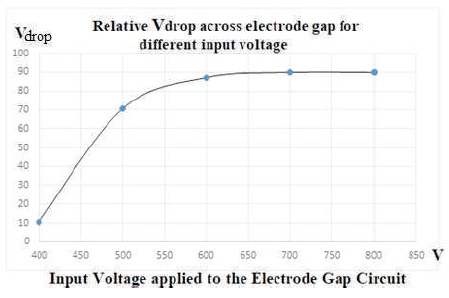
Figure 13. Maximum Voltage Drop Across the Electrodes vs System Input
In phase II of the study, the electrode gap distance was varied under the common condition of 500V input and 3kΩ current limiting resistor. The objective was to observe the profile of the current through the electrode gap when the distance between the electrodes is varied. As expected, the longer the distance between the electrodes, the lower the current magnitude. The magnitudes of currents at 139.7 mm (5.5”), 25.4 mm (1”) and 6.35 mm (0.25”) gap distances are illustrated in Figure 14a, b, and c respectively, while the relative current peaks vs distance is displayed in Figure 15.
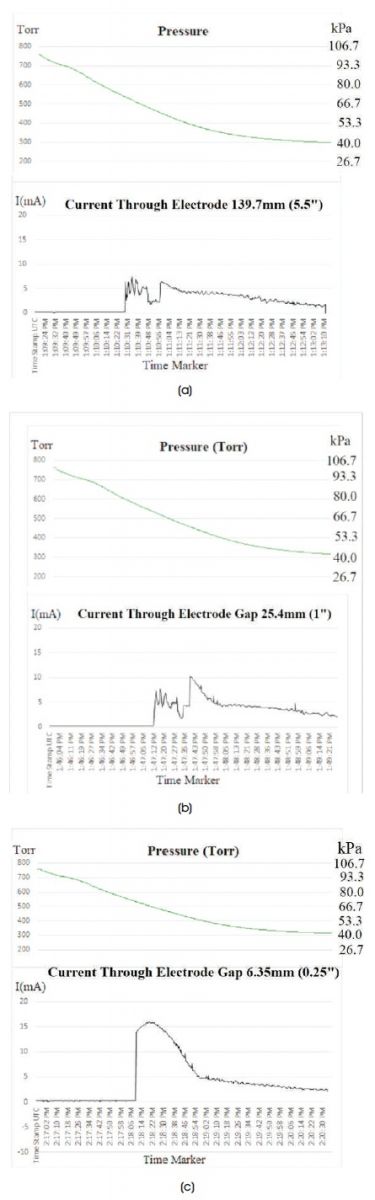
Figure. 14. Current Profile at Partial Discharge (1000Hz-500V-3KΩ-0.25”), (a) 139.7mm, (b) 25.4mm, (c) 6.35mm
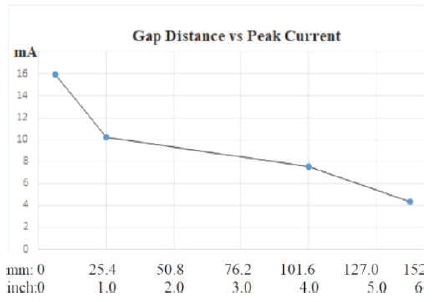
Figure 15. Relative Current Magnitudes vs Gap Distances at Breakdown for 1000Hz-500V-3KΩ
The impact of frequency on current magnitude or voltage profile across the electrode gap was also investigated. Past investigations, Plessow, and Pfeiffer, (1994); Biswas, and Mitra, (1979) have remarked that partial discharge voltage of inhomogeneous gaps decreased with increase in frequency. In a particular study, Plessow and Pfeiffer, (1994), the authors indicated that the breakdown voltage decreased significantly. It is noted that the referenced investigation was in relation to RF transmitters and the frequency range investigated was from 50 Hz to 100 K. This range was reasonably broad enough to demonstrate the impact of frequency on breakdown voltage.
The experiments reported in this study focused on distribution power systems (Sood & Lipo, 1988; Emadi & Ehsani, 2000; Sul, Alan, & Lipo, 1989) within the relatively narrow frequency range of 400 Hz to 1500 Hz. Initiation of breakdown voltage at 1500 Hz, 500 Hz, and 400 Hz are compared in Figure 16. This comparative frequency range was too narrow to observe the impact of frequency on breakdown voltage initiation as reported by earlier investigators.
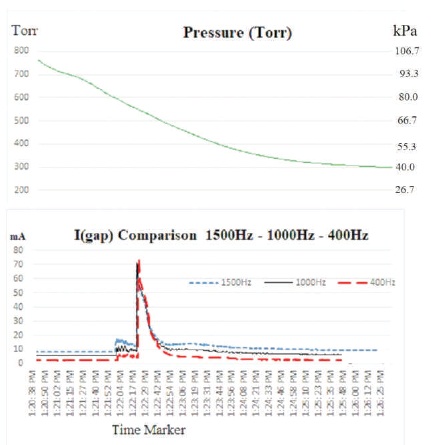
Figure 16. Relative Breakdown Profile at 1500Hz, 1000Hz and 400Hz
The earlier investigators however also indicated that the nature of high-frequency breakdown characteristic resembles the Paschen curve, (Plessow & Pfeiffer, 1994). In the experiments conducted in this study, the breakdown voltage across the electrodes also shows semblance to the Paschen curve particularly at the higher voltage breakdown levels.
The unpressurised space vehicles designed for interplanetary exploration will encounter varying atmospheric pressures in its journey. Partial discharge will occur in accordance with Paschen's law as it traverses different atmospheric pressure levels. In this study, voltage breakdown was observed to initiate in the pressure range of 83.99 – 77.33 kPa (630 – 580 Torr) and recovered from the breakdown from about 55.73 – 54.40 kPa (418 - 408 Torr) for the conditions of the experiments. Results also show that within this pressure range, voltage breakdown still occurred in electrode gap as wide as 187.96 mm (7.4”). After voltage breakdown, the system voltage restored to normal value at pressures outside the range at which the voltage breakdown occurred.
The prognostication in the approach used in this study is that gap voltage changes near breakdown can be monitored and characterized, thereby leading to some control techniques that might conceivably switch the power system configuration to below Paschen voltage level, until the spacecraft traverses the breakdown pressure range. Results in this study however show that the voltage profiles across the electrode gap were too diverse Chen (2016) and unpredictable under different input conditions to lend to uniform characterization and control mitigation.