(1)
This study proposes a novel framework to analyze the multi objective optimization aspects of distribution system in the presence of capacitors. This study associated with the economical and technical aspects of the system by means of net savings, voltage deviation, and section current index objectives. The system in the presence of capacitors exhibits efficient performance, for this, an optimal placement strategy is presented based on power loss indexes and total power losses using proposed modified cuckoo search algorithm. In order to explore the problem more realistically and to solve multi objective optimization problem in the presence of capacitors, a novel methodology based on non-dominated sorting and fuzzy decision approaches is proposed. The feasibility and effectiveness of the proposed method are examined on standard 15-node, 33-node, and 69-node test systems. According to the analytical results, the proposed framework in the presence of capacitors enhances the system performance more effectively [14].
The analysis of distribution system is an important area of activity as distribution systems provide the final link between the bulk power system and consumers [26]. With the usage of different types of electronic loads the customer loads (domestic) loads draw huge amount of reactive currents due to which there is a drop in voltage due to quadrature component of voltage, also the system line resistive losses increases, so, there is a need to compensate the reactive current by placing appropriate amount (kVAr) of capacitor at particular buses so that the reactive power is compensated.
The installation of capacitors in a distribution system reduces the peak power and energy losses by improving the voltage profile. In this aspect, it is necessary to identify the optimal placement of capacitors in a given system. The optimal capacitor placement is a complicated combinatorial optimization problem and hence many different optimization techniques and algorithms like analytical, meta heuristic and evolutionary algorithms have been proposed in [1, 3, 4, 6, 9, 17, 18, 20, 22, 26-31, 33, 34, 38, 39]. Careful review of this literature reveals that, most of the literature is confined to identify the optimal location of single capacitor based on the system Total Power Losses (TPL) as objective function. From this, there is a scope to analyze the effect of multiple capacitors on system performance. Some of the literature presented in[5, 16, 24, 40] have been concentrated in identifying an optimal location of capacitors based on certain conventional sensitivity factors, fuzzy decision approaches, etc. Here, there is a scope to propose one universal methodology to identify an optimal location(s) identification strategy for capacitors. To extend this, very few literature [8, 19] concentrated in solving the optimization problem with multiple objectives using non-dominated sorting genetic algorithm, weighted sum methods, etc. But, recent advances in optimization processes reveal that, hybrid algorithms yields better results than the intelligence based optimization algorithms.
The presented methodology is examined on standard 15- node, 33-node and 69-node radial distribution systems with supporting numerical and as well as graphical results. The remaining paper is organized as problem formulation along with objectives formulation, constraints, optimal location identification strategy, and procedure of modified cuckoo search algorithm, multi objective optimization strategy and at last, the paper is summarized with supporting results and conclusions.
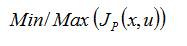
Generally, the optimization problem can be expressed as,
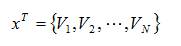
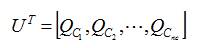
where, 'p' is the number of objectives, 'x' and 'u' are the state and control vectors, respectively. In brief, these can be expressed as,
uT = {QC1,QC2,.......,QCnc} in the case of capacitors
Here, 'N' is the total number of nodes, 'nc' is the total number of capacitors.
To solve the optimization problem, the following three objectives, namely savings, voltage deviation, and Section Current Index (SCI) are formulated and are optimized while satisfying system equality and in-equality constraints.
In this paper, economic aspects of the distribution system are enhanced by maximizing the savings objective in the presence of capacitors. In the same way, the technical aspects of the system are enhanced by minimizing the voltage deviation and SCI objectives [14].
This objective[12] is used to maximize the net savings in a given system in the presence of capacitor(s). The mathematical expression used to calculate the net savings with capacitor(s) is
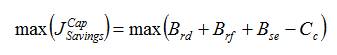
where, Brd , Brf , Bse are the benefits due to reduced demand (kW), released feeder capacity (kVA), and saving in energy losses (kWh), respectively. 'C ' is the cost of C installation of capacitor(s) in '$'.
The individual terms can be expressed in detailed as follows,
(a) Benefit due to reduced demand is,
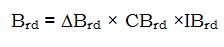
Here, 'Brd ' is the reduced demand (kW), 'CBrd ' is the cost of generation (taken as $ 154/kW) and 'IBrd' is the depreciation cost for generation (taken as 0.2)
(b) Benefit due to released feeder capacity is,
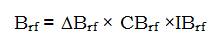
Here, 'Brf ' is the released feeder capacity (KVA), 'CBrf' is the cost of the feeder (taken as $ 2.64/KVA) and 'IBrf' is depreciation cost of the feeder (taken as 0.2).
(c) Benefit due to savings in energy is,
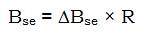
Here, 'Bse' is the savings in energy = (annual energy losses before installing the capacitor - annual energy losses after installing capacitor) (KWh) and 'R' is the cost of energy (taken as $ 0.1/kWh).
(d) Installation cost of capacitor
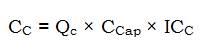
Here, 'Qc' is the total kVAr size of the capacitor(s), 'CCap' and 'ICc' are the cost ($ 200/kVAr) and depreciation cost (taken as 0.2) of the capacitor(s).
It is necessary to maintain the voltage magnitude at the nodes within permissible limits to increase the security of the system. For this, it is necessary to minimize the voltage deviation at system nodes. The system voltage deviation can be calculated as,
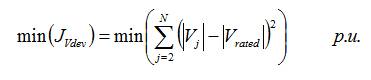
where, 'Vj' and 'Vrated' are the voltage magnitude at jth node after installing capacitor(s) and rated voltage considered to be 1.0 p.u [12].
Providing the active and reactive power near the loads may increase or decrease the current flow in some sections of the network, thus releasing more capacity or also place out of distribution line limits. The Section Current Index (SCI) gives important information about the level of currents through the network. The section current index can be calculated when performing the power flow analysis before and after installation of capacitor(s).
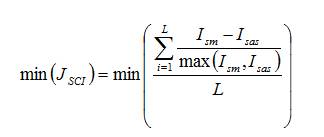
Where, 'Ism' and 'Isas ' are the mean and line section current after placing capacitor(s), respectively, 'L' total number of line sections [12].
The following equality and in-equality constraints are considered for this problem.
The constraints that must be satisfied in the load flow solution with capacitor(s) is,
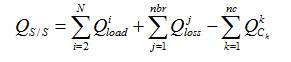
here, 'i' is the node number, 'j' is the branch number, and 'k' is the capacitor(s) installed node number.
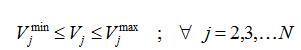
Node voltage magnitude limits,
Capacitor(s) size limit(s),
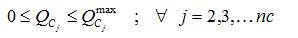
where, Vminj and Vmaxj are the minimum and maximum voltage magnitudes (p.u) at jth node and Qmaxcj is the maximum size(s) of capacitor(s), which is 80% of the total reactive power load of base case system.
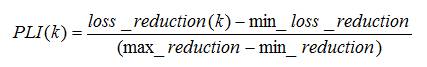
The best location to install capacitor(s) is identified using Power Loss Index (PLI) analysis. The PLI value at system nodes is calculated as,
The algorithmic steps of locating the capacitors in a given radial distribution is given below;
Step 1: Read the system line and load data, i.e the line resistance and reactance and the active and reactive power loads at each node.
Step 2: Calculate the total active power loss by running the load flow for base case system.
Step 3: At each node the reactive load is compensated by injecting the reactive power (Qc) which is equal to load reactive power, then run the load flows for calculating the total active power losses in each case, one at a time.
Step 4: Calculate the reduction in total active power losses in each case.
Step 5: Calculate the PLI using equation (19).
Step 6: Arrange the calculated PLI values in descending order and select the nodes from top to install capacitor(s).
Step 7: Stop.
To identify the optimal number of capacitor(s) for a given system, at first, one capacitor is installed in highest PLI valued node and optimization problem (procedure described in section-4) is solved with Total Power Losses (TPL) as objective and while satisfying system equality and in-equality constraints. This procedure is repeated with two capacitors in top two locations and so on. Finally, identify the optimal number of capacitors based on the TPL value.
In general, the existing swarm based optimization algorithms work based on certain evolutionary operations to search the global best solution in the solution space. But, these algorithms suffer from poor convergence rate when compared to the modern hybrid algorithms [34]. Cuckoo Search Algorithm (CSA) is a novel technique developed for solving continuous and non-linear optimization problems. This algorithm works based lifestyle of cuckoo bird, characteristics in egg lying as well as breeding.
In this paper, a novel Modified Cuckoo Search Algorithm (MCSA) is developed to enhance the convergences rate and quality of the solution too [14]. This algorithm generates array of initial population for the problem control variables uniformly rather than randomly using the following MATLAB pseudo code.
Initial population=random ('unif', min, max, N, npar)
where, 'min' and 'max' are the minimum and maximum limits of the control variables, respectively, 'N' is the total population number and 'npar' is the total number of control variables. Because of this, the consistence of local solutions before starting iterative process occupies entire solution region. Due to this, the best populations are considered to start the iterative process.
Using this, the problem control variables, such as reactive power injected by the capacitor(s) are generated randomly for a given population number (N).
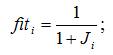
Load flow problem is solved using the methodology presented in [21]. Then, the objective function and fitness values for the respective population are evaluated. The fitness function for a population can be calculated using
The final objective values and fitness vectors can be tabulated as,
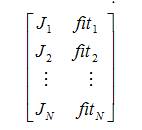
where, J1 , J2 , ...., JN and fit1 , fit2 , ..., fitN are the objective and fitness values of the respective population. This step can be considered as first stage of the proposed methodology. In second stage of the proposed methodology, pair-wise best solution is forwarded for further process and the remaining solution is discarded under survival of the fittest [2], [14]. The complete process is represented as,
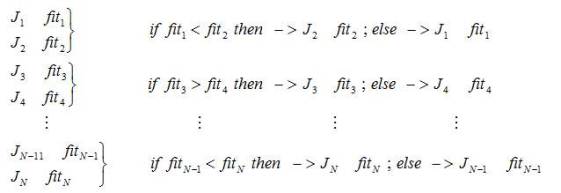
Because of this, the total number of populations processed in iterative process gets reduced to 50% and very clearly, the iterative process starts with best population and consequently, the time taken to get final best solution is less. The remaining steps of proposed method are discussed as follows.
Levy flight is the search process of population of solution from the randomly generated initial population [8], [13]. After performing the levy flight operation, cuckoo chooses the host nest position randomly to lay egg is given in equation (18) using equation (20) for ith cuckoo, the initial population is updated using,
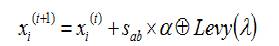
where, 'α ' random number between [-1,1], '⊕ ' is entry wise multiplication, Sab >0, it is the step size, based on this only new solution is generated. Here, step size can be calculated as,
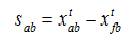
where, a, f=1, 2, ....., n; b=1, 2, ....., m
Finally, the levy flight operator can be calculated as,
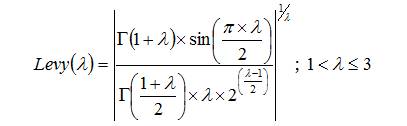
Performing Levy flight operation on initial population will generate new population and which results the solution around the best solution. Population vector is modified using levy flight equation xt+1ab , i.e, belongs to ath nest and bth control variable. Here old value xab is updated with respect to fth neighbourhood's nest.
Recently an efficient operator, i.e. crossover has been designed for searching process [7], [13]. This is one of the popular hybrid operations performed on populations to increase the extended capability to increase the concentration towards best solution by taking the local best solution as reference. The population after levy flight operation are again operated using crossover operation. This can be mathematically expressed as in equation (21).
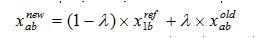
where, 'λ ' is the random number between [0,1]. Updated value 'xab' is obtained by crossover of old value and its reference value. After crossover, check the control variable limits for all the final population. If upper limit is violated, set to the maximum value, if lower limit is violated, set to the minimum value and if it is within the limit keep as such.
After performing this operation, using new population, the load flow is performed and the objective function and fitness values are calculated. The local best solutions are updated and the global best solution is selected using selection process.
In the conventional optimization problem, one of the system objectives (e.g., savings, Vdev , SCI, etc.) is optimized under certain system constraints. In multilobjective optimization problem, these conflicting objectives are optimized simultaneously to obtain a set of solutions, instead of one particular solution, for the given problem constraints.
To clarify this problem, consider the case in which the savings objective is maximized with increased voltage deviation, and vice-versa. For this type of problem, there are many solutions rather than a single, optimal solution, and none of these solutions are categorically 'better' than any other solution. In this paper, the final population after evaluating the considered objectives are performed with non-dominated sorting, crowding sorting procedures and finally the compromised solution is selected using the fuzzy decision making tool. The following are the detailed explanation regarding each procedure.
The multi-objective problem finds a set of non dominated solutions, known as the Pareto-Front Set (PFS), which describe the priority of a solution with respect to the others. Let us consider two solutions of the system, Sol1 and Sol2 . If Sol1 dominates Sol2 , then Sol1 is a non dominated solution when the following conditions are satisfied [23], [35].
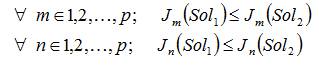
where, 'p' is the total number of objectives. Therefore, the PFS are obtained by mapping these non dominated solutions into the entire search space. The resulting Pareto-optimal fronts constitute the Pareto-optimal set [14].
These solutions are stored in a repository that is used to estimate the density of solutions around a particular solution. The distance (crowding distance) between each pair of solutions is calculated, and then the solutions are arranged based on their crowding distances, explained as follows.
Using the density of obtained solutions around a solution in PFS, calculate the average distance between each of the two points related to the objective functions. This calculation resembles, perimeter of the cuboids formed by the nearest neighbours as the vertices [23]. This distance, can be called as crowding distance. This operation requires, sorting of the solutions based on the objective function values in ascending order. For each of the populations, the largest and smallest objective function values are assigned as boundary values and the remaining populations are assigned a distance value equal to the absolute normalized difference in the function values of two adjacent populations.
After this, crowding distance comparison is performed between each of the two populations, based on two attributes, out of which one is non-domination rank and the other one is crowding distance. The final best PFS is selected with the populations which has lowest nondomination rank.
After determining the total PFS for a given optimization subproblem using Non-dominated Sorting Modified Cuckoo Search Algorithm (NSMCSA), the optimal settings are selected by the decision maker. For this purpose, a fuzzy decisionmaking tool applies the following linear membership function to minimize the objective functions [37].
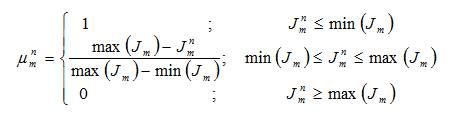
where, Jmn and μmn are the mth objective function in the nth Pareto optimal solution and its membership function, respectively. The preferred degree of the Pareto optimal solutions can be defined as equation (24).
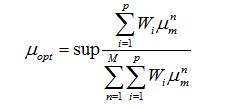
where, 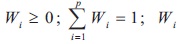 is the weight value of the ith objective function. Therefore, the optimal Pareto solution and the corresponding settings are obtained by the proposed algorithm based on the adopted weight factors [14].
In this section, the two-stage initialization process for the multi objective optimization problem and its implementation procedures are explained. The first stage of the NSMCSA performs the load flow and evaluating the objective functions and fitness values. In the second stage, the Pareto Front Sets (PFS) are obtained from these solutions, and the best 50% of the Pareto fronts are retained for further consideration. Thus, the iterative process starts with the better PFSs and, as the iteration number increases, the global best PFS is obtained. The process of two-stage initialization for the multi-objective optimization problem is shown in Figure 1. This methodology was implemented on a personal computer with Intel Core2Duo processor and 2 GB RAM installed with MATLAB environment.
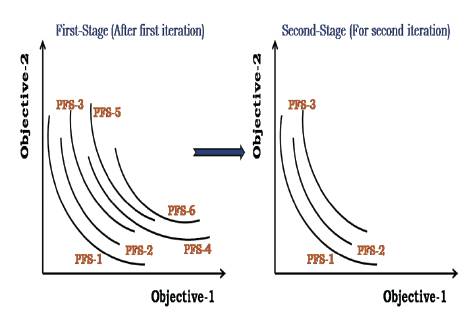
Figure 1. Process of Two-stage Initialization in the Multi-objective Optimization
The complete implementation procedure of the proposed NSMCSA flowchart is shown in Figure 2.
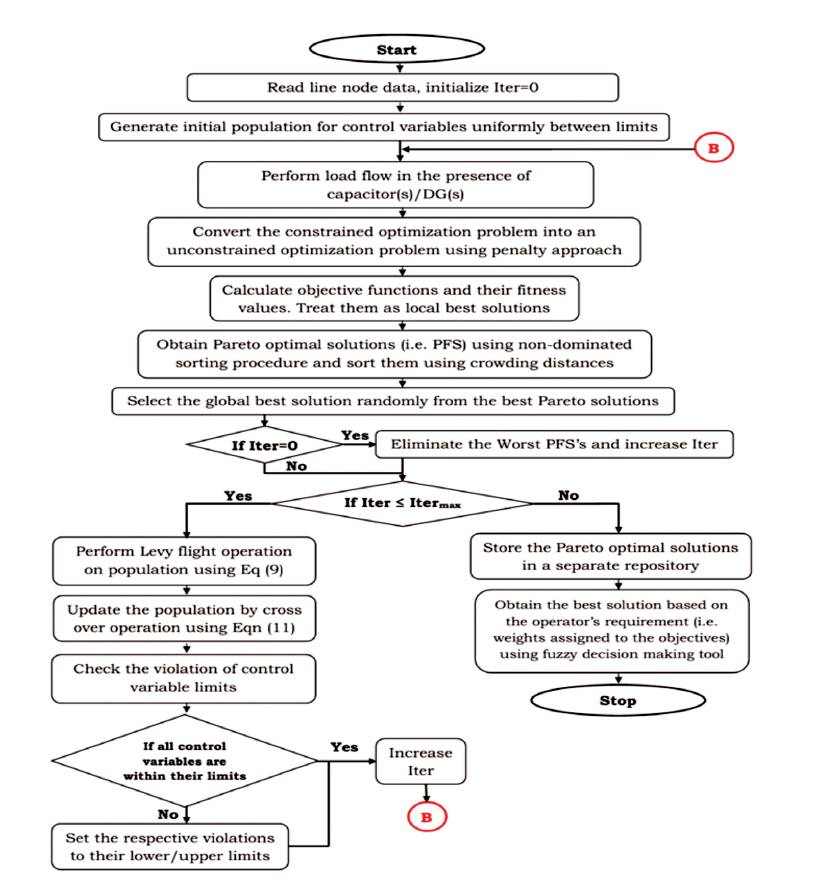
Figure 2. Implementation Flowchart of NSMCSA
To show the effectiveness of the proposed methodology, a standard Fonseca and Fleming functions [36], 15-node [11], 33-node [15] and 69-node [32] radial distribution systems are considered. At first, single objective optimization problem is solved using developed MCSA methodology and later multi objective optimization problems are solved using developed NSMCSA methodology.
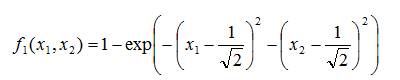
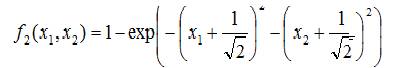
The standard Fonseca and Fleming functions are given in the following equations.
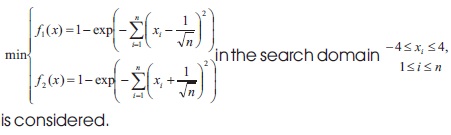
For this example, 'i' and 'n' are considered to be 2. Then, these equations becomes,
The multi objective result for these test functions with NSMCSA is shown in Figure 3
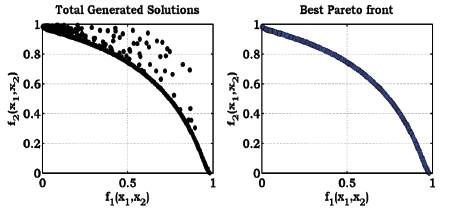
Figure 3. Multi-objective Result for the Fonseca and Fleming Test Functions
From these results, it is identified that, because of the effectiveness of the proposed methodology, the Pareto solutions confines the entire trade-off region. Similarly, the multi objective optimal placement of capacitors problem for radial distribution systems can be solved effectively using the proposed methodology.
For each of the test systems, at first, the optimal location(s) to install capacitor(s) are identified using Power Loss Index (PLI) analysis. For this, PLI values are evaluated at each of the node using the procedure given in section 3 and are arranged in descending order. Then, one capacitor is installed in highest PLI valued location and the optimal capacitor settings and total power losses are evaluated using the optimization procedure given in section 4. This process is repeated for two, three capacitor locations, and the total power losses are evaluated. Finally, the number of locations which yields lowest power losses are considered as the optimum number of capacitor locations. Next, by installing capacitors in these optimum locations, the savings, voltage deviation and section current index objectives are optimized in the presence of capacitor individually using MCSA (section 4) and simultaneously using NSMCSA (sections 5 & 6) are performed. The respective results are analyzed using graphical and as well as numerical results [13].
The 15-node radial distribution system, with 14 branches is considered. For this system, the total demand is 1752 KVA. To identify the effect of capacitor on system performance, the descending ordered PLI values at the system nodes are tabulated in Table 1. From this table, it is identified that, the top three highest PLI valued nodes are 15, 11, and 4. Among these nodes, to identify the optimum number of locations, the total power losses are optimized in the presence of capacitor
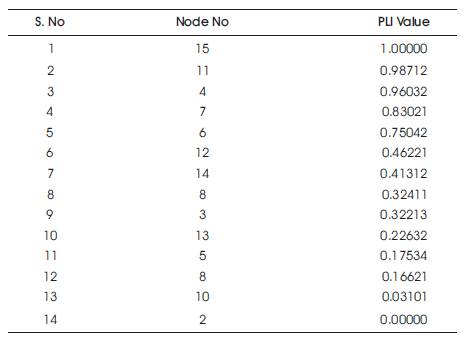
Table 1. Power Loss Index Values at Nodes of 15-node RDS
The optimized TPL values at optimal location(s) are tabulated in Table 2. From this table, it is observed that, minimum TPL value is obtained, if the capacitors are placed at nodes 15 and 11, when compared to other locations. From this, further analysis is performed by placing the capacitors in these locations.
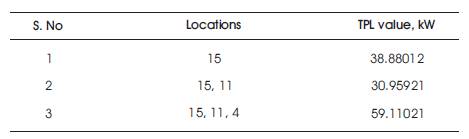
Table 2.Optimum Capacitor Locations of 15-node RDS
The detailed summary of the test results for capacitor placement are tabulated in Table 3 for TPL minimization. From this table, it is observed that, 28.1337 kW losses are reduced with capacitors when compared to without capacitors. It is also observed that, minimum voltage magnitude is obtained at node-8 because of lack of reactive support at this node [12].
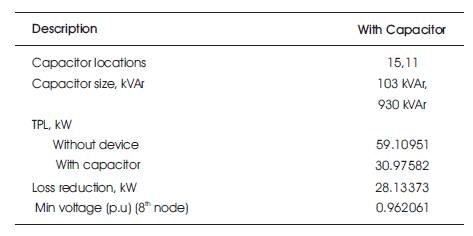
Table 3. Summary of Test Results for Capacitor Placement of 15-node RDS
To show the effect of capacitors, the variation of voltage values and power losses are shown in Figures 4 and 5, respectively. From these figures, it is identified that, the proposed method with capacitors yields better results when compared to the without capacitors. The voltage magnitude at system nodes is enhanced with capacitors and power flow in the branches is redistributed. Due to this, the power losses are reduced in the branches with capacitors when compared to without capacitors.
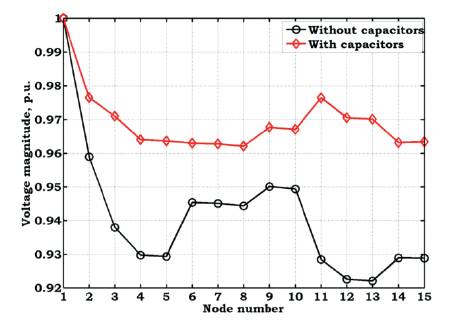
Figure 4. Variation of Voltage Values with capacitors of 15-node RDS
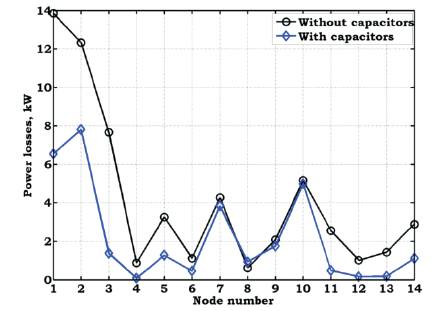
Figure 5. Variation of Power Losses with Capacitors of 15-node RDS
The single objective optimized results with savings, voltage deviation (V ) and section Current Index (SCI) as dev objectives for with and without capacitors using the developed MCSA is tabulated in Table 4. From this table, it is identified that, with capacitor maximum benefit in terms of savings, Vdev and SCI values is obtained when compared to without capacitor [12].
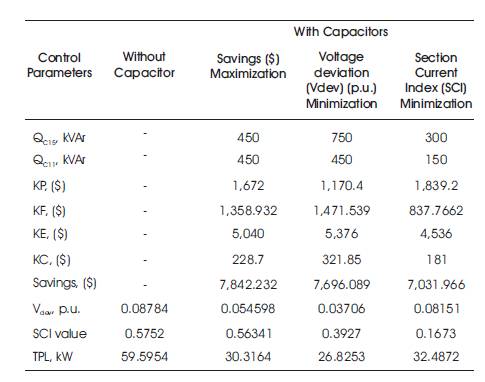
Table 4. Single Objective Optimized Results with Capacitors of 15-node RDS
To exemplify this more clearly, maximization of savings, increases the savings due to annual energy loss and thereby the reserve capacity for demand growth which in turn increases the SCI value. It is also observed that, because of moderate capacitor compensation, moderate variation is observed in cost of capacitors voltage deviation, total power losses, benefit due to released feeder capacity and benefit due to reduced demand.
Similarly, minimization of voltage deviation increases to capacitor’s compensation. Hence, size of capacitors is increased more when compared to other objectives. This in turn increases the cost of capacitors installation. It is also observed that, due to minimization of voltage deviation, the total power losses are reduced which increases the benefit due to released feeder capacity and benefit due to reduced demand. In this case, moderate variation is observed for Section Current Index and benefit due to losses because of the increased compensation [12].
At last, minimization of SCI value, the compensation required is decreased which in turn decreases the cost of capacitors and increases the total power losses and voltage deviations. Because of this, the system/feeder performance in terms of savings is decreased. It is also observed that, benefit due to released feeder capacity and reduced demand is decreased, as the capacitors compensation is very less [13].
To validate the proposed method, savings obtained with capacitors is compared with the existing method [10], [13]. and are tabulated in Table 5. From this table, it is identified that, the proposed method yields better savings than the existing method with less capacitor size. From this, by considering the economic factors, such as savings in released feeder capacity as well as the savings in annual energy losses in the objective function, and technical factors, such as the voltage deviation and section current index, the overall savings are increased.
From this entire single objective analysis, it is identified that, minimization/maximization of value of one of the objectives maximizes/minimizes the value of the other objectives. Hence, it is necessary to solve multi objective optimization problem to get compromised solution among the objectives.
The multi objective optimized Pareto front solutions when two and three objectives are solved using the developed NSMCSA are shown in Figures 6 to 9. From these figures, it is observed that, the generated Pareto solutions confine the entire trade-off region due to the effectiveness of the developed algorithm. It is also observed that, the developed fuzzy decision making tool selects the compromised solution from the best Pareto front solutions based on the weights assigned to the objectives.
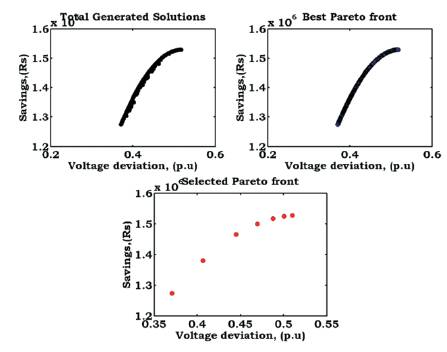
Figure 6. Pareto Front Solutions (Vdev-Savings) with Capacitors of 15-node RDS
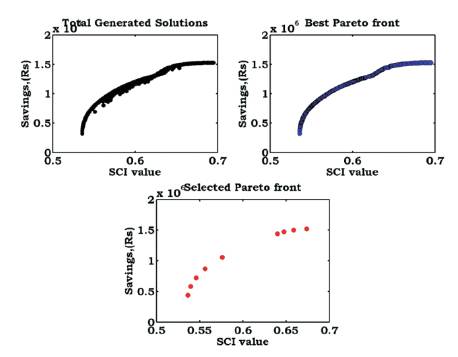
Figure 7. Pareto Front Solutions (SCI-Savings) with Capacitors of 15-node RDS
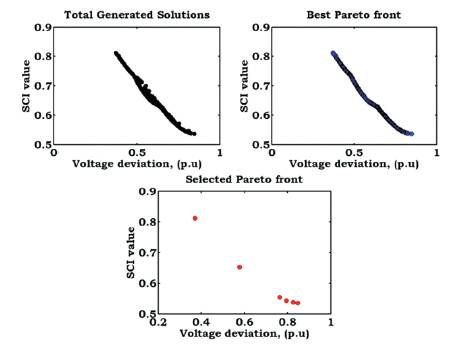
Figure 8. Pareto Front Solutions (Vdev -SCI) with Capacitors of 15-node RDS
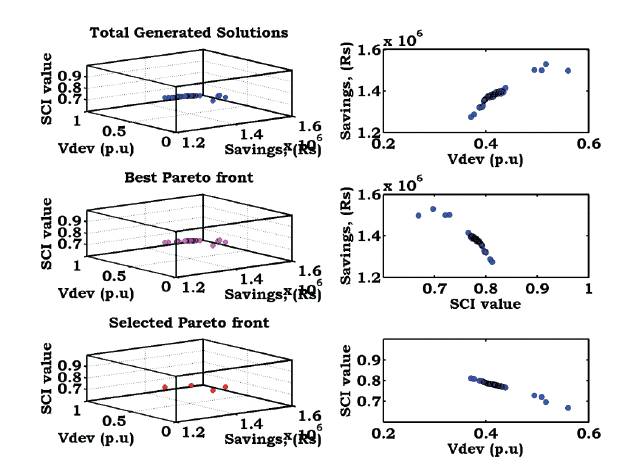
Figure 9. Pareto Front Solutions (Savings-V -SCI) with Capacitors of 15-node RDS
Using the fuzzy decision making tool given in section 5.3, the numerical results for the two and three objectives are tabulated in Table 6. From this table, it is identified that, based on the weights assigned to the objectives, respective compromised solutions are selected from the best Pareto front solutions [14].
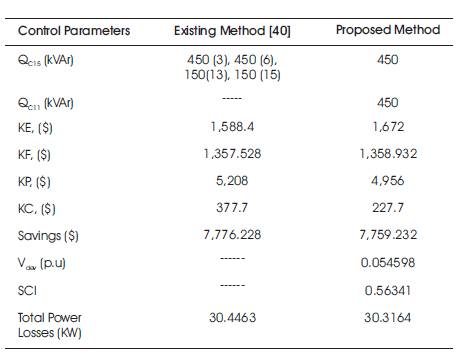
Table 5. Validation for Savings Objective for 15-node RDS [13]
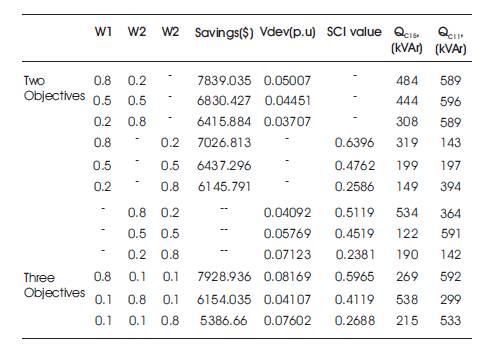
Table 6. Multiobjective Optimized Results with Capacitors of 15-node RDS
The 33-node radial distribution system, with 32 branches is considered. For this system, the total demand is 4369 KVA. To identify the effect of capacitor on system performance, the top three highest PLI valued nodes are 30, 32, and 6. Among these nodes, to identify the optimum number of locations, the total power losses are optimized in the presence of capacitor. From this analysis, it is observed that, minimum TPL value is obtained, if the capacitors are placed at nodes 30 and 32 when compared to the other locations[12]. From this, the further analysis is performed by placing the capacitors in these locations.
The detailed summary of the test results for capacitor placement are tabulated in Table 7 for TPL minimization. From this table, it is observed that, 57.3686 kW losses are reduced with capacitors when compared to without capacitors. It is also observed that, minimum voltage magnitude is obtained at node-18 because of lack of reactive support at this node [12].
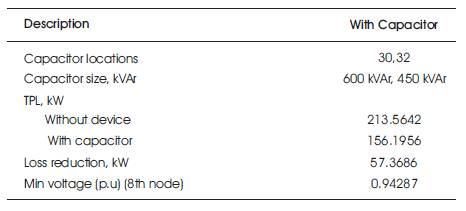
Table 7. Summary of Test Results for Capacitor Placement of 33-node RDS
The single objective optimized results with savings, voltage deviation (Vdev) and Section Current Index (SCI) as objectives for with and without capacitors using the developed MCSA is tabulated in Table 8. From this table, it is identified that, with capacitor maximum benefit in terms of savings, Vdev and SCI values is obtained when compared to without capacitor. For this system also, the same inferences can be observed as in the previous system [12].
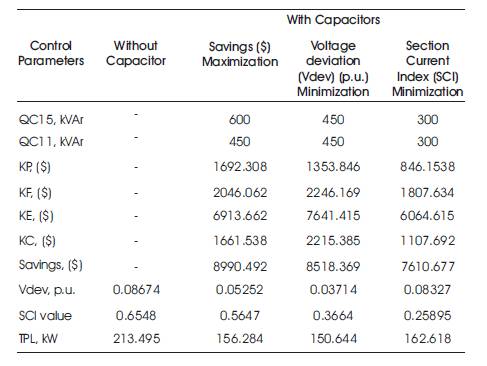
Table 8. Single Objective Optimized Results with Capacitors of 33-node RDS
Further, the savings obtained with capacitors using the proposed method is compared with the existing method 22and are tabulated in Table 9. From this table, it is identified that, the proposed method yields better savings than the existing method.
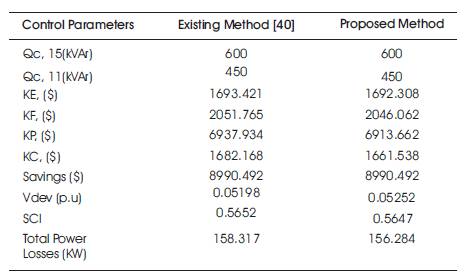
Table 9. Validation for Savings Objective for 33-node RDS
Similarly, the multi objective optimized Pareto front solutions when two and three objectives are solved using the developed NSMCSA and using the fuzzy decision making tool given in section 5.3, and the numerical results for the two and three objectives are tabulated in Table 10. From this table, it is identified that, based on the weights assigned to the objectives, respective compromised solutions are selected from the best Pareto front solutions [14].
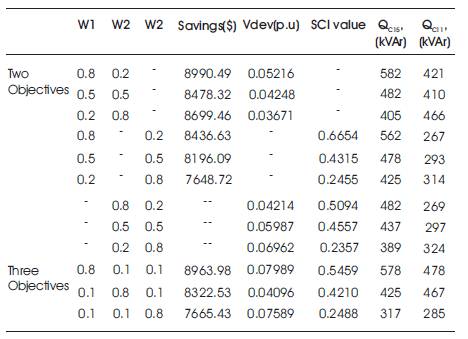
Table 10. Multi Objective Optimized Results with Capacitors of 33-node RDS
7.4 Example-3 (69-node)
The 69-node radial distribution system, with 68 branches is considered. For this system, the total demand is 4647 KVA.
To identify the effect of capacitor on system performance, the top three highest PLI valued nodes are 61, 64, and 59. Among these nodes, to identify the optimum number of locations, the total power losses are optimized in the presence of capacitor. From this analysis, it is observed that, minimum TPL value is obtained, if the capacitors are placed at nodes 61 and 64 when compared to the other locations. From this, further analysis is performed by placing the capacitors in these locations [13].
The single and multi objective optimized results with savings, voltage deviation (Vdev) and Section Current Index (SCI) as objectives for with and without capacitors using the developed MCSA and NSMCSA are tabulated in Table 11. From this table, it is identified that, with capacitor maximum benefit in terms of savings, Vdev and SCI values is obtained when compared to without capacitor [14]. For this system also, the same inferences can be observed as in the previous system. It is also identified that, based on the weights assigned to the objectives, respective compromised solutions are selected from the best Pareto front solutions.
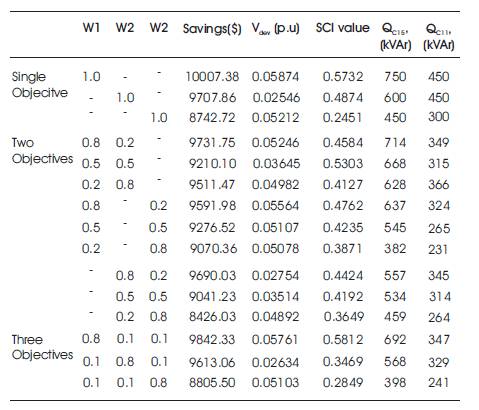
Table 11. Multi-objective Optimized Results with Capacitors of 69-node RDS
In this paper, a novel optimization solution methodology based on Modified Cuckoo Search Algorithm has been proposed with system savings, voltage deviation and SCI as objectives. The optimal location(s) identification methodology for capacitor(s) in a given system based on TPL and PLI values has been presented. With this, the economic and as well as technical aspects of the given distribution system has been analyzed in the presence of capacitor(s). From the analytical results, it has been concluded that, the locations obtained using the proposed methodology yields better results when compared to the existing literature methods. Finally, the more realistic multi objective optimization problem has been solved using the proposed methodology based on non-dominated sorting and fuzzy decision approaches while satisfying system equality and in-equality constraints. The presented methodology has been tested on 15-node, 33-node, and 69-node radial distribution systems with supporting validations of numerical and graphical results.