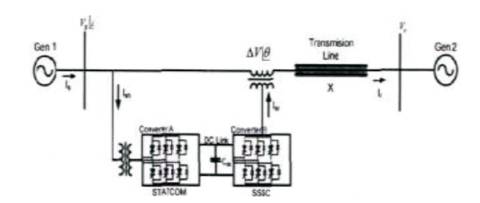
Figure 1. Unified Power Flow Controller (UPFC)
This paper is based on the practical contingency condition of a transmission line, over which a study using HPFC is done without sacrificing the available generation capacity. The Hybrid Power Flow Controller (HPFC) is the most versatile and complex power electronic equipment that has emerged for the control and optimization of power flow in electrical power transmission system. Installing the HPFC makes it possible to control an amount of real and reactive power flow through the line. This paper presents the control of power flow through multiple overloaded/under loaded lines under study. Simulation is carried out using MATLAB software to overcome the contingency condition by using HPFC.
Today's power system is highly complex and requires careful design of new devices taking into consideration the already existing equipments. Now a days, number of private generating units are getting commissioned due to power generation policy and open access to transfer power. But, due to variety of environmental and regulatory concern, the expansion of electric power transmission facilities is restricted. So as to meet additional power transfer, capability beyond the present limit will be needed to meet the requirement and to provide adequate margin. Power transfer capability is constrained by facility overloads and reactive power deficiencies. For optimum utilization of available transmission facilities, FACTS (UPFC&HPFC) can be used to mitigate the problems ( N.G. Hingorani et al., 1999) ( Y.H. Son et al., 1999 ).
The transmission line can be controlled in a predetermined manner. Flexible AC Transmission System (FACTS) uses advanced power electronics to control the parameters in the power system in order to fully utilize the existing transmission facilities. Modern power systems are becoming increasingly stressed because of growing demand and variety of factors. In recent years, energy, environment, right-of-way, and cost problems have delayed the construction of new transmission lines, while the demand for electric power has continued to grow. This situation has necessitated a review of the traditional power system concepts and practices to achieve greater operating flexibility and better utilization of existing power systems. Representative of the FACTS devices are SVC (Static Var Compensators), TCSC (Thyristor Controlled Series Capacitor), STATCOM, the Unified Power Flow Controller (UPFC), phase shifters, etc. These devices may be connected in shunt/series or a combination of shunt and series. Variety of advantages like improvement in steady state power flow, transient stability, voltage stability etc. can be derived and control of all basic power systems parameters viz., line voltage, impedance and phase angles.
UPFC consists of two series and shunt converters with AC transmission systems. It is a combination of STATCOM and SSSC. These parts are coupled together with common DC link (capacitor) to allow the real power flow between the series and shunt converter output terminals bidirectionally and to provide real and reactive line compensation without an external energy source. UPFC is able to control the series voltage injection by the means of unconstrained angle. The transmission line with UPFC, which is extended in AC transmission network is shown in Figure 1.
Figure 1. Unified Power Flow Controller (UPFC)
Novel and cost effective converter based FACTS topologies are proposed in ( L. Gyugyi et al., 1994) which is build upon the existing equipment and provide improved control action. These devices make use of converters in addition to the (presumably existing) passive components and can be regarded as hybrid in nature. Such FACTS controllers are called Hybrid Power Flow Controller (HPFC). The key benefit of this new topology is that it fully utilizes the existing equipment such as switched capacitors or SVC etc. and thus the required rating of the additional converter is substantially lower as compared to the rating of the comparable UPFC.
The Hybrid Power Flow Controller (HPFC) uses two equally rated voltage sourced converters in order to upgrade the functionality of the Existing Switched Capacitors or Static VAR Compensators (SVC). Recently, a novel HPFC topology for FACTS were proposed. It consists of a shunt connected controllable source of reactive power, along with two series connected voltage sourced converters – one on each side of the shunt device. The converters can exchange active power through a common DC circuit. A block diagram representation of such an envisioned typical HPFC application is shown in Figure 2.
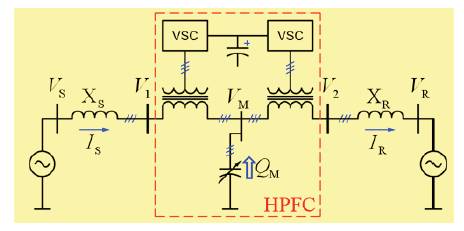
Figure 2. HPFC (Hybrid Power Flow Controller)
This HPFC configuration is assumed to be installed on a transmission line that connects two electrical areas i.e. on a Single Machine Infinite Bus (SMIB) System. Central of the HPFC topology is the shunt connected source of reactive power denoted as BM and representing the controllable shunt connected variable capacitance. This is equivalent to a typical SVC or any other functional equivalents of SVC such as STATCOM, a synchronous condenser or even a mechanically switched capacitor bank. The two voltages were sourced converters VSCX and VSCY are connected to the transmission line by means of coupling transformers ( R. MihaliEet.al, 1996). The converters provides controllable voltages at terminals of high voltage side of the transformers. The converters share a common DC circuit coupling each others' DC terminals. The DC circuit permits the exchange of active power between the converters.
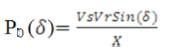
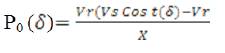
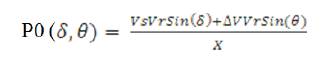
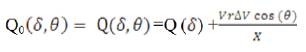
The transmitted real (P0 ) and reactive power (Q0 ) of the transmissions above without UPFC (from sending to receiving end bus) are given by the expression. The series of inverter is controlled to inject a symmetrical three phase voltage of controllable magnitude and phase angle in series with the line to control active and reactive power flows on the transmission line. So, this inverter will exchange active and reactive power with the line.
The reactive power is electronically provided by the series inverter and the active power is transmitted to the DC terminals. The shunt inverter is operated in such a way as to demand this DC terminal power (positive or negative) from the line keeping the voltage across the storage capacitor Vdc constant. So, the net real power absorbed from the line by the UPFC is equal only to the losses of the inverters and their transformers. The remaining capacity of the shunt inverter can be used to exchange the reactive power with the line so as to provide a voltage regulation at the connection point. The transmitted real (P0) and reactive power (Q0) of the transmissions above without UPFC (from sending to receiving end bus) are given by the expression.
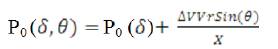
The real and reactive power flow of the transmission line at the receiving end with HPFC is given by following equations (1) and (2). Real power of the system with HPFC:
From equations (1) and (3)
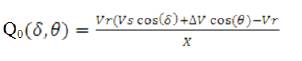
Reactive power of the system with HPFC
From equation (2) and (6)
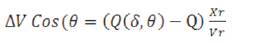
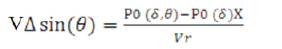
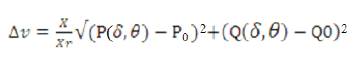
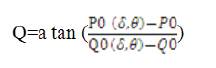
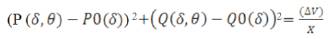
To provide the required real and reactive power, the magnitude and phase angle of the series-injected voltage from equation (5) and (8) are given by following equations
Phase angle of injected voltage,
The equations (9) and (10) gives the information about Δv The phaser diagram based on the mathematical derivation of the above, gives the magnitude and phase angle of injected voltage to meet the demand of real and reactive power of the system, obtained as shown in Figure 2.
The transmittable real and reactive power will be specified by the maximum limit of injected ΔV .The wide range of controlling the transmitted power is independent from the transmission angle (δ ) which indicates not only the superior capability of HPFC in power flow applications, but also promises powerful capacity for transient stability improvement and power oscillation damping. The controllable of real power (P) and the reactive power (Q) at the receiving end between any transmission angles (δ) can be seen in the following mathematical equations. The powerful capabilities of UPFC are discussed above in the terms of conventional transmission control concepts. It can be integrated into a generalized power flow controller that is able to maintain prescribed controllable real power and reactive power Q in the line.
Considering the equations (9) and (10), the real and reactive power changes from the uncompensated values PO (δ) and QO (δ) as a function of the magnitude and the phase angle of the injected voltage ΔV. As the angle δ is an unrestricted variable 0o < θ < 380o , the attainable boundary of the control region for P (δ,q) and Q (δ,) is obtained from a complete rotation of the pharos with its maximum Δ Vmax
The equations are mentioned above to verify this control region is a circle with a center defined by the coordinates defined by P0 (δ) and Q0 (δ), and the radius is given by following equation
The circular control regions are defined by the equation (11). These regions are shown in Figure 3 and 4. The center of these circles are Po (δ) and Qo(δ) at angles δ= 0° , δ = 30°, δ = 60° and δ = 90° respectively. The focus of the centers are indicated by the + sign as δ varies between 0° and 90°. When the transmission line angle (δ) and amplitude are zero, the real power Po (δ) and reactive power Qo (δ) flows are zero. According to this situation, the system is at standstill at the origin of the P and Q coordinates. It is illustrated as a case in Figure 3. The circle around the origin of the plane is the locus of the corresponding Q and P values (at receiving end). It is obtained as the voltage phasor : ΔV which is rotated around itself by a full revolution (0o< δ <380o) with its maximum value Δvmax .The boundary of the circle in the (P, Q) plane shows all P and Q values obtainable with UPFC in accordance with given rating. The UPFC with the specific voltage rating of 0.5 pu is able to obtain 0.5 pu power flowing into either direction without imposing any additional reactive power demanded on either the sending or the receiving end bus, as shown in Figures 3, 4 and 5.
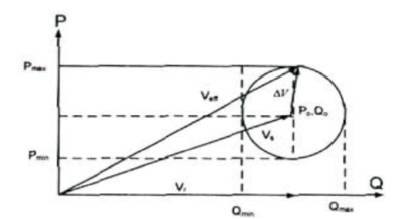
Figure 3. Magnitude and phase angle of injected voltage
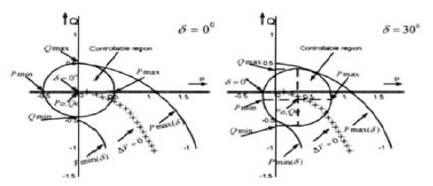
Figure 4. Po (δ) and Q (δ) at angles δ= 0°, δ = 30°
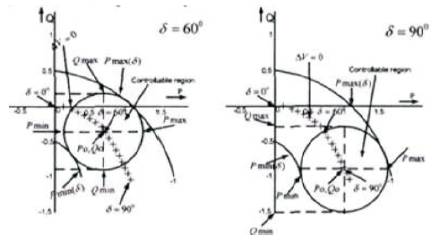
Figure 5. P0 (δ) and Q (δ) at angles δ= 60°, δ = 90°
The skills of UPFC demonstrated in Figures 3 and 4 show the capability of controlling the real and reactive power flow independently at any transmission angle providing a powerful tool for AC transmission control.
A Unified Power Flow Controller (UPFC) is used to control the power flow in a 500 kV transmission system. The UPFC located at the left end of the 75-km line L2, between the 500 kV buses B1 and B2, is used to control the active and reactive powers flowing through bus B2 while controlling voltage at bus B1. It consists of two 100-MVA, three-level, 48-pulse GTO-based converters, one connected in shunt at bus B1 and the other one connected in series between buses B1 and B2. The shunt and series converters can exchange the power through the DC bus. The series converter can inject a maximum of 10% of nominal lineto- ground voltage (28.87 kV) in series with line L2.
Open the UPFC GUI block menu. The GUI allows you to choose the operation mode (UPFC, STATCOM or SSSC) as well as the Pref/Qref reference powers or Vref voltage settings. Also, in order to observe the dynamic response of the control system, the GUI allows you to specify a step change of any reference value at a specific time. Make sure that the operation mode is set to “UPFC (Power Flow Control)”. The reference active and reactive powers are specified in the last two lines of the GUI menu. Initially, Pref = +8.7 pu/100MVA (+870 MW) and Qref =-0.6 pu/100MVA (- 60 Mvar). At t=0.25 sec Pref is changed to +10 pu (+1000MW). Then, at t=0.5 sec, Qref is changed to +0.7 pu (+70 Mvar). The reference voltage of the shunt converter (specified in the 2nd line of the GUI) will be kept constant at Vref =1 pu during the whole simulation (Step Time=0.3*100> Simulation stop time (0.8 sec). When the UPFC is in power control mode, the changes in STATCOM reference reactive power and in SSSC injected voltage st rd (specified respectively in 1st and 3rd line of the GUI) as are not used. Run the simulation for 0.8 sec. Open the “Show Scopes” subsystem. Observe on traces 1 and 2 of the UPFC scope the variations of P and Q. After a transient period lasting approximately 0.15 second, the steady state is reached (P=+8.7 pu; Q=-0.6 pu). Then P and Q are ramped to the new settings (P=+10 pu Q=+0.7 pu). Observe on traces 3 and 4 the resulting changes in P Q on the three transmission lines. The performance of the shunt and series converters can be observed respectively on the STATCOM and SSSC scopes. If it is zoom on the first trace of the STATCOM scope, the authors can observe the 48-step voltage waveform Vs generated on the secondary side of the shunt converter transformers (yellow trace) super imposed with the primary voltage Vp (magenta) and the primary current Ip (cyan).
In order to improve the power flow, the transmission line is compensated by an UPFC. The HPFC is connected to line facing contingency condition i.e. line- L2 and adjacent to power angle station, as shown in Figure 6. HPFC Phasor Model has been used for this simulation. The existing system is naturally unbalanced without HPFC, for all Gen- Sets at HPFC, simulation results are shown in Figure 7. At this location the HPFC is used to reduce the power flow in the line L2 to desired limit so as to push the power in under loaded line L1. The simulation result of the system configuration, in MATLAB Simulink is as shown in Figure 7. At 5seconds of the HPFC brought into circuit, with required power flow reference, the line L2 is controlled to carry 235MW power through it and remaining 212MW power carried over by L1.
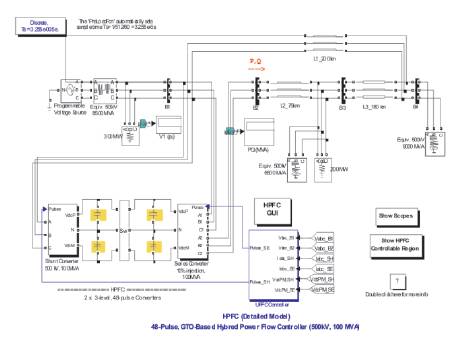
Figure 6. MATLAB/SIMULINK Model of the HPFC Configuration
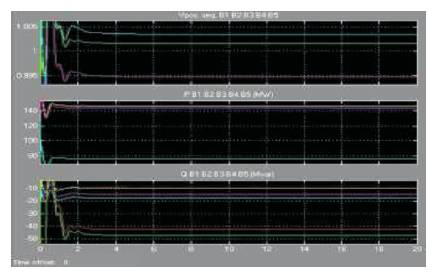
Figure 7. Active and reactive powers of line
Make sure that the operation mode is set to be “HPFC (Power Flow Control)”. The reference active and reactive powers are specified in the last two lines of the GUI menu. Initially, Pref = +8.7 pu/100MVA (+870 MW) and Qref =-0.6 pu/100MVA (-60 Mvar). At t=0.25 sec Pref is changed to +10 pu (+1000MW). Then, at t=0.5 sec, Qref is changed to +0.7 pu (+70 Mvar). The reference voltage of the shunt nd converter (specified in the 2nd line of the GUI) will be kept constant at Vref =1 pu during the whole simulation (Step Time=0.3*100> Simulation stop time (0.8 sec). When the UPFC is in power control mode, the changes in STATCOM reference reactive power and in SSSC injected voltage (specified respectively in 1st and 3rd line of the GUI) are not used. Run the simulation for 0.8 sec. Open the “Show Scopes” subsystem. Observe on traces 1 and 2 of the UPFC scope the variations of P and Q. After a transient period lasting approximately 0.15 sec, the steady state is reached (P=+8.7 pu; Q=-0.6 pu). Then P and Q are ramped to the new settings (P=+10 pu Q=+0.7 pu). Observe on traces 3 and 4 the resulting changes in P Q on the three transmission lines. The performance of the shunt and series converters can be observed respectively on the STATCOM and SSSC scopes. If it is zoom on the first trace of the STATCOM scope, it can be observed the 48- step voltage waveform Vs generated on the secondary side of the shunt converter transformers (yellow trace) superimposed with the primary voltage Vp (magenta) and the primary current Ip (cyan). The DC bus voltage (trace 2) varies in the 19kV-21kV range.
Comparison with the realistic load flow data from the field is done, where 02 generating sets evacuate the power through the system and the modeled system in MATLAB. With these 2 gensets practical power flow through line L1 and L2 were 76MW and 146MW respectively which is equal to simulated result as shown in Figure 6. With 03 gensets the simulation result of power flow is 133MW and 202MW through L1 and L2 respectively. Similarly, the load flow using Gauss-Seidel and N-R methods were calculated for the system parameters give in Table-I and its results for the real power flow through the system under study is compared with simulation results.
In order to improve the power flow, the transmission line is compensated by an UPFC. The HPFC is connected to line facing contingency condition i.e. line- L2 and adjacent to CTPS-WPCL station, as shown in Figure 7. HPFC Phasor Model has been used for this simulation. The existing system is naturally unbalanced without UPFC, for all Gen- Sets at WPCL as per simulation results shown in Figure 8. At this location the HPFC is used to reduce the power flow in the line L2 to desired limit so as to push the power in underloaded line L1. The simulation result of the system configuration, in MATLAB Simulink is as shown in Figure 6. At 5sec the HPFC is brought into circuit, with required power flow reference, the line L2 is controlled to carry 235MW power through it and remaining 212MW power carried over by L1.
With reference to Figures 8 and 9, the following observations can be made.
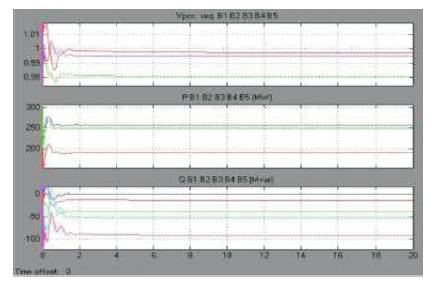
Figure 8. Active and reactive powers of line
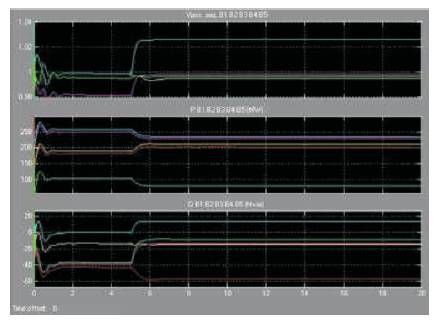
Figure 9. a, b, c Active and reactive powers of line
Comparison of Figure 8 (c) for all the cases shows that UPC like HPFC can well control the active and reactive power flows of line L3. Furthermore, in case of HPFC applications, the Damping of oscillations is better than the cases of IPC and UPFC. HPFC is not able to effectively control active and reactive power flows of line L6 and, thus, there is a significant control error. This is because HPFC cannot represent ideal phase shifting. A comparison of Figure b and Figure c exactly confirms the latter point.
The transmission line under study with parameters are as given in Table I is considered. HPFC is placed in series with line L2 as shown in Figure 7. Bypass option blocks the HPFC for the first 5 second. Voltage, active power, reactive power and current variations in the transmission line with HPFC and without UFPFC are studied and compared. When the transmission line is without HPFC, the sendingend and receiving-end p.u. voltages, real power and reactive power are shown in first 5 seconds of Figure 8. When HPFC is placed across the same transmission line, after 5 seconds,( Amit Shiwalkar et al.2012) the voltages at buses were improved, desired power flow through the line L2 by which the power through line L1 gone up. The MW loss of line L2 without UPFC was 8.1MW, whereas with HPFC it reduced to 6.5 MW (instead of 6.75MW which is the loss for reduced power flow) ( A. Edris et al., 1998) ( Farhangfar, A et al., 2004 ). As well known, with the increase of power flow the reactive power also increases. With UPFC this reactive power is maintained to desired level so as to maintain voltage profile and losses due to reactive current through line.
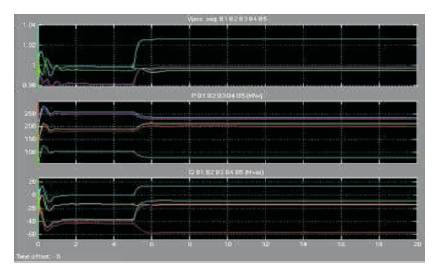
Figure 10. Series insertion voltage of 0.085 p u -70 Degree needs to be injected, as shown in Figure 9
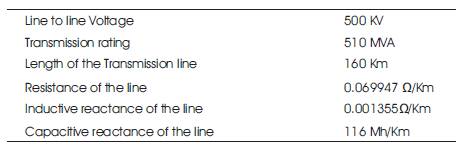
Table 1. Transmission line parameters
The real power flow through line L2 is regulated to 235MW from 257MW due to that the power flow in line L1 goes up from 190MW to 212MW, and the reactive power to 14.04MVAr. For this power flow adjustment it is found that series insertion voltage of 0.085 p u -70 degree is needs to be injected, as shown in Figure 9.
In this paper, phasor model of HPFC connected to a three phase-three wire transmission system has been simulated using the MATLAB environment. This paper also presents control and performance of HPFC intended for installation on a transmission line. Simulation results show the effectiveness of HPFC in controlling real and reactive power through the line.
Also, UPFC in transmission line, results in improvement of transient stability of the system, which is an added advantage along with the power flow control [ R. Mihali et.al 1995 ], improved Plant Utilization Factor, and better Voltage Profile.