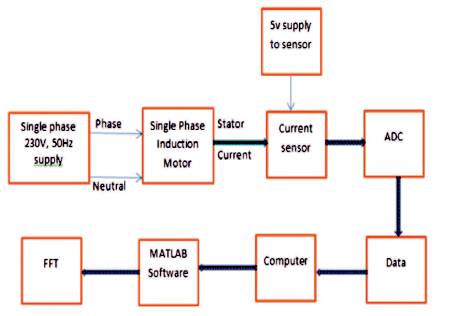
Figure 1. Experimental Layout
This paper demonstrates the experimental setup to acquire the stator current of single phase induction motor; and applies FFT technique to detect the fault in motor. The faults created in motor are bearing and rotor fault. Using current sensor, the signal under healthy state and faulty state is acquired from the motor, then using MATLAB signal processing toolbox the spectrum of the corresponding signal is obtained. The spectrum of the signal under fault is compared with the spectrum of the healthy signal and it is expected that the fault will be detected. The spectrum of the motor under healthy state is called the signature of the machine. This is unique for each machine. The central idea is that the signature of any machine under healthy and fault condition will be different. And, this forms the basis of condition monitoring and fault detection.
Induction motors are the driving force of the industries and considered to be the heart of all the industrial process. The operators of Induction motor drives are under continuous pressure to reduce maintenance costs and prevent unscheduled downtimes that result in low production and financial income. Now, many operators are using on-line condition-based maintenance strategies in parallel with conventional planned schemes. However, it is still the operator who has to make the final decision whether to remove it from the service or let it run based on information from the condition monitoring systems. Though various techniques [1] have been reported in the literature, Motor Current Signature Analysis (MCSA) [4], [9] is the widely applied scheme in the condition monitoring of motors. A crucial point about it is that it senses the motor current that is resultant of unique rotating flux components due to faults, such as bearing fault, broken rotor bars, cracks in rotor, air gap eccentricity, shorted turns in the windings, etc. MCSA can detect these problems at early stage and thus avoid secondary damage and complete failure of motor and halt the entire operations. The greatest challenge in the area of condition monitoring is the diagnosis of fault before it becomes critical. An early detection of this may save huge financial loss and operation shut down. In general, condition based scheme have been widely used to detect the specific failure in three of the main parts of Induction motor; the bearing, the rotor and the stator. Traditionally, condition monitoring of induction machines have been divided into two areas viz., mechanical problems and electrical problems. Mechanical problems, include bearing wear, rotor cracks, rotor unbalance, and eccentricity. Electrical problems, include broken rotor bars and winding insulation breakdown. Almost, 40%-50% [9], [12] of all failures are bearing related, around 5%-10% [12] are rotor fault, and unbalanced faults are within 12% of other faults. Bearing faults are the most frequent and are studied more. Some of the most common causes of bearing faults, include contamination of lubricants; loss of lubricant, overloading, excessive heating, etc. The ultimate result is either extreme vibration leading to catastrophic failure, or a complete seizure of the bearing. Stator faults are basically the breakdown of the winding insulation. This may be caused by excess thermal or voltage stress, mechanical vibration or even an abrasion between the stator and rotor. The weakness of the winding insulation can further result in the inter-turn short circuit and eventually winding ground short circuit. Rotor fault can be divided into two types. One is associated with rotor itself, such as bar defect or bar breakage in induction motors. This type of fault occurs from thermal stresses, hot spot, or fatigue stresses during transient operations such as start up, especially in large induction motors. Broken bars change the torque significantly and also affect the motor current, which can cause unsatisfactory operation and shutdown. Since broken bars really occur in large machines with welded copper cages, early detection is very desirable. The other type of rotor fault is related to air gap eccentricity.
The objective of this paper is to put forth an experimental technique to implement the MCSA [4], [10], [12] with single phase induction motor showing the methodology and fault diagnosis using current sensor. The set up may be utilized in condition based maintenance and fault diagnosis of induction motor for various faults. In this paper the authors have taken up bearing fault and rotor fault. The time domain signal from both the faults have been transformed into frequency domain in MATLAB signal processing toolbox. The authors have used MATLAB 2015a version software. Signal from machine is acquired using current sensor and Analog to Digital converter. ADC also fetches the data corresponding to the signal. This data is used to perform the FFT analysis [5].
In this section, the basic layout of the experimental setup which highlights the methodology underlining the work is presented. Various researchers [6], [11] and authors have done their analysis on how to acquire the signal from motor. Every system is associated with some parameters. These parameters indicate the conditions of the system. Examples of some parameters are temperature, pressure, vibrations, density, current, voltage, etc. Here in this setup they are going to capture current signal from the motor. This is because the authors are going to do motor current signature analysis so they need to acquire current signal from the stator of the motor. Depending on the complexities of the monitoring system and machine itself, there may be variations in equipment or components. However, the basic idea [11] is same i.e. to access the motor current and analyze the same in computer. The Figure 1 shows the layout of the experimental setup.
Figure 1. Experimental Layout
As evident from the block diagram shown in Figure 1 that the stator current is the monitoring parameter. The current is sensed by the current sensor. The output of the current sensor is given to ADC which samples the continuous time domain signal at a sampling rate of 4000 samples per second. Then it converts it into digital form. The current sensor has inbuilt conditioning and amplifying circuit. So there is no need for any external conditioning and amplifying circuit. However, the current sensor requires a 5 V supply to function. This has to be provided externally. This can be provided from any microcontroller pin. Here, Arduino is used to supply 5 volts to the sensor. Now, the digital signal from the ADC is fed to the computer. Prior to begin the experiment ADC software is installed in the computer. The software has a display where the voltage signal can be seen is proportional to the current sensed. It also has a data logger which helps to record the data of the signal. This data is imported in the [2] MATLAB signal processing toolbox where the time domain signal is generated again and its frequency domain form is obtained. From the frequency domain the frequency contents can be seen which present in the actual signal. This is done under healthy condition and repeated under faulty conditions.
To carry out the condition based monitoring, the authors have used single phase Induction motor [8]. Some of the features of the motor are high reliability and durability, high performance, consistence supply, and easy to operate and long lasting. The single phase induction motor is shown in Figure 2 and its technical details has been summarized in Table 1.
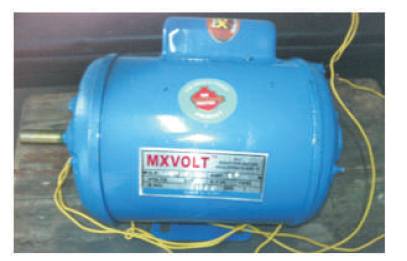
Figure 2. Single Phase Induction Motor
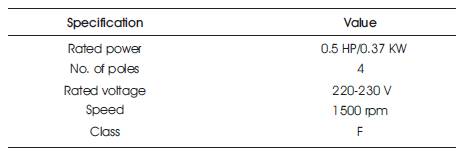
Table 1. Motor Rating
It is basically connected to the stator supply to sense the stator current and generate an output voltage which is proportional to the current sensed. The current sensor used here is ACS712-05B as shown in Figure 3.
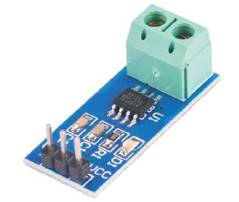
Figure 3. Current Sensor
It is used to convert the continuous time signal into discrete form. The ADC used here is ADX-24 as shown in Figure 4. It not only does the conversion, but it also facilitates the recording of data. They have set the sampling rate at 4000 samples per second.
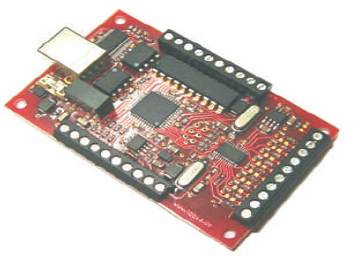
Figure 4. ADX-24 Board (ADC)
Table 2 summarizes the pin name and its functionality.
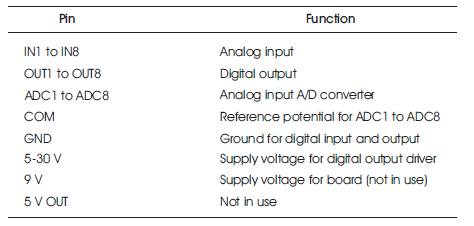
Table 2. Pin Details of ADX-24
This section will show the actual physical experimental setup [2] and acquisition system. Figure 5 shows the overall setup with induction motor, current sensor, Arduino Uno, Analog to Digital converter, and a Personal Computer. Here the motor is driving a fan load. The integration of all these in a proper manner facilitate the acquisition of the motor signal.
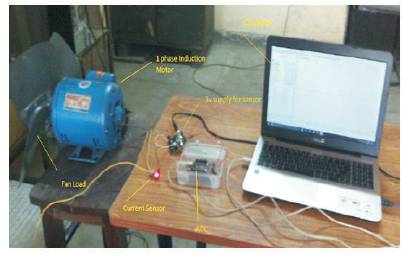
Figure 5. Experimental Setup for Current Monitoring System (MCSA)
Figure 5 is first run with motor being in normal healthy condition. By healthy condition it means that the motor is defect free. Since the concern is about bearing and rotor we have to make sure that it does not have any defects apart from other parts of the motor. The normal bearing and rotor is shown in Figures 6 and 7, respectively.
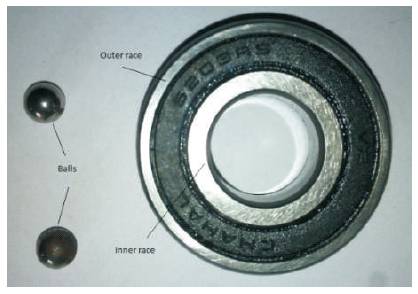
Figure 6. Bearing of Motor
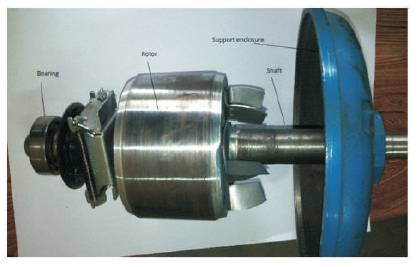
Figure 7. Rotor of the Motor
The time domain signal between voltage (proportional to current sensed) in y-axis and time in x-axis, from the motor under normal healthy state is shown in Figure 8 and its corresponding frequency spectrum Figure 9.
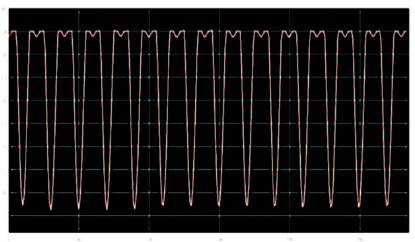
Figure 8. Healthy State Time Domain Signal
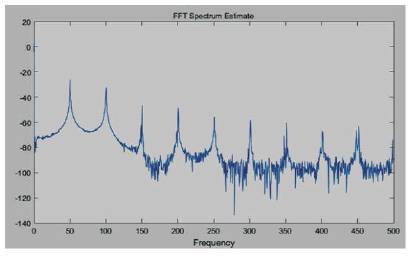
Figure 9. Frequency Spectrum of the Healthy State Signal (Signature)
By looking at the signal in Figure 8 in time domain it can only be assumed that it contains fundamental components and its harmonics. But once the spectrum [8] of the motor is observed, it can be clearly seen that it contains fundamental components of 50 Hz and higher order harmonics as shown in Figure 9. Figure 9 is the signature of the machine. This will form the basis of further analysis. Next fault in the bearing will be created and in the rotor the signal in time domain is obtained and then its frequency spectrum. The comparison of the signals will reveal the fault signature in terms of frequency content corresponding to the bearing and rotor faults.
In this section bearing fault will be created [3] and the time domain voltage signal is obtained followed by the frequency spectrum. This spectrum will be compared with the spectrum of the healthy state signal to detect the bearing fault signature. Figure 10 shows the faulty bearing that was introduced in the motor.
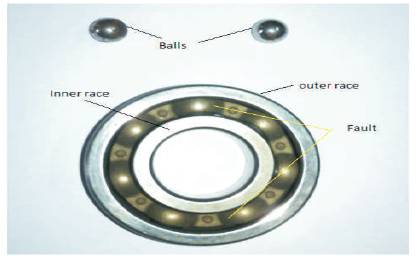
Figure 10. Fault in Bearing
The time domain signal shown in Figure 11 is very difficult to say anything about the fault since it looks similar to the healthy state signal. But once the frequency domain signal is seen as shown in Figure 12 the difference seems to be very clear. The spectrum shows the signatures of the bearing faults has been marked. There are some small peaks which is otherwise not present in the healthy state signal. These are due to the fault in the bearing. So the fault is very much evident in the spectrum where the comparison is made. The fault frequency is shown in the last section.
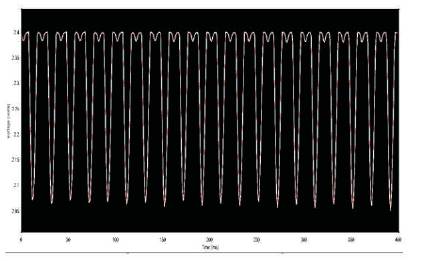
Figure 11. Signal with Bearing Fault
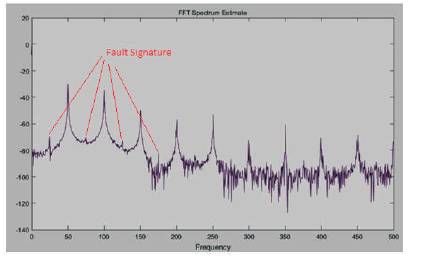
Figure 12. Frequency Spectrum of the Signal with Bearing Fault
In this section the rotor fault is detected. The healthy state rotor has been shown in Figure 7. Figure 13 shows the defective rotor. The cracks on the surface of rotor is noted. Such cracks may occur due to rub or friction. It may also happen due to thermal stress and unbalanced shaft.
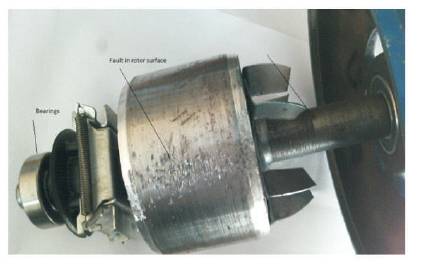
Figure 13. Fault in Rotor
The experimental setup as in Figure 5 is made to run with defective rotor. The time domain voltage signal is shown in Figure 14 and its frequency domain is shown in Figure 15.
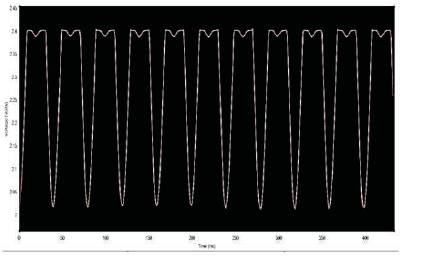
Figure 14. Signal from Motor with Rotor Fault
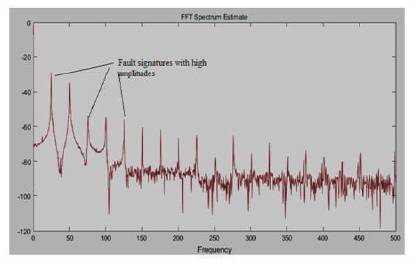
Figure 15. Frequency Spectrum of the Rotor Fault Signal
Now looking at the time domain signal in Figure 14 again, it is very difficult to say anything about the fault since it looks similar to the healthy state signal. But one should not make any immediate conclusion that it does not signify any fault in the machine. It is important to make further analysis in other domain of the signal. So again the FFT [5] of the time domain signal is taken and the fault revealed itself in different manner. From the spectrum (Figure 15) it can be seen that there are large peaks at the fundamental frequency and the fault frequency. It is quite clear that the spectrum is quite different from the healthy state signal.
In the previous section bearing and rotor fault obtains the signal one after the other at the respective faults was taken. The frequency spectrum of the signal is also shown. From the comparison of the faults conditions with the healthy conditions clear view of distinction is seen. It was clear that the frequency spectrum revealed the faults with utmost clarity. The overall results are summarized in Table 3.
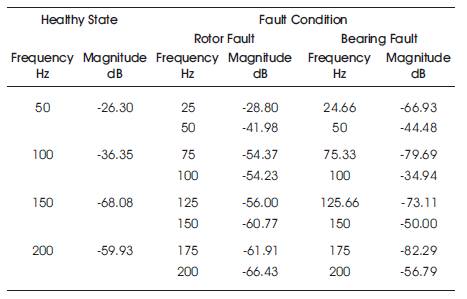
Table 3. Results showing Frequency Components
From Table 3, the healthy state signal contains fundamental components of 50 Hz and its harmonics. A comparison can be made that with the bearing fault, the fundamental components with its multiple harmonics are present as seen in the healthy signal, but some other components of frequency, such as 25 Hz, 75 Hz, and 125 Hz etc., which were not present in the healthy signal are also seen. So it is very much likely that this could be the fault signature of the bearing defect. Similarly, if we take the rotor fault and observe the above table, we again see the frequency components which were not present in the healthy signal. But it is also evident that the fault frequencies of rotor fault and bearing faults are quite similar. This may raise confusion between the rotor fault and bearing fault. But if the magnitudes of the fault frequencies are observed, it is noticed that the magnitudes of the frequencies of both the faults are different. So one can say that in order to make a clear distinction between rotor fault and bearing fault, it is important to make a note on both frequency as well as magnitudes.
In this paper it has been clearly shown that Fast Fourier Transform is a very effective technique to detect and diagnose the fault in Induction machine. In fact it is also true that this can be extended to any electrical machines. Further, Motor current signature analysis is also a very promising technique to apply to such problem. Current as a monitoring parameter has a potential to reveal necessary information when proper transform technique is applied such as FFT as shown in this work. It is also shown that the current sensor which we have used is suitable for condition based monitoring of machine. This research work can be extended in future with some other monitoring parameter such as Vibration. One can go with vibration based condition monitoring with suitable vibration sensor. It has been established by many research that vibration is quite an important machine parameter. That may be the reason why close to 70% [7] of the condition based monitoring are Vibration based. So in future the same task could be repeated with vibration as a monitoring parameter.
The Authors would like to thank Council of Science & Technology (CST), U.P, Lucknow for funding the research work. This paper is a part of project titled, “Condition monitoring and fault diagnosis of Induction motor by Transformative technique” carried out at Department of Electrical Engineering, Institute of Engineering & Technology, Lucknow, U.P.