Figure 1. Normal ECG Signal
ECG feature extraction stage is a significant job in diagnosing most of the cardiac diseases after the preprocessing of the ECG signal. Features extracted from ECG are extremely useful in diagnosis. In the previous work to detect the QRS complex wavelet multi-resolution analysis, threshold consideration was used. A structure has been proposed for detection of the QRS complexes of the ECG signals with help of Virtual Instruments (VI) of LabVIEW for the standard MIT- BIH arrhythmia database. This structure detects various features of QRS complex. This paper deals with a resourceful composite method which has been proposed for detrending, denoising and feature extraction of the ECG signals. The proposed structure first employed a wavelet-based detrending and denoising of the ECG signal. Then a novel ECG feature extractor was executed. The proposed feature extractor consists of virtual instrument of LabVIEW like Read Biosignal VI, Extraction Portion of signal express VI, Waveform Max-Min VI etc. The Waveform Max-Min VI and Extraction Portion of signal express VI is the alternative for the Peak detector VI without any threshold calculation. Various features like QR level, RS level, QR slope and RS slope etc have been detected by the proposed structure. LabVIEW 2013 version has been used here to design the feature extractor.
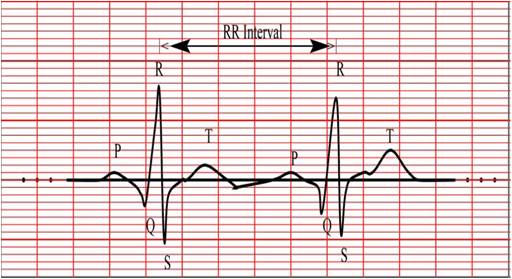
Usual evaluation of arrhythmia for patients has been a long time research. The cause of heart arrhythmias are due to the variations in the heart rate or irregularities and are characterized by the Electrocardiogram (ECG also known as EKG, abbreviated from the German Elektrokardiogramm) beats or patterns. The ECG signal is a representation of the bioelectrical activity of the heart representing the cyclical contractions and relaxations of the human heart muscles[8]. The ECG waveform consists of five different component waves, namely P, Q, R, S and T waves followed by a conditional U wave[11] as shown in Figure 1. The PQRST complex features in an ECG signal are the duration, location, amplitudes and shapes of waves. These features can be recognized by experienced cardio doctors for diagnosing human heart diseases.
In the case of regularity of the signal R-R intervals, P-P intervals and bits per minute (bpm) are usually measured and in the case of signal shape PR, QRS and QT intervals could be measured and the extreme values of single heartbeat are checked for any changes in the average heartbeat [7]. It is very important to evaluate a QRS detector algorithm using a standard arrhythmia database. There are MIT- BIH databases available [1].
Figure 1. Normal ECG Signal
The MIT-BIH arrhythmia database is used in the study for performance evaluation. The database contains 48 records, each containing two-channel The ECG signals for 30 min duration are selected from 24-hr recordings of 47 individuals. There are 116,137 numbers of QRS complexes in the database. The subjects were taken from 25 men aged 32 to 89 years, and 22 women aged 23 to 89 years and the records 201 and 202 came from the same male subject. Each recording includes two leads; the modified limb lead II and one of the modified leads V1, V2, V4 or V5[8] .
Jiapu Pan and Willis J. Tompkins [1] algorithm reliably detects QRS complexes using slope, amplitude, and width information. A bandpass filter preprocesses the signal to reduce interference, permitting the use of low amplitude thresholds in order to get high detection sensitivity. Mahmoodabadi et al. [2] proposed to detect the R wave, wavelet filters (D4 and D6). Details 23 – 25 were kept and all other details were removed. This procedure removed low frequencies and high frequencies. And to detect the Q and S peaks, in order to make the peaks noticeable, all the details of the signal were removed up to detail 25. The remaining approximation signal was searched for extremum points about the R peaks formerly detected. Zhao et al. [3] proposed two different feature extraction methods that are applied together to obtain the feature vector of ECG data. The wavelet transform is used to extract the coefficients of the transform as the features of each ECG segment. Simultaneously, autoregressive modelling (AR) is also applied to obtain the temporal structures of ECG waveforms. Sufi et al. [4] proposed ECG obfuscation method, which uses cross correlation based template matching approach to detect all ECG features followed by corruption of those features with added noises. Without the knowledge of the templates used for feature matching and the noise, the obfuscated features cannot be reconstructed. Bhyri et al. [6] performed undecimated discrete wavelet decomposition with the biorthogonal wavelet on the input signal. Then it searches for zero crossing points in the detail coefficients at all levels and then it selects the zero crossing points at the largest scale as the coarse estimation of the real peaks. In the proposed algorithm, one peak detector is used for R wave. Miad Faezipour et al. [8] algorithm marks peaks that are above zero and valleys that are below zero by the help of WA Multiscale Peak/Valley Detection VI in LabVIEW. This particular VI uses the Multiresolution wavelet analysis to detect peaks or valleys of a signal. By determining local maxima above a predefined threshold or local minima below the threshold value, these peaks or valleys can be extracted in this VI.
M. K. Islam et al. [10] analysed to find that the peaks and valleys (especially Q and S points) become more distinct after wavelet multi-resolution analysis.
The present work has been proposed that, WA Detrend Virtual Instrument (VI) can be used to remove the lowfrequency baseline wandering (or trend) of a signal using the sym5 wavelet. Wavelet denoise VI is considered with Undecimated Wavelet Transform (UWT) sym5 and multiple levels on the detrended signal to make only the QRS complexes of the signal more distinct. The Rpeak has been detected with Waveform Min Max VI and adaptive thresholding and valleys (Q and S point) have been detected by Extract Portion of Signal Express VI of LabVIEW. The special feature of the proposed work is that there is no requirement of any thresholding for peak and valley detection, however without using threshold value, there is no loss of any peak which may arise due to thresholding.
LabVIEW (Laboratory Virtual Instrument Engineering Workbench) is a graphical programming language that uses icons instead of lines of text to create program. LabVIEW acquires the data flow programming, unlike text based programming language. LabVIEW acquires the data flow programming, where the flow of data determines execution[6]. It is designed by National Instruments that is specially for easy and powerful data acquisition purpose. Thus, LabVIEW software is used for data recording and visualization, due to its known capabilities [10]. The Advanced Signal Processing Toolkit is a major required toolkit in the proposed preprocessing work.
The dataflow diagram of the proposed work shown in Figure 2 focuses on the way how signal is processed at each level of feature extraction. The detailed discussion on dataflow diagram is mentioned in the subsequent sections.
For research purpose, the ECG signal is obtained from the MIT- BIH Database, the signal taken from MIT-BIH Arrhythmia Database is the input ECG signal. To import the ECG signal 'Read Bio signal Express VI' has been used as shown in Figure 3. This VI reads bio signals block by block and supports reading multiple channels and reading annotations.
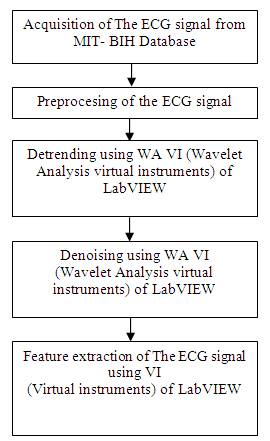
Figure 2. Data flow diagram of the proposed work
The MIT-BIH arrhythmia database acquired from PhysioNet - PhysioBank is a file with extension “.hea”. This “.hea” extension file is imported in the read bio signal VI configuration. In this configuration, information regarding the signal, like its property, its waveform values and waveform graph has been analysed. To analyse every 'one' second of ECG signal, the time increments numeric property which increments the signal by one second is considered.
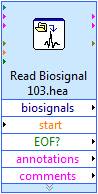
Figure 3. LabVIEW Read Biosignal Express VI
Baseline wandering usually comes from respiration at frequency wandering between 0.15Hz and 0.3Hz and it can be suppressed by a high pass digital filter. Wavelet transform can also be used to remove the baseline wandering by eliminating the trend of the ECG signal. The wavelet transform based approach is better as it introduces no latency and less distortion than the digital filter based approach [9]. The LabVIEW Advanced Signal Processing Toolkit (ASPT) provides the WA Detrend Virtual Instrument (VI) which can be used to remove the low frequency baseline wandering (or trend) of a signal as shown in Figure 4. In the WA Detrend VI, there has also been a suggestion of using the sym5 wavelet, as it resembles the QRS complex of ECG more than the other type of wavelets. An internal parameter called trend level is required for baseline removal. The trend level is calculated as follows:
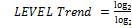
Where, t is the observation duration and N is the number of sampling points in observation time t [10]. Here an analysis of 'one' second duration signal with 360 sampling points has been done and this consideration leads the value of trend level to 0.1178Hz. In the WA Detrend VI, the threshold frequency equal to 0.1178 Hz is used and the selected wavelet is symmlet5 (sym5).
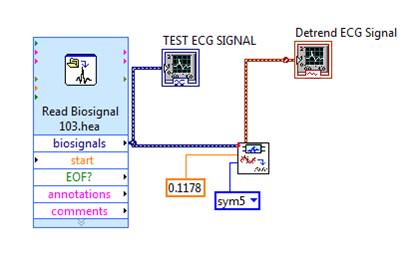
Figure 4. Detrending process using WA Detrend VI
Bhyri et al. [6] used Daubechies (db06) wavelet because this wavelet is similar to the real ECG signal and also Daubechies wavelet being orthogonal wavelet, is suitable for signal denoising, whereas biorthogonal wavelet is suitable for signal feature extraction.
The Undecimated Wavelet Transform (UWT) sym5 with single level and soft thresholding for the wavelet denoising VI block setup has been used. The Denoising process using Wavelet Denoise Express VI is shown in Figure 5. UWT results in the approximation wavelet coefficients and the detail coefficients at all decomposition levels. As UWT has the shift invariant property, it is highly efficient in robust-feature extraction applications. In addition, peak detection using UWT-based methods are more robust and less sensitive to noise, since UWT-based methods find zero-crossings in the multiscale UWT coefficients. These settings perform efficient denoising on the original ECG signal and smoothens the signal without suppressing ECG features such as the P and T waves. For effective feature extraction, the application of wavelet denoise VI is considered with UWT sym5 and multiple levels on the detrended signal to make only the QRS complexes of the signal more distinct [2].
The maximum and minimum values and their associate time values for a waveform are determined by Waveform Min Max VI.
It extracts portions of data from the input signals and returns the extracted data. A single point or a range of data, data by time or index could be extracted. Also, time and index of the first occurrence of a value are extracted.
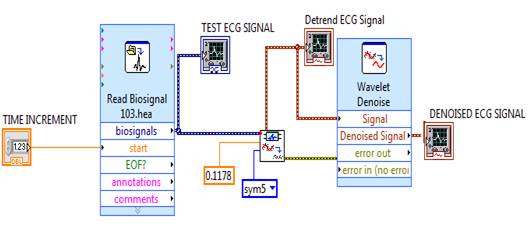
Figure 5. Denoising process using Wavelet Denoise ExpressVI
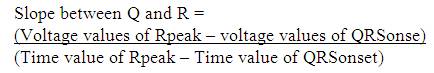
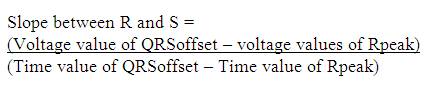
In the proposed work as shown in Figure 6, firstly Rpeak of QRS complex has been detected. With reference to 'Rpeak', 'Q' and 'S' beats are detected, which provides the detailed knowledge of QRS complex like its voltage and time values. Time value of 'Rpeak', 'Q' and 'S' provides the QRS interval, voltage and time value of 'Rpeak' along with 'Q' which provides the QR- slope and height of Q to 'Rpeak'. Similarly, voltage and time value of 'Rpeak' along with 'S' provides the RS- slope and height of 'Rpeak' to 'S'. The processes adapted in the proposed work are listed below. Steps:


Unlike the method adapted by Bhyri et al. [6] there will be no requirement of using Mathscript tool to calculate the slope.
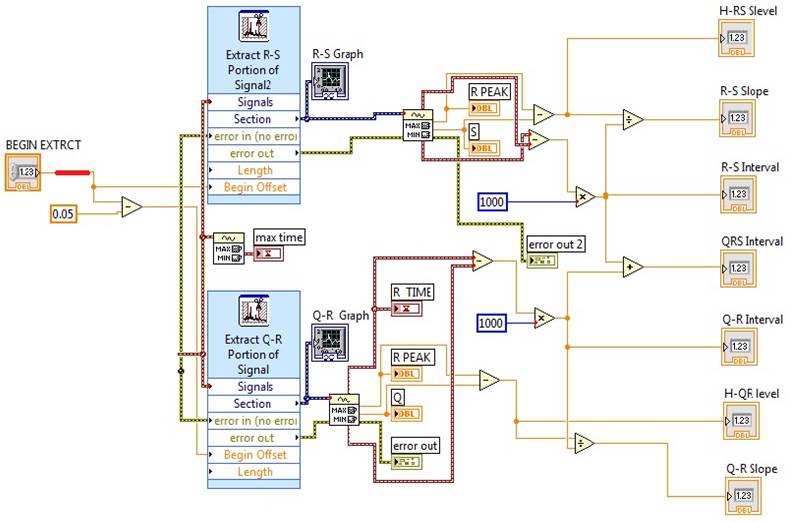
Figure 6. The ECG feature extraction using Waveform Min Max VI and Extract Portion of Signal Express VI
To show the preprocessing performance of the proposed model, a raw MIT – BIH arrhythmia database signal is taken as a test ECG signal as shown in Figure 9a and the observed performance of the model is as follows:
The various features that can be extracted from the ECG signal (taken from MIT-BIH Arrhythmia database) are mentioned in Table I. These features have been observed by the LabVIEW2013 based model. The result obtained for one minute duration signal is listed in Table 2 a and Table 2 b.
Y.-C. Yeh et al. [5] listed the range of PQRST complex feature values for tape # 103 as shown in Table 3.
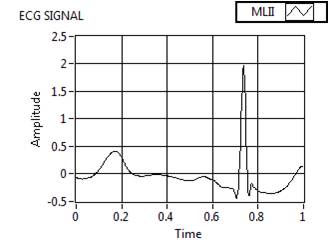
Figure 7. Wave having Rpeak value and its time value
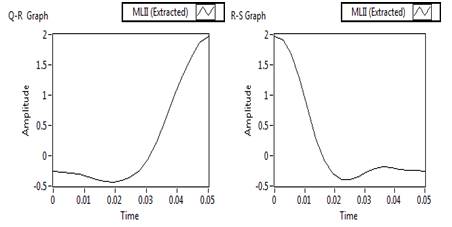
Figure 8. Q-R and R-S portion extracted waveform
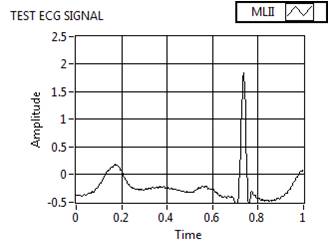
Figure 9(a). Preprocessed Signal
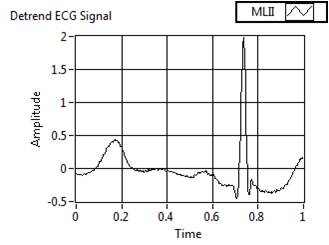
Figure 9(b). Preprocessed Signal
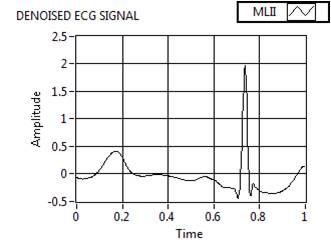
Figure 9(c). Preprocessed Signal
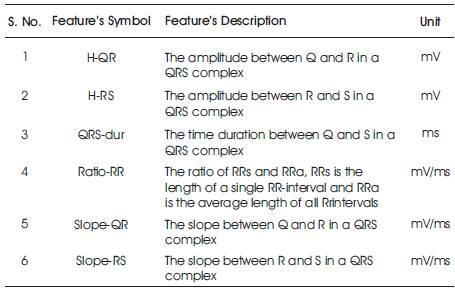
Table 1. Description of features
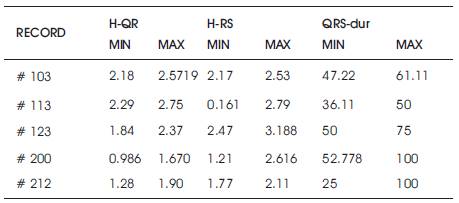
Table 2(a). Obtained Features
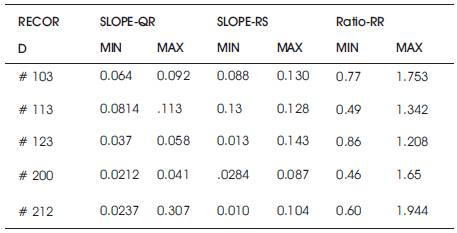
Table 2(b). Obtained Features
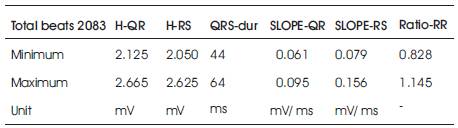
Table 3. Previous Values (Y.-C. Yeh et al. [5])
With reference to above feature values, the features value found by proposed model has been matched and the deviation is shown in Table 4 a nd Table 4b. The comparison is shown in Table 5c.
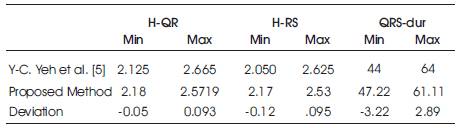
Table 4a. Deviation Measurement
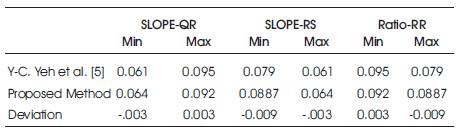
Table 4b. Deviation Measurement
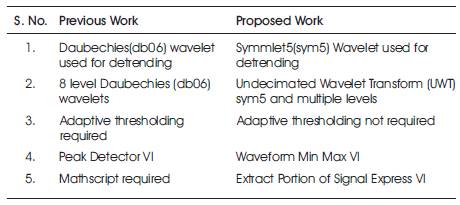
Table 5. Comparison with previous work
In this paper, the process of feature extraction of the ECG signal using LabVIEW VI (virtual Instrument) is proposed. For this, the input signals acquired from MIT-BIH Arrhythmia data base are properly pre-processed by WA (Wavelet Analysis) detrend VI and Wavelet Denoise Express VI. In the proposed work, there is an advantage that we don't need any threshold value for peak and valley detection, moreover disuse of threshold empowers the method by not removing any information for the desired signal. The proposed work produces the novel feature extractor which detects various features with the help of Virtual Instruments and the numeric function of LabVIEW. The main benefit of this graphical programming language is that, it provides a robust and resourceful environment and tool for generating very fast, less complex and useful algorithms. Performance evaluation is done and the comparison is shown in Table 5.
From Table 5, it can be concluded that the proposed work reaches maximum 98.6% of values obtained by Y.-C. Yeh et. al. [5].