(1)
This paper draws a comparative study of the induction motor stator current using Fast Fourier Transform (FFT) and Wavelet transform. The FFT is one of the most popular and oldest techniques used in signal processing to extract the frequency contents of the signal in the steady state. However, it suffers a drawback that in the process of extracting frequency information; the time information gets partially lost. This drawback is compensated by the wavelet transform. This is a new technique which is gaining popularity in many fields of science and engineering. In this paper, a single phase induction motor stator current signal data has been analyzed using FFT and Wavelet in the latest MATLAB environment. It has been shown that these two transform techniques reveals different aspects of a same stator current signal.
Induction motors are widely used in industry and are considered as critical components for electric utilities and process industries. The operators of induction motor drives are under continual pressure to reduce maintenance costs and prevent unscheduled downtimes that results in lost production and financial income. Many operators now use online condition-based maintenance strategies in parallel with conventional planned maintenance schemes. Various techniques have also been proposed for this schemes [10]. However, it is still the operator who has to make the final decision on whether to remove a motor from service or let it run based on information from condition monitoring systems. Motor Current Signature Analysis or (MCSA) [1]-[7] is the widely applied scheme in condition monitoring of motors. Crucial point is that it is sensing an electric signal that contains current components that are directed by the product of unique rotating flux components caused by faults such as broken rotor bars, air-gap eccentricity, and shorted turns in low voltage windings, etc. MCSA can detect these problems at any early stage, which avoid Secondary damage and also complete failure of the motor. The greatest challenge in the area of condition monitoring is the diagnosis of a fault before it becomes critical, and an early detection of this allows the repair of the fault. In general, condition-monitoring schemes have been widely used to sense specific failure modes in one of the three main induction motor components (i.e) the stator, the rotor, and the bearing. Traditionally, condition monitoring of induction machines has been divided into two areas such as mechanical problems and electrical problems. Mechanical problems include bearing wear, rotor unbalance, and air gap distortion. Electrical problems include broken rotor bars [3] and winding insulation breakdown. Typically, accelerometer are used to measure mechanical vibrations for the detection of mechanical faults, and current probes are used to monitor electrically related problems before catastrophic failures in a component occur. Almost 40-50% of all failures are bearing related, around 5-10% are rotor faults, and unbalance faults are within the 12% of others faults. Bearing faults are the most important type to study since they cause half of all motor failures [9]. Some of the most common causes of bearing faults include contamination of lubricant, loss of lubricant, over loading, and excess heating. The ultimate result is either extreme vibration leading to catastrophic failure, or a complete seizure of the bearing. Stator faults are basically the breakdown of the winding insulation. This may be caused by thermal or voltage stress, mechanical vibration, or even an abrasion between the stator and rotor. The weakness of the winding insulation can further result in the turn-turn short circuit and eventually winding-ground short circuit. Rotor faults can be divided into two types. One is associated with the rotor itself, such as bar defect or bar breakage in induction motors. This type of fault occurs from thermal stresses, hot spots, or fatigue stresses during transient operations, such as startup especially in large induction motors. Broken bars [3] change the torque significantly and also affect the motor current, which can cause unsatisfactory operation or shutdown. Since broken bars really occur in large machines with welded copper cages, early detection is very desirable. The other type of rotor fault is related to air gap eccentricity. Air gap eccentricity is a common effect arising from a range of mechanical problems in induction motors, such as load unbalance, or shaft misalignment.
The aim of this paper is to present a comparative analysis study of stator current of a single phase induction motor using FFT and Wavelet transform.
The objective of this paper is to make a comparative analysis of the real time stator current signal of an induction motor. The technique applied here is FFT and wavelet transform. It has been done in MATLAB environment. The comparison will show that wavelet transform is far more promising than FFT. In contrast to FFT, wavelet could provide better visual and qualitative results.
A wavelet is a wave-like oscillation with amplitude that begins at zero, increases, and then decreases back to zero. It can typically be visualized as a brief oscillation like, one might see recorded by seismograph or heart monitor. Generally, wavelets are purposefully crafted to have specific properties that make them useful for signal processing. Wavelets can be combined, using a “reverse, shift, multiply and integrate technique called convolution”, with portions of a known signal to extract information from the unknown signal. As a mathematical tool, wavelets can be used to extract information from many different kinds of data, including but certainly not limited to audio signals and images. Sets of wavelets are generally needed to analyze the data fully.
The wavelet transform is often compared with the Fourier transform, in which signals are represented as a sum of sinusoids. In fact, the Fourier transform can be viewed as a special case of the continuous wavelet transform. The main difference in general is that wavelets are localized in both time and frequency, whereas Fourier transform is only localized in frequency [12]. A wavelet is a mathematical function used to divide a given function or continuous-time signal into different scale components. Usually one can assign a frequency range to each scale components. Each scale component can then be studied with a resolution that matches its scale. A wavelet transform is the representation of a function by wavelets. The wavelets are scaled and translated copies (known as “daughter wavelets”) of a finite-length or fast-decaying oscillating waveform (known as “mother wavelet”). Wavelet transforms have advantages over traditional Fourier transform for representing functions that have discontinuities and sharp peaks, and for accurately deconstructing finite, nonperiodic and/or non-stationary signals. Wavelet transforms are classified into Discrete Wavelet Transforms (DWTs) and Continuous Wavelet Transforms (CWTs). Note that both DWT and CWT are continuous-time (analog) transform. They can be used to represent continuous-time (analog) signals. CWT’s operate over every possible scale and translation, whereas DWTs use a specific subset of scale and translation values or representation grid.
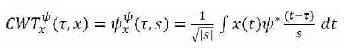
Mathematically, continuous wavelet transform is represented as below,
As seen equation (1), the transform signal is a function of two variables, tau and s, the translation and scale parameters, respectively. Ψ(t) is the transformed function, and it is called mother wavelets.
The wavelet transform allows time localization of different frequency components of a given signal. In case of WT, the analyzing functions, which are called wavelets, adjust their time-width of their frequency in such a way, that the higher frequency wavelet will be very narrow and lower frequency ones will be broader. Therefore, WT can isolate the transient components in the upper frequency isolated in the shorter part of power frequency cycle. The ability of WT [3] to focus on short time intervals for high frequency components and long time intervals for low-frequency components improve the analysis of the signal with localized impulses and oscillations. Figure 1 illustrates the implementation procedure of Discrete WT (DWT):
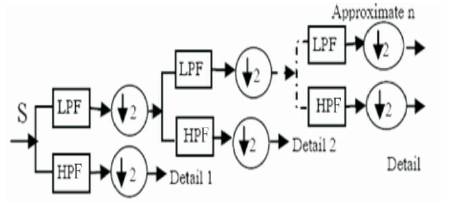
Figure 1. Implementation of DWT
At the first stage, an original signal is divided into two halves of the frequency bandwidth and sent to both the HPF and LPF [11]. Then the output of the LPF is further cuts into half of the frequency bandwidth, and sent to the second stage, this procedure is repeated until the signal is decomposed to a pre-defined level. If the original signal is being sampled at fs Hz, the highest frequency that the signal could contain, from Nyquist's theorem, would be fs /2 Hz. This frequency would be seen at the output of the high frequency filter, which is the first detail. Thus, the band of frequencies between fs /2 and fs /4 would be captured in detail similarly, the band of frequencies between fs /4 and fs /8 would be captured in detail 2, and so on.
This section presents an overview of the online experimental setup proposed [1]. Various authors or researchers have proposed different ways of acquiring the stator current signal of the motor. Depending on the complexities of the monitoring system and machine, there may be some variation in equipments or components used. However, the basic idea is same, i.e., to access the motor current and analyze the same in computer [4]. Figure 2 shows the block diagram of the setup.
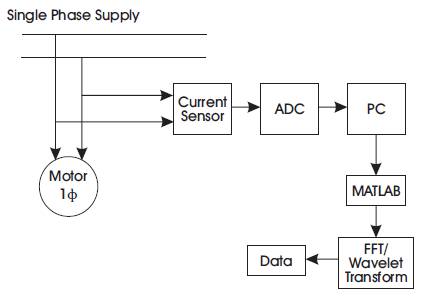
Figure 2. Experimental Layout
As evident from the diagram, the stator current of the motor is the monitoring parameter. The current is sensed by the current sensor. The output of the current sensor is sampled by the Analogue to Digital converter at the sampling rate of 4000 samples per second. Then the sampled stator current is sent to the computer. Prior to begin the experiment, ADC software is installed in the computer. The ADC software displays the voltage signal proportional to the stator current. Now, the obtained current signal is in time domain. In order to analyze it into frequency domain, FFT analysis is carried out. It is done with the help of MATLAB software installed in the same computer. Thus, the frequency spectrum gives the frequency content present in the stator current. Then, the wavelet toolbox is used to extract many features of the signal.
The outline of the basic diagram as in Figure 2 with various blocks has already been explained. This section gives the actual experimental setup that was implemented.
Figure 3 shows the overall setup with induction motor, current sensor, Arduino Uno, Analogue to Digital converter and Personal computer. The integration of all these in a proper manner facilitate the acquisition of the motor signal.
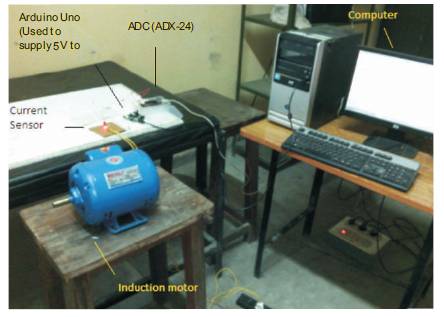
Figure 3. Overall Experimental Setup
Figure 4 shows the magnified version of the acquisition section which involving current sensor, Arduino Uno, and ADC.
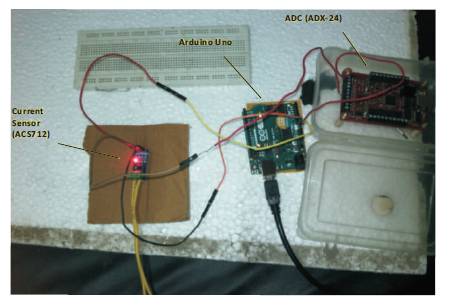
Figure 4. Sensor & Acquisition Section
The current sensor is supplied with 5 volt power from Arduino Uno. The current sensor used here is ACS712-05B. The sensed current is being sent to ADC. Here the Analogue to Digital Converter used is ADX-24. It samples the signal at the sampling rate of 4000 samples per second. Then the sampled signal is sent to the computer for further analysis.
The specifications of the induction motor are as follow:
The features of current sensor is as follows:
The ADX-24 is used here as ADC. Figure 5 highlights the important features of.
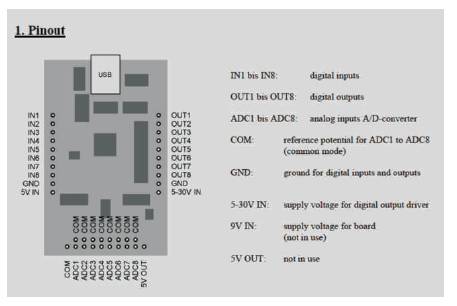
Figure 5. ADX-24
The block diagram shown in Figure 2 is run with induction motor on no load. The signal is shown in Figure 6.
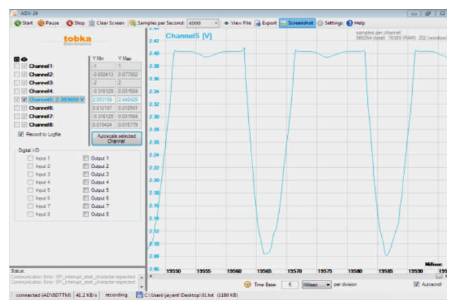
Figure 6. Signal at 4000 Samples per Second
The Fast Fourier Transform is done in the Signal processing toolbox available in the MATLAB environment to show the frequency spectrum of the data recorded at 4000 samples per second. The toolbox is opened by typing 'sptool' in the command window. The FFT is shown in Figure 7.
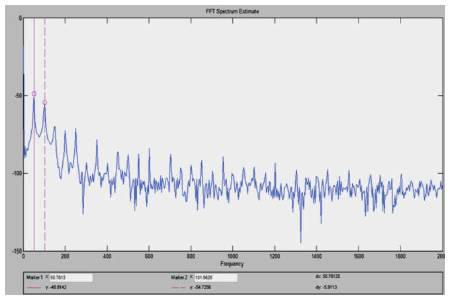
Figure 7. FFT of the Signal
The FFT of the signal shows that the signal is composed of fundamental frequency which is approximately 50.78 Hz here and its odd and even harmonics. The spectrum is also called signature of the induction machine on no load. The Table1 shows the major frequencies content as evident from the spectrum. It is clear that the motor current is composed of fundamental frequency and the odd and even harmonics. It mainly consists of three frequency component as clearly evident from the spectrum. The other components are present, but not in significant weight.
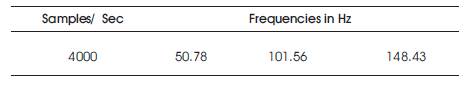
Table 1. Frequency Components
Figure 8 shows the Power Spectral Density (PSD) curve of the signal. Though it looks similar to FFT curve, it actually shows strength of variations of energy as a function of frequency. In other words, it shows at which frequency variations are strong and at which frequency variations are less. The unit of PSD is energy per unit frequency (width) and it can be obtained within a specific frequency range by integrating PSD within that frequency range. From the PSD, we can infer that the maximum energy of the signal is contained in above three components tabulated.
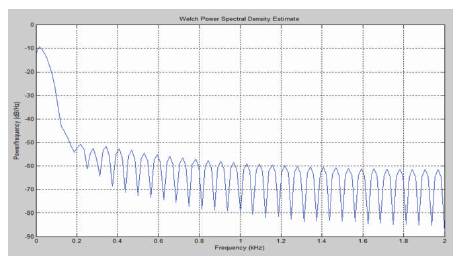
Figure 8. PSD of the Signal
The wavelet toolbox available in the MATLAB allows us to do the wavelet analysis of any signal. There are a number of applications available in the toolbox [2]. However, the authors have restricted their analysis to few applications which are relevant here, as we know that the wavelet transform localizes the signal both in time and frequency.
Figure 9 shows one dimensional Discrete Wavelet Transform. As explained earlier, a signal is decomposed into 'approximation' and 'details'. The former contains the low frequency components of the signal as it is just like Low pass filter. The detail part shows the high frequency content in the signal. The DWT is performed in wavelet toolbox in MATLAB. This is opened by typing 'wavemenu' in the MATLAB command window. The wavelet chosen here is 'Daubechies' level-5 (db3 level-5).
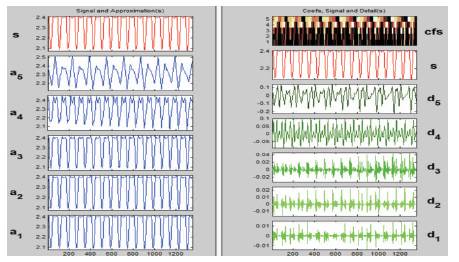
Figure 9. DWT (1-D) of the Signal
Figure10 shows the relationship between the scale and frequency.
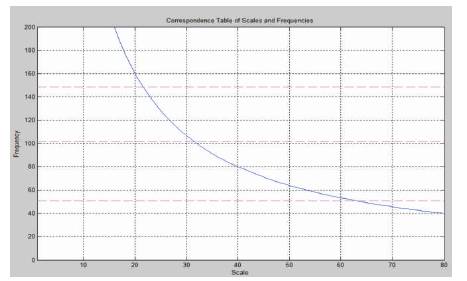
Figure 10. Scale vs. Frequency
Table 2 shows the corresponding scale and the frequencies.
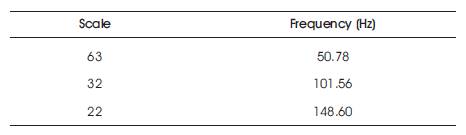
Table 2. Scale and Frequency
Now, authors use the continuous wavelet analysis to compute the Scalogram of the wavelet coefficient using db3. Figure11 shows the curve between scale and frequency of the signal. We can see the lines connecting the energy of the scalogram. Referring to the scalogram, it is found that the maximum energy is detected at scale 63, which corresponds to the frequency 50.78 and decreases progressively. This is one method of using wavelet analysis to obtain the spectral information of a signal.
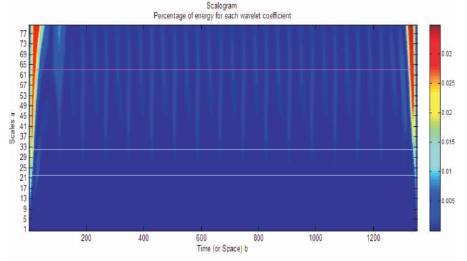
Figure 11. Scalogram
The paper has shown two different approaches of analysis of the induction motor current. The classical approach of FFT gives the frequency content of the signal. It is also useful to obtain the power spectral density of the signal. Wavelet, being new and emerging technique in signal processing could be utilized to explore the signal in a very different way which is not possible in this FFT. For example, the decomposition of the signal in low and high frequency signal. This has been shown in the Figure 9. Also, the scalogram in Figure 11 pictorially shows the energy distribution in the signal with respect to frequency. From this comparative analysis it could be emphasized that wavelet has much scope than FFT when it comes to signal analysis. With wavelets, it is also possible to locate the discontinuities and transients present in any signal which is impossible with FFT. This will be explored in the future work.
This paper is a part of the project, “Condition monitoring and fault diagnosis in Induction Motor by Transformative Technique”, funded by Council of Science and Technology, U.P (CST UP).