Figure 1. Schematic Representation of ECG Signal
In previous days, acquiring and analysis of ECG signals can be done using different softwares. But in this work with the help of Wavelet analysis in LabVIEW software (Graphical programming software), it is easy to understand and use when compared to other softwares like MATLAB, C etc. To be in advance, they focused not only on acquiring and analysis of ECG signal, but also on identification of cardiac disorders. This system can be executed in three stages. In the first stage, the signal is preprocessed to remove the noise and onsets and the offsets are extracted. In the second stage, detection of peaks and in the third stage, cardiac disorders were estimated.
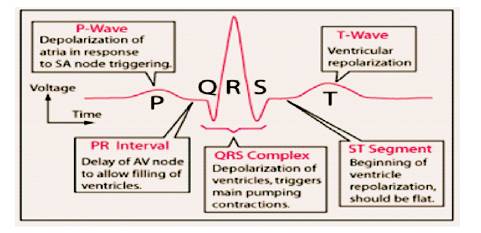
The ECG is a graphic record of the direction and magnitude of the electrical activity that is generated by depolarization and repolarization of the atria and ventricles. One cardiac cycle in an ECG signal consists of the P-QRS-T waves [7]. To find a heart disease, physicians inspect ECG for the existence of abnormal patterns like irregular beat, inter- atrial block, ST level change, and so on. However, bio-signals being non-stationary signals, the reflection may occur at random time-scale (that is, the disease symptoms may not show up all the time, but would manifest at certain irregular intervals during the day). Cardiovascular diseases and abnormalities alter the ECG wave shape; each portion of the ECG waveform carries information that is relevant to the clinician in arriving at a proper diagnosis. The electrocardiography operates when an electrical potential is generated in a section of the heart, and an electrical current is conducted to the body surface in a specific area. The schematic representation of ECG signal is shown in Figure 1. The ECG signal taken from a patient is generally corrupted by external noises, hence necessitating the need of a proper noise free ECG signal [1]- [9], [17].
Figure 1. Schematic Representation of ECG Signal
An Electrocardiogram (ECG) is a graphical record produced by an electrocardiograph, which records the electrical activity of the heart over time. The signal is constructed by measuring electrical potentials between various points of the body using a galvanometer. Understanding the various waves and normal vectors of depolarization and repolarization, it is very important to obtain useful diagnostic information [16]. ECG signals have a wide array of applications throughout the medical field in determining whether the heart is functioning properly or suffering from any abnormalities [18]. Figure 1 shows an example of a normal ECG trace, which consists of a P wave, a QRS complex and a T wave. The P wave is the electrical signature of the current that causes atrial contraction, the QRS complex corresponds to the current that causes contraction of the left and right ventricles and the T-wave results from the current generated during rapid repolarisation of the heart [15].
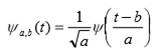
Wavelets are the powerful tool for representation and analysis of physiological waveforms. It is a mathematical function used to divide a given function or continuous time signal into different scale components. Usually one can assign a frequency range to each scale component. A wavelet transform is the representation of a function by wavelets. Wavelet transforms have advantages over traditional Fourier transforms for representing functions that have discontinuities and sharp peaks for accurately deconstructing and reconstructing finite, non-periodic and/or non-stationary signals [1]- [5]. The wavelet is scaled by a factor of 'a' and translated (or shifted) by a factor 'b' to give,
ECG signal processing is divided into three stages by functionality:
The block diagram is shown in Figure 2 for extracting the features of ECG signal.
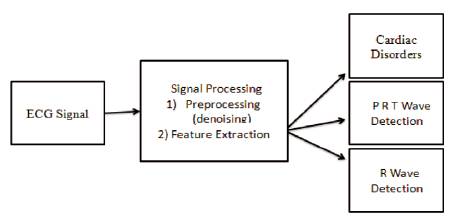
Figure 2. Block diagram
Pre-processing of ECG signals help us to remove unwanted components in ECG in order to extract useful information from the noisy ECG signal which needs to process the raw ECG signal [4].
The major causes for noise are:
Baseline wandering usually comes from respiration at frequency wandering between 0.15 Hz and 0.3 Hz and it can be suppressed by a high pass digital filter. Wavelet transform can also be used to remove the baseline wandering by eliminating the trend of the ECG signal. Here LabVIEW provides WA Detrend Express Virtual Instrument which removes low frequency trend of the signal [6].
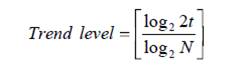
where t is the sampling duration and N is the number of sampling points. Trend level specifies the number of levels of the wavelet decomposition, which is equal to
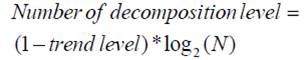
The one selected here is Daubechies (db06) wavelet because it is similar to the real ECG signal [10] .
Once the baseline wandering is removed, the resulting detrend signal is more stationary and explicit than the original signal. Instead feature extraction of the ECG signal may get affected by some other types of noise. This may be wideband noise, and such noise could not be removed by traditional filters. Hence for removal of wideband noises [6], the Wavelet Denoise Express Virtual Instrument is used here. The VI diagram for denoising is shown in Figure 3. The original ECG signal is shown in Figure 4.
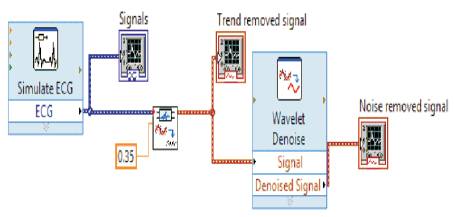
Figure 3. VI diagram for Denoising
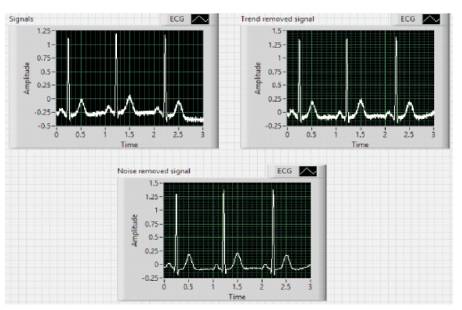
Figure 4. Original ECG, Base Line Wander removed Signal and Denoised Signal
For diagnosis purpose, we need to extract various features [12] from the preprocessed (denoised) ECG data [5], such as
Peak detection is one of the most important time-domain functions performed in signal monitoring [11]. Peak detection is the process of finding the locations and amplitudes of local maxima and minima in a signal that satisfies certain properties. These properties can be simple or complex. For example, requiring that a peak exceeds certain threshold value is a simple property. However, requiring that a peak's shape resembles that of a prototype peak is a complex property. Here WA multiscale peak detection virtual instrument is used in peak detecting mode to detect P, R, and T points by specifying proper width and threshold. Width specifies the width in number of samples [9]. Threshold specifies the value, which the virtual instrument uses to reject peaks of a particular size. In this system, we used two peak detectors. One peak detector is used for R wave; another peak detector is used for P and T waves [14].The VI diagram for peak detection is shown in Figure 5 and original ECG, denoised and peak plots are shown in Figure 6.
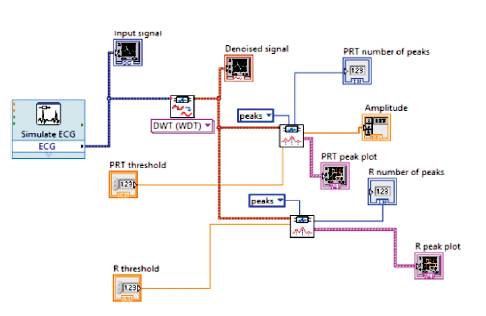
Figure 5. VI Diagram for Peak Detection

Figure 6. Original ECG signal, Denoised signal, Peak plots
In this system, while calculating the onsets and offsets of ECG signal, the denoised signal is taken as original signal. Here waveform features the use of virtual instrument for calculation purposes. Amplitude and ISO level are also determined using this virtual instrument. The VI diagram for calculating the onsets and offsets of ECG is shown in Figure 7 and original ECG and features of ECG is shown in Figure 8.
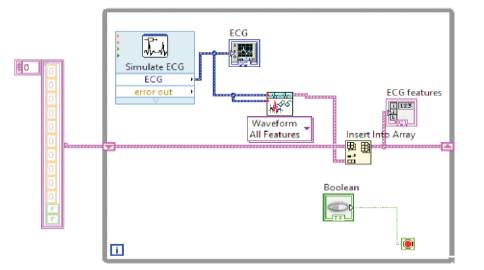
Figure 7. VI Diagram for Calculating the Onsets and Offsets of ECG
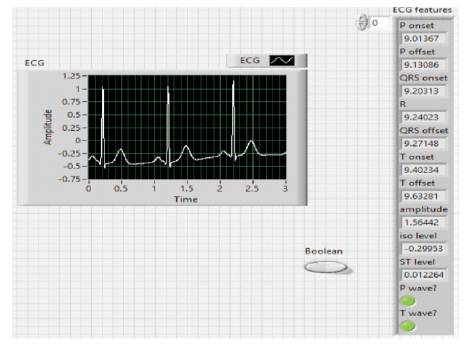
Figure 8. Original ECG, Features of ECG
ECG Feature Extraction plays a significant role in diagnosing most of the cardiac diseases. The shape and size of the ECG signal contain useful information about the nature of cardiac diseases Table 1. The corresponding details are difficult to analyze visually by the naked eye, hence computer assisted analysis and classification of cardiac diseases can help physicians to monitor cardiac health easily and accurately. The VI diagram diagnosing cardiac disorders is shown in Figure 9. Thus, computeraided automatic detection and classification of cardiac events is very useful in healthcare technology, as it will help the doctor to diagnose and act faster in case of emergency conditions.
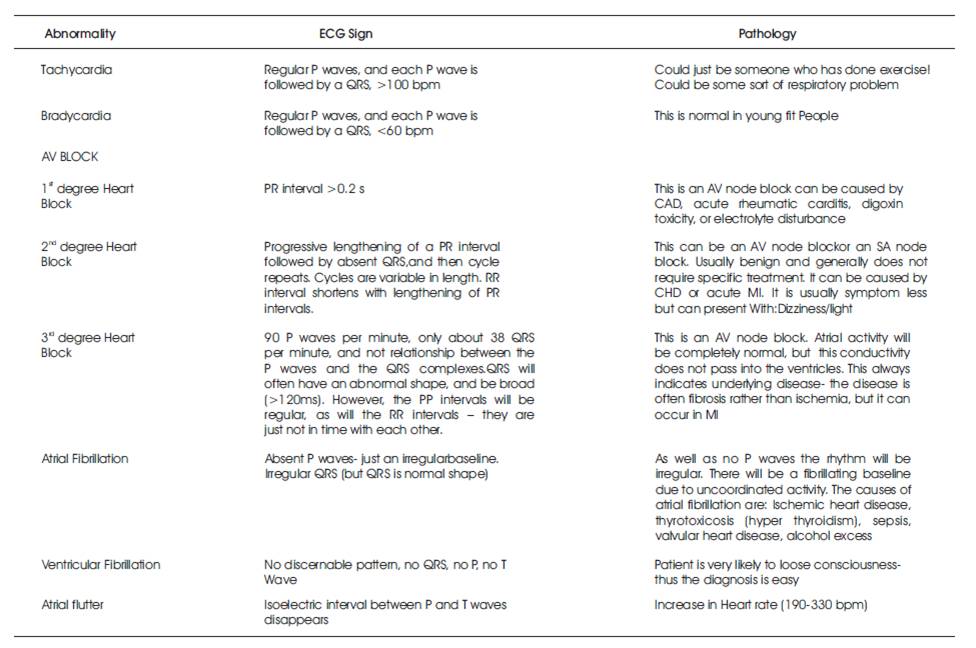
Table 1. Types of Cardiac Disorders
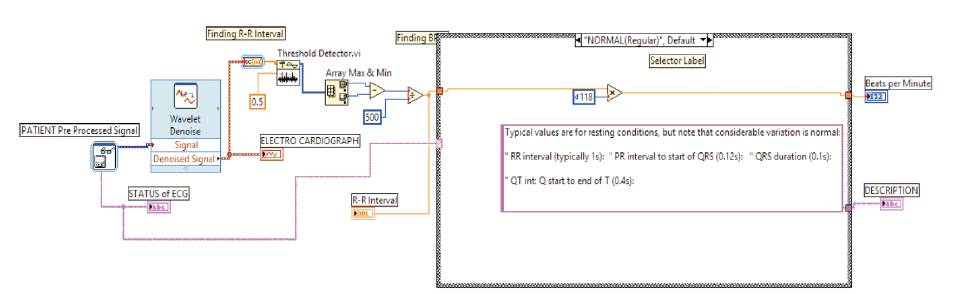
Figure 9. VI Diagram for Diagnosing Cardiac Disorders
The main objective of this research are listed as Preprocessing, Denoising and Detection of QRS complex from the ECG signal. For ECG signal de-noising and base line wandering removal, the proposed method gives better performance than other methods available in the literature. This method allows de-noising and the removal of base line wandering without the need of base line point selection that makes its use easier than other methods. By using wavelets, de-noising is easy and comfortable and perfect reconstruction is achieved. In this transform the wavelets associated with different sub-bands have different norms.
The main advantage of this graphical programming language is that, it provides a robust and efficient environment and tool for generating very fast, less complex and useful algorithms [13].
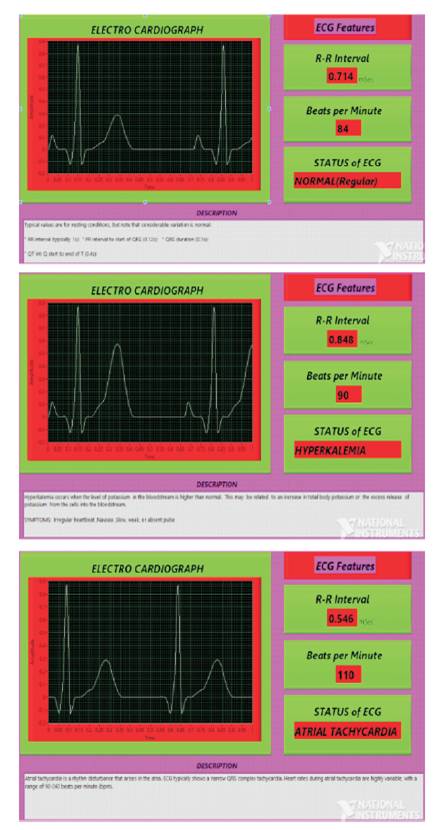
Figure 10. Different Outputs for diagnosing cardiac disorders
Compression of ECG signal: To deal with the huge amount of Electrocardiogram (ECG) data for analysis, storage and transmission; an efficient ECG compression technique is needed to reduce the amount of data as much as possible while pre-serving the clinical significant signal for cardiac diagnosis.
The authors would like to acknowledge the Department of Electronics and Instrumentation Engineering of Sree Vidyanikethan Engineering College, Tirupathi and JNTUK, Kakinada for providing the facilities to carry out this work.