(1)
Noise can limit the extraction of some basic and vital peculiarities from biomedical signals and thus makes it impossible to perform exact analysis of these signals. EMG (Electromyography) signals is one such case, which can be affected by number of factors. For example, power line noises, noises caused by electrical and electronic equipments, inherent semiconductor devices noises, etc. Electromyography (EMG) signals can be used for clinical/biomedical application and modern human computer interaction. EMG signals acquire noise while traveling through tissue, inherent noise in electronics equipment, ambient noise, and so forth. This paper presents an independent component analysis approach for removing noise from raw EMG signals. As the base of the presented systems is independent component analysis, but the technique also uses a multistep approach of filtering and combining the signals to recover the lost components also. The simulation results show that the proposed algorithm removes the noise without compromising the useful information of signal.
Biomedical signals generally measures an aggregate electrical signal captured from any body organ which is used to generate a physical activity in that part of the body. This signal is a function of time and represented in terms of frequency and phase. The EMG signal is a biomedical signal that measures electrical signals produced in the muscles when it performs any kind of physical activity. The nervous system continuously controls the muscle movement (contraction/extraction). Henceforth, the EMG signal is a complex signal, which is controlled by the nervous system and is related to the anatomical and physiological properties of muscles. Inside the body, EMG signal catches noise while going through diverse tissues. Additionally, the EMG electrodes especially which is mounted at the surface of the skin gathers signals from distinctive motor units at once which may produce superposition of diverse signals. In present days, the classification and detection of EMG signals is turning into an imperative necessity in biomedical instrumentation. The primary purpose behind the enthusiasm for EMG signal analysis is in clinical diagnosis and biomedical applications. As such, lots of researches have been performed in this field for creating better algorithms improving existing techniques, and enhancing detection strategies to diminish noise and to get precise EMG signals. Even though noise filtration from EMG signal is still a problem. This paper presents an independent component analysis based filtration approach in combination with filters which are used to filter and extract important information from the signal and recombining it at the later stage. The rest of the paper is arranged as that the second section presents a brief review of related work while the third section presents the EMG characteristics followed by noise sources and their characteristics. The fourth section presents the description of independent component analysis, followed by the proposed algorithm in the fifth section. Finally, the simulation results and conclusions are presented in section six and seven respectively.
This section presents the brief review of the related literatures found useful during writing of this paper. A feed- Forward Error Back-propagation Artificial Neural Networks (FEBANN) and Wavelet Neural Networks (WNN) based classifiers for classification of EMG signals were developed and compared in [4], [10] which shows that the WNN based classifier out performed the FEBANN counterpart. Angkoon Phinyomark et al [1], [8] presented two novel mean and median frequencies (MMNF and MMDF) for robust feature extraction that tolerate with White Gaussian Noise (WGN). As a result, noise removal algorithm is not needed. Farzaneh Akhavan Mahdavi et. al [7] presented Wavelet Transform (WT) based technique to extract Surface EMG (SEMG) features, considering it is consistent with the nature of EMG as a non-stationary signal. They show an improvement in class separability of hand movements in feature space. Furthermore, it has been shown features extracted from the first and second level of WT decomposition by second order of Daubechies family (db2) that yields the best class separability. A. Phinyomark et. al [2], [3], [9], [11] investigated usefulness of extraction of the EMG features from multiple-level wavelet decomposition of the EMG signal using different levels of various mother wavelets for obtaining the useful resolution components from the EMG signal. They also analyzed the component selection criteria for Optimal EMG resolution component (sub-signal) and Noise and unwanted EMG components. M. B. I. Reaz et al [5], [7], [9] illustrate the various methodologies and algorithms for EMG signal analysis to provide efficient and effective ways of understanding the signal and its nature. They further point up some of the hardware implementations using EMG focusing on applications related to prosthetic hand control, grasp recognition, and human computer interaction. A comparison study is also given to show performance of various EMG signal analysis methods. Optimization of the response of an EMG with surface electrodes, used in patients with foot drop through data processing techniques and pattern recognition methods ((i.e. Principal Component Analysis (PCA) and Neural networks (NN) for classification of measures is presented by Cristhian Manuel Duran Acevedo et. al [6].
The unprocessed signal showing the aggregated MUAPs is called a raw EMG Signal. Raw EMG is well established that the amplitude of the EMG signal is stochastic (random) in nature and can be reasonably represented by a Gaussian distribution function. The amplitude of the signal can range from 0 to 10 mV (peak-to-peak) or 0 to 1.5 mV (RMS). The usable energy of the signal is limited to the 0 to 500 Hz frequency range, with the dominant energy being in the 50-150 Hz range. Usable signals are those with energy above the electrical noise level.
The EMG signals are affected by noise from various sources suchas the following.
All electronic equipment generates electrical noise and it is an Inherent characteristic of semiconductors used in electronics components. This noise has frequency components that range from 0 Hz to several thousand Hz. This noise cannot be completely eliminated; but can be reduced to an acceptable level by using high precision components, intelligent circuit design.
This is caused by the sources of electromagnetic radiation, such as cellular phones, RF broadcasts, electrical switching, fluorescent lamps, etc. In general almost any kind of electronic or electrical device may generate the noise. In present scenarios, it is virtually impossible to avoid this kind of noise because of unavoidable requirements and adaption of these systems everywhere. However, the most of the ambient noise radiation comes from power sources, hence limited to 50 or 60Hz, with the amplitude one to three times greater than the EMG signals.
It is generally caused either by the interface between the detection surface of the electrode and the skin or the movement of the cable connecting the electrode to the amplifier. This kind of noise affects the signals in the band of 0 to 20Hz and can be avoided by proper fitting outline of the electronic hardware.
The amplitude of the EMG signals is inherently quasirandom in nature, especially the frequencies somewhere around 0 and 20 Hz because of the fact that they are influenced by the quasi-random nature of the firing rate of the motor units which, in many cases, fire in this frequency band. Due to the chaotic nature in this frequency band they are considered as undesirable noise and filtered from the EMG signals.
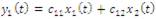
The “standard” ICA algorithm is described in this section. Idea behind the ICA can be simply explained using an example of two separate signal sources x1(t) and x2(t) which was mixed by an unknown linear process. Let the resultant measure be a mixture of both signals and denoted as, y1(t) and y2(t) , then relations amongst the signals can be given as follows:
where c11 , c12 , c21 and c22 are unknown coefficients of linear mixing process. Now the problem is to recover the signal X1(t) and x2(t) from resultant signals y1(t) and y2(t) without any prior information about the original signals x1(t) and x2(t) and the mixing coefficients (c11 , c12 , c21 and c22), although the signals must be statistically independent which is fundamental requirement of the ICA concept.
Although, we have taken only two sources for the simplicity, the presentation can be generalized for n number of sources as follows:

where xi(t) is called signal source, yi(t) is the corresponding mixture signal, cij is the mixing process coefficient between yi(t) and xj(t), and n is the total number of sources and mixture signals. The same thing can be expressed in matrix form as follows:

where Y is the matrix of resultant mixture signals, with each row presenting one mixture signal. X is the matrix of original signals, in which each row represents one original signal; and Cnxn is the transformation matrix of mixing coefficients. As it is already stated that, the feasibility of solving the ICA problem is tightly bounded with the condition that, the sources are statistically independent of each other.
Since the signals are considered statistically independent then, according to the Central Limit Theorem, the sum of independent random variable results a variable with Gaussian distribution. Hence the solution of ICA can be achieved, if the distribution diverges from Gaussian and this deviation can be determined using negentropy (negative entropy).
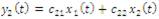
Negentropy is one of the measures of testing non-Gaussian distribution on the basis of entropy, which is the basic representation of information. The Entropy (E) for a discrete random variable can be define as follows:
where vi is the possible values of r vi ∈ r and p (r=vi) presents the probability r to being ci. Similarly, for a continuous E is defined as:
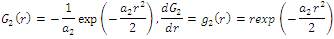
where f is the PDF (Probability Distribution Function). Now the negentropy (j), is defined as:
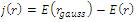
where rgauss is a Gaussian random variable with covariance matrix. However, it is already known that for the same variance, the Gaussian random variable gives the maximum entropy. The value of negentropy is always positive, and it can only be zero if the test variable also follows the Gaussian distribution.
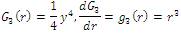
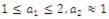
The exact estimation from equation (7) is computationally complex hence an approximation based approach based on the maximum entropy principle is preferred. As presented in equation (8)
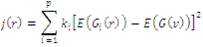
where ki and constants can be set to zero, while v is a zero mean and unit variance Gaussian random variable. Putting these values the equation (8) can be rewritten as:
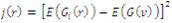
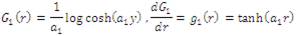
where G is a function and the following formulations for G have been proved very useful in practical applications:
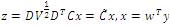
Before applying the fundamental transforming operations of the ICA, it is frequently important to perform some preprocessing. Generally, the two separate operations are directed: centering (or forcing to zero mean) and whitening. Centering obliges that, the random variable is a zero-mean random variable and it is performed by subtracting its mean vector. Whitening will make the random variable r uncorrelated and set their variances equivalent to zero by utilizing the eigen value decomposition of their covariance matrix:

where D presents the eigen vectors and V presents the eigen values. Now, the new random variable after whitening, can be given as:

After whitening, the problem changes from estimating mixing matrix to C as follows:
The essential principle of ICA is to discover a direction to maximize non-gaussianity of x=wT y, which can be calculated by negentropy as given in equation (8) and (9).
The basic procedure of the algorithm.

Normalize the weight vector as,

As it can be seen in Figure 1, the third step of the proposed method is an independent component analyzer designed to find sub-signals decomposition of the EMG as described in section 3. The proposed method utilizes ICA to remove the noisy components. Considering the noisy nature of the typical raw EMG signal in this study, noisy signals due to electrodes capacitance variation at very low frequencies (below 20 Hz) power line interference in fixed frequency (50 or 60 Hz) while other interference at relatively high frequencies (above 60 Hz) of the EMG are filtered using low pass filter, high pass filter, and notch filters respectively. A separate gain control is adapted for each filters because the EMG signals contains some information at these frequency. Also after that, these filtered signals from each filters are combined for the input of ICA algorithm. Moreover, with regard to the inputs fed to the ICA algorithm, in this study, only a single-channel EMG signal is studied. Therefore knowing that ICA requires multichannel signals to process as its input, in order to use ICA to remove noise, one needs to build multichannel signals from the singlechannel EMG.
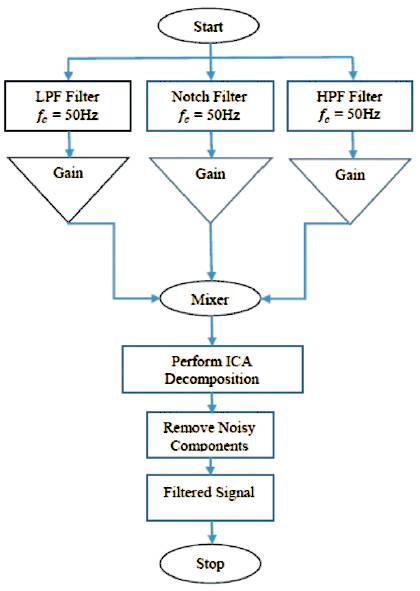
Figure 1. Flow Chart of the Proposed Algorithm
The steps shown in Figure1 are further described below.
Finally the simulation of the presented algorithm is performed using the superficial Electromyography Database (EMG) for analysis in lower limb available at UCI machine learning database repositories. During the simulation, different noises are added synthetically to measure the performance of the proposed technique.
Finally, the results obtained by simulation are presented in graphical and tabular form in Table 1.
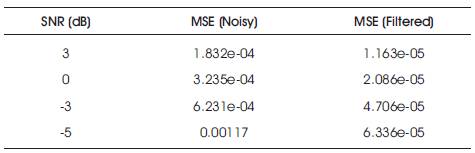
Table 1. Results summary (in terms of mean squared error) for all the cases presented above
Figure 2 shows checking the EMG signal performance of the filter when the signal is corrupted with noise to maintain 3db SNR.
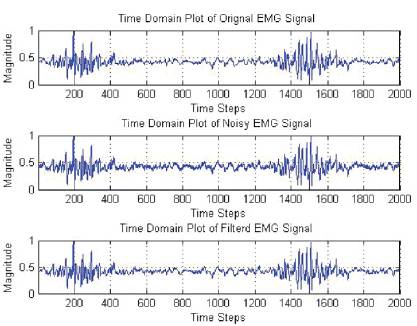
Figure 2. Performance of the filter when signal is corrupted with noise to maintain 3db SNR
Figure 3 shows the EMG signal performance of the filter when the signal is corrupted with noise to maintain 0db SNR.
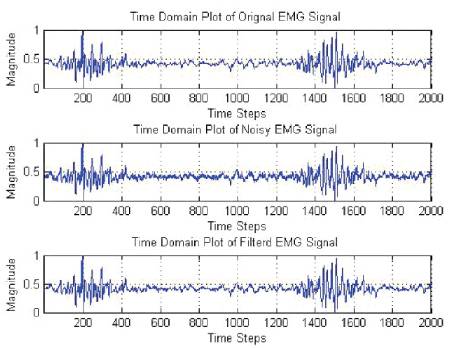
Figure 3. Performance of the filter when signal is corrupted with noise to maintain 0db SNR
Figure 4 checks the EMG signal Performance of the filter, when the signal is corrupted with noise to maintain -3db SNR.
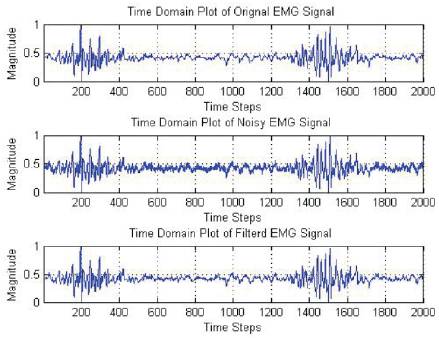
Figure 4. Performance of the filter when signal is corrupted with noise to maintain -3db SNR
Figure 5 explains the EMG signal Performance of the filter, when the signal is corrupted with noise to maintain -5db SNR.
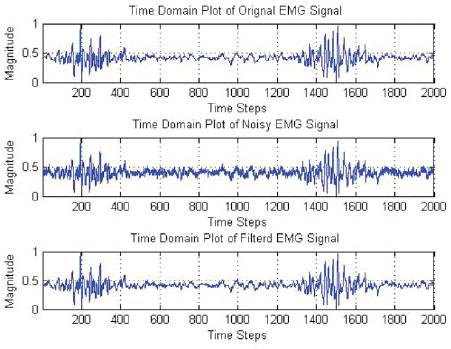
Figure 5. Performance of the filter when signal is corrupted with noise to maintain -5db SNR
The present paper shows a multilevel strategy using ICA to essentially filter the EMG signals without losing the information. The simulation results show that the presented model can efficiently remove the EMG signals noise. The simulation results for the proposed technique gives more adaptability respect to the parameter estimation and choice. Also, the filtering procedure proposed for framing the multichannel signals gives a very adaptable technique to structure the data to ICA. Furthermore, this strategy could present better results for man machine interfaces in biomedical instrumentation. The technique could likewise be utilized for extraction of other characteristics for pathological diagnosis too.