(1)
Presently Electromyography (EMG) signals are widely utilized for clinical/biomedical applications, such as disease prognosis and advanced human machine interface. EMG signals are picked from muscles by invasive process or from surface of skin called surface EMG. Whichever the technique of acquisition, the important point is to extract useful information from the cached signal for understanding and relating the signal with its relative physical and biological aspects. The purpose for this paper is to present analysis of the behavior of EMG signal under different transform domains such as frequency and wavelet domain and to relate the coefficients of these domains with the physical and biological aspects of the signals. Furthermore the authors point out how the unwanted signals such as noise and other interfering signals can be removed using the different transforms. This paper gives specialists a thorough understanding of EMG signals and its investigation methods. This learning can be helpful for creating automated systems for prognosis and man machine interface development.
The EMG signal is the electrical appearance of the neuromuscular actuation associated with a contracting muscle. It is a highly complex signal which is influenced by the anatomical and physiological properties of muscles, the controlling behavior of nervous system, and in addition the qualities of the instrumentation that is utilized to identify and watch it. Presently only a small portion of the connections between the EMG signal and the properties of a contracting muscle have been classified. The absence of a legitimate description of the EMG signal is the main hurdle in the advancement of electromyography for its possibly numerous fields of application .The proper analysis required a noise free signal which creates another problem: EMG signals get mixed with noise while going through distinctive tissues. Also, as regards the EMG identifier, there is a chance that it catches signals from diverse motor units, which always remains higher; thus causing interference and results in impure signals. Once proper calculations and routines for EMG signal investigation are promptly accessible, the nature and qualities of the signal can be appropriately comprehended and applicable usage can be suggested for different EMG signals related applications. Till now many researches and broad attempts have been made in this field for creating better calculations, redesigning existing strategies, enhancing recognition methods to reduce noise and to get precise EMG signals. This paper introduces an organized methodology for translating the data substance of the EMG signal. The numerical model which is created focuses around present information of the properties of contracting human muscles. Then these properties are examined in transformed domain and the degree to which the transformation is done helps in understanding the signal better. The methodology of demonstrating yields a better understanding of the EMG signal.
This section presents the brief review of the related literatures found useful during the preparation of this paper. A Feed-forward Error Back-propagation Artificial Neural Network (FEBANN) and Wavelet Neural Networks (WNN) based classifiers for classification of EMG signals were developed and compared [4][13][10] which show that the WNN-based classifier outperformed the FEBANN counterpart. Angkoon Phinyomark et al [1] [8] presented two novel mean and median frequencies (MMNF and MMDF) for robust feature extraction that tolerate White Gaussian Noise (WGN). As a result, noise removal algorithm is not needed. Farzaneh AkhavanMahdavi et al [2] presented Wavelet Transform (WT) based technique to extract Surface EMG (SEMG) features, considering its consistenly with the nature of EMG as a non-stationary signal. They show an improvement in class separability of hand movements in feature space. Furthermore it has shown features extracted from first and second level of WT decomposition by second order of Daubechies family (db2) which yielded the best class separability. A. Phinyomark et al [3] [9] [11] investigated usefulness of extraction of the EMG features from multiplelevel wavelet decomposition of the EMG signal using different levels of various mother wavelets for obtaining the useful resolution components from the EMG signal. They also analyzed the component selection criteria for Optimal EMG resolution component (sub-signal) and Noise and unwanted EMG components M. B. I. Reaz et al [5][7] illustrates the various methodologies and algorithms for EMG signal analysis to provide efficient and effective ways of understanding the signal and its nature. They further point out some of the hardware implementations using EMG focusing on applications related to prosthetic hand control, grasp recognition, and human computer interaction. A comparitive study is also given to show performance of various EMG signal analysis methods. Optimization of the response of an EMG with surface electrodes, used in patients with foot drop through data processing techniques and pattern recognition methods ((i.e.)) Principal Component Analysis (PCA) and Neural Networks (NN) for classification of measures is presented by Cristhian Manuel Durán Acevedo et al [6][12].
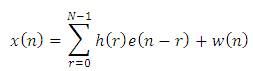
EMG or electromyography is the investigation of electrical signals captured from the muscles. EMG is frequently referred to as myoelectric action. Muscle tissue conducts electrical signals like the way nerves do and the name given to these electrical signals is “muscle activity potential”. Surface EMG or sEMG is a strategy for recording the data exhibited in muscle activity from the skin surface. When distinguishing and recording the EMG signal, there are two primary issues of concern that impact the constancy of the signal. The primary is the Signal to-Noise Ratio (SNR). That is, the proportion of the energy of EMG signals to the energy of noise signals. As a rule, noise is characterized as electrical signals that are not part of the expected EMG signal. The other issue is the improper frequency response which may cause different attenuations or gains for different frequencies. Two sorts of anodes have been utilized to capture the muscle signal: invasive electrodes and non-invasive electrodes. When EMG is obtained from electrodes mounted specifically on the skin, the signal is a composite of all the muscle fiber activity potential occuring in the muscles within the skin. These activities happen at arbitrary interims. So at any moment, the EMG signal may be either a positive or a negative voltage. To reduce these random fluctuations Individual muscle fiber activity potentials are frequently acquired utilizing wire or needle electrodes put straightforwardly in the muscle. The combinations of the muscle fiber activity potentials from all the muscle fibers of a single motor unit is called the Motor Unit Activity Potential (MUAP) which can be captured by a skin surface cathode (non-obtrusive) found close to this field, or by a needle terminal (intrusive) embedded in the muscle (3). Comparison 1 demonstrates a basic model of the EMG signal:
Where x(n) represents the final EMG signal measured at the surface of the skin at the e(n) processing electrode, h(r) overall transfer function of MUAP, w(n) zero mean white Gaussian noise.
The signals detected at the electrodes are firstly amplified using different types of amplifiers, generally operational amplifiers are preferred. After amplifying the signal the next important task is to remove the high and low frequency noises which are simply classified by understanding the expected frequency spectrum of EMG signals.
The nervous system of the human body performs both the controlling and communication between different organs of the body. This system comprises of an extensive number of sensitive associated cells called neurons that speak with diverse parts of the body by using electrical signals, which are quick and particular. The nervous system comprises of three fundamental parts: the mind, the spinal cord and the peripheral nerves. The neurons are the fundamental structural unit of the nervous system and differ significantly depending upon its current applicability. Neurons are special cells that direct and operate on messages and are used as a driving channel for signals within the entire body.
A muscle is made out of groups of particular cells equipped for compression and extraction. The essential necessity of these particular cells is to produce movements, for example, speaking, running or finger movements for writing. Special properties of muscle tissue are electrically controlled extensibility and elasticity. Hence it can be expanded or contracted by electrical signals. Muscle tissue has four key functions: delivering movement, moving substance inside the body, giving stabilization, and maintaining temperature. Three sorts of muscle tissue can be distinguished on the premise of structure, contractile properties, and control components: (i) skeletal muscle, (ii) smooth muscle, and (iii) cardiovascular muscle. The EMG is connected to the investigation of skeletal muscle. The skeletal muscle tissue is joined to the quick and its compression is in charge of supporting and moving the skeleton. The constriction of skeletal muscle is started by impulses generated by the neurons for willful control of muscles. Skeletal muscle fibers are profusely supplied with neurons for its constriction. This specific kind of neuron is known as "motor neuron" and it remains near to muscle tissue, however is not really associated with it. One motor neuron normally supplies incitement to numerous muscle fibers.
The unprocessed signal showing the aggregated MUAPs is called a raw EMG Signal. It is well established that the amplitude of the EMG signal is stochastic (random) in nature and can be reasonably represented by a Gaussian distribution function. The amplitude of the signal can range from 0 to 10 mV (peak-to-peak) or 0 to 1.5 mV (RMS). The usable energy of the signal is limited to the 0 to 500 Hz frequency range, with the dominant energy being in the 50-150 Hz range. Usable signals are those with energyabove the electrical noise level.
During the relaxation of muscle, a pretty much noise free EMG Baseline can be seen. The raw EMG baseline noise relies on numerous components, particularly the nature of the EMG processing amplifier circuit, the environmental noise and the nature of the given recognition system. Considering a proper low noise flat band response amplifier with legitimate skin preparation, the captured noise can be decreased to as low as 3 to 5 micro volts, although it is desirable to reduce it up to 1 to 2 micro volts.
The EMG signals are affected by noise from various sources such as:
Semiconductor Devices Noise:All electronic equipments generate electrical noise and it is an Inherent characteristic of semiconductors used in electronic components. This noise has frequency components that range from 0 Hz to several thousand Hz. This noise cannot be completely eliminated; but can be reduced to acceptable level by using high precision components and intelligent circuit design.
Ambient Noise:This is caused by the sources of electromagnetic radiation, such as cellular phones, RF broadcasts, electrical switching, fluorescent lamps, etc. In general almost any kind of electronic or electrical device may generate noise. In present scenarios it is virtually impossible to avoid this kind of noise because of unavoidable requirements and adaption of these systems everywhere. However the most of the ambient noise radiation comes from power sources hence limited to 50 or 60Hz, with the amplitude one to three times greater than the EMG signals.
Motion Artifacts:It is generally caused either by the interface between the detection surface of the electrode and the skin, or the movement of the cable connecting the electrode to the amplifier. This kind of noise affects the signals in the band of 0 to 20Hzand can be avoided by proper fitting outline of the electronic hardware.
Inherent instability of the signal:The amplitude of the EMG signals is inherently quasirandom in nature, especially the frequencies somewhere around 0 and 20 Hz because of the fact that they are influenced by the quasi-random nature of the firing rate of the motor units which, in many cases, fire in this frequency band. Due to the chaotic nature in this frequency band they are considered as undesirable noise and is hence filtered from the EMG signals.
It is required to get an EMG signal that contains the most accurate measure of data from the raw EMG signal and with minimum influence from electrical noise. Along with these, the amplification of the signal while maintaining signal-to-noise ratio as high as possible is desirable. Following design consideration should be considered for EMG system designing.
Application of Differential Amplifier:Since the noise from the power line could be falsely taken as input signal, the differential amplifier can play an important role. Because of its high Common mode rejection ratio (CMRR), it can attenuate (reject) the power line noise.
Proper impedance matching:The impedance of the measurement circuit when seen from electrode must be very high to avoid loading effect because the skin impedance can reach up to mega ohms, which is easily achievable by operational amplifiers.
Measurement Cable Length:A large cable can easily catch the environmental noises hence it is required to reduce the cable length or the amplifier has to be placed with low output impedance at the electrode to avoid such occurrences.
Filtering:As the authors have discussed in previous section a number of noises have their specific spectrum ranges hence a properly designed filter must be used to filter these noises.
The Fourier transform is a technique used to decompose the given signal in terms of sinusoids of different frequencies. Fourier analysis was originally concerned with representing and analyzing periodic phenomena, via Fourier series, and later extending those insights to non periodic phenomena, via the Fourier transform. In fact, one way of getting from Fourier series to the Fourier transform is to consider non-periodic phenomena (and thus just about any general function) as a limiting case of periodic phenomena as the period tends to infinity. A discrete set of frequencies in the periodic case becomes a continuum of frequencies in the non-periodic case.
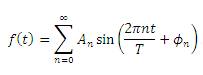
The idea behind the Fourier can be simply presented by equation (2), where f(t) is a periodic function with period T.
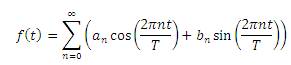
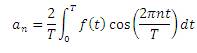
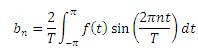
This may be converted to the well-known forms

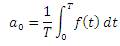
Now separating the average value a0 of signal or n=0
The same equation in terms of exponential representation
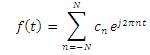
Where
The above form of Fourier is called Fourier series representation and used for only periodic signals. However this can be extended for non-periodic signals as well and then it is called Fourier transform as shown is equation (9)
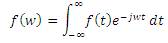
Here f(w) represents the frequency coefficients like an and bn in Fourier series but f(w) is a continuous function.
The authors have discussed Fourier series or transform, which can represent a signal in terms of sinusoids. Now if we change the type of signals to discrete as always happens when processed digitally a further modified version can be presented which can also work with discrete signal samples using digital processors and it is known as DFT (Discrete Fourier Transform) and calculated by the computationally efficient technique called FFT (Fast Fourier Transform). The DFT of discrete signal x[n] can be calculated as
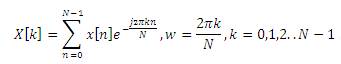
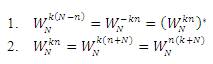
The equation (10) shows that the direct method of computing the DFT coefficients has a complexity of complex multiplications and N(N-1) complex additions. By decomposing the original N-point DFT into successively smaller DFTs (a divide-and-conquer approach), the amount of computations can be dramatically reduced. In this process, for the properties of the complex exponential function

the following properties can be applied
the following properties can be applied
The DFT when considering these properties can reduce its complexity from O(n2) to o(Niogn) hence this method is known as Fast Fourier Transform (FFT).
A wavelet is a signal that contains wave-like oscillation with amplitude that begins at zero, increases, and then decreases back to zero and the wavelet transform is a transforming method which utilizes the properties of these signals. The wavelet transform is like the Fourier transform (or significantly more to the windowed Fourier transform or short term Fourier transform) with a totally distinctive basis function. The principal differences between these two are: Fourier transform disintegrates the signal into sine's and cosines, i.e. the transforms confined in frequency domain only; in opposite the wavelet transform uses basis functions such that the transform shows both the time and frequency domain. Generally, the wavelet transform is presented by following mathematical expression:
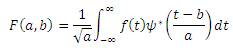
Where * represents the complex conjugate of ψ. Here ψ represents the basis wavelet or mother wavelet function, while a is called scaling and b is called time or translation. From  the two useful properties of wavelet function can be explained. It has a possible time shifting by using variable b while the frequency variation can be performed by a hence we can get the frequency information at any specific time also which is not possible with Fourier transform.
There are many basic wavelet function are available such as Haar, Daubechies, Morlet, etc.
The Discrete Wavelet Transform (DWT) is a specialized kind of wavelet transform utilizing a discrete set of the wavelet scales and translations complying with some characterized principles. As it were, this transform decomposes the signal into orthogonal set of wavelets, which is the principal contrast from the Consistent Wavelet Transform (CWT), and its execution for the Discrete Time arrangement at times called Discrete-Time Continuous Wavelet Transform (DT-CWT). The wavelet can be developed from a scaling function which depicts its scaling properties. The limitation is that the scaling function must be orthogonal to its discrete interpretations and should fulfill some numerical conditions.
Discrete Wavelet Transforms (DWT), which transforms a discrete time signal to a discrete wavelet representation. It converts an input series x0 , x1 .....xm , into one high-pass wavelet coefficient series and one low-pass wavelet coefficient series (of length n/2 each) given by:
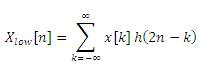
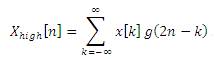
Where h(z) and g(z) are called wavelet filters (low pass and high pass respectively). This decomposition has halved the time resolution since only half of each filter output characterizes the signal. However, each output has half the frequency band of the input so the frequency resolution has been doubled. In practice, such transformation will be applied recursively on the low-pass series until the desired number of iterations is reached.
For the comparison of both the transform for analysis of EMG signals, both the transforms are applied to the data samples of Surface Electromyography (SEMG) for lower limb analysis taken from UCI Machine Learning Repository. Firstly the transform is applied to whole observation period for normal and abnormal persons. After that each section is separately analyzed to compare the response of both the transforms.
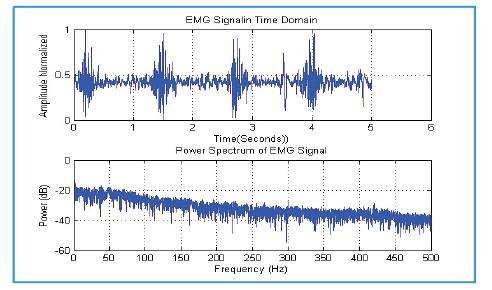
Figure 1. Time Domain and Frequency Domain Representation of EMG Signal for Normal Person taken from electrode mounted on teardrop muscle in relation with the knee movements while the person is marching.
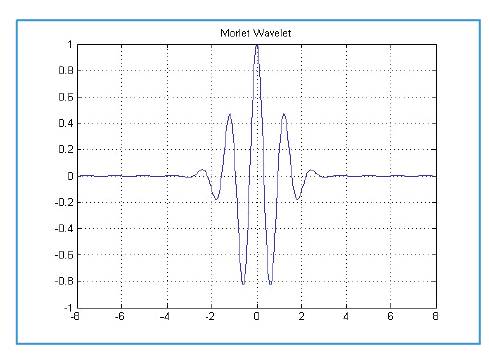
Figure 2. Morlet Wavelet Plot (approximated by 10 iteration)
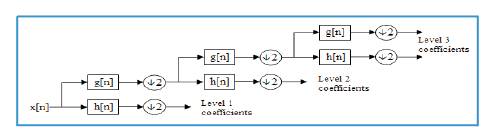
Figure 3. DWT Cascaded Decomposition Procedure
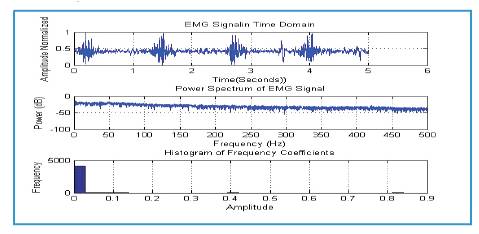
Figure 4. Time Domain and Frequency Domain Representation (with histogram) of EMG Signal for Normal subject (person) taken from electrode mounted on teardrop muscle in relation with the knee movements while the person is marching.
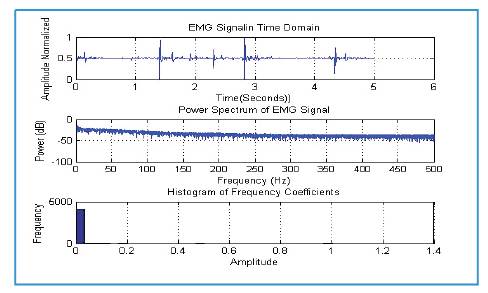
Figure 5. Time Domain and Frequency Domain Representation (with histogram) of EMG Signal for Abnormal Person (having history of abnormality in the knee) taken from electrode mounted on teardrop muscle in relation with the knee movements while the person is marching
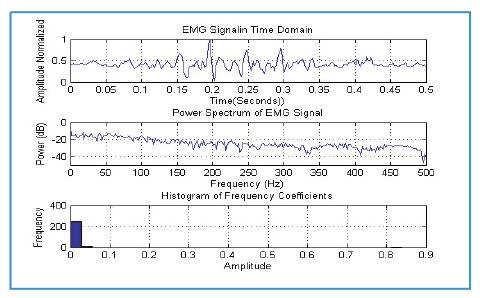
Figure 6. Same signal which is taken in figure 3 but only during the activity of muscle
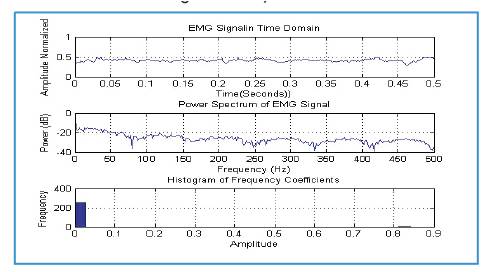
Figure 7. Same signal which is taken in figure 4 but only during the activity of muscle.
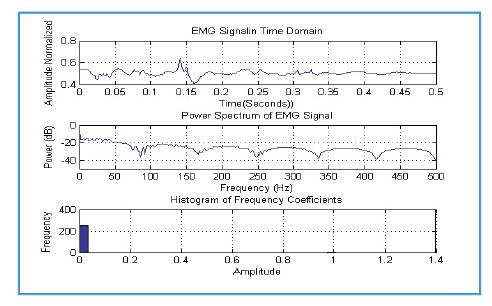
Figure 8. Same signal which is taken in figure 3 but only during the relaxation of muscle.
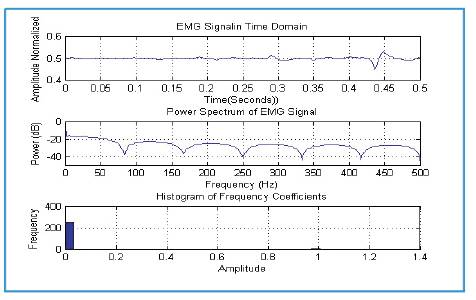
Figure 9. Same signal which is taken in figure 4 but only during the relaxation of muscle.
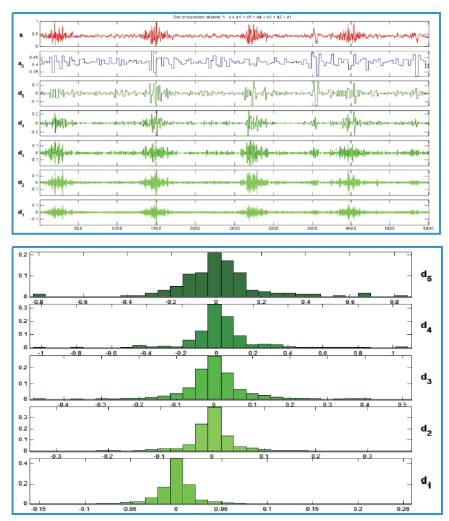
Figure 10. Time Domain and Wavelet Domain Representation (five level decomposition with Haar wavelet) of EMG Signal for Normal Person taken from electrode mounted on teardrop muscle in relation with the knee movements while the person is marching
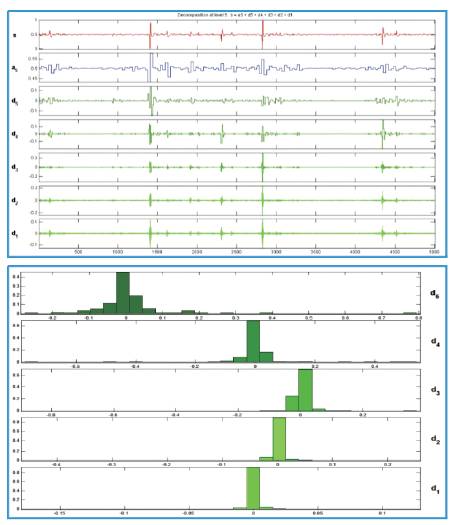
Figure 11. Time Domain and Wavelet Domain Representation (five level decomposition with Haar wavelet) of EMG Signal for Abnormal Person (having history of abnormality in the knee) taken from electrode mounted on teardrop muscle in relation with the knee movements while the person is marching
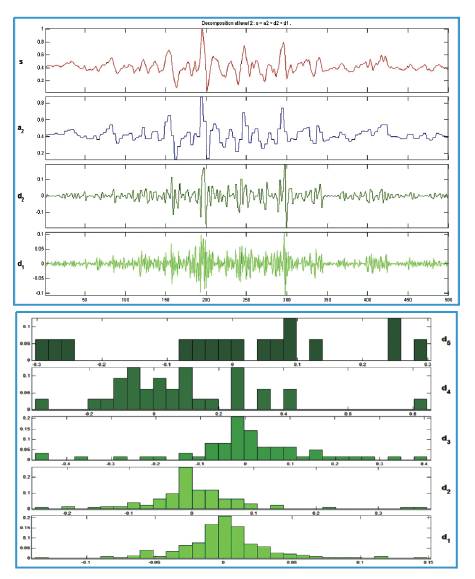
Figure 12. Two level wavelet decomposition of the signal shown in figure 3 but only during the activity of muscle
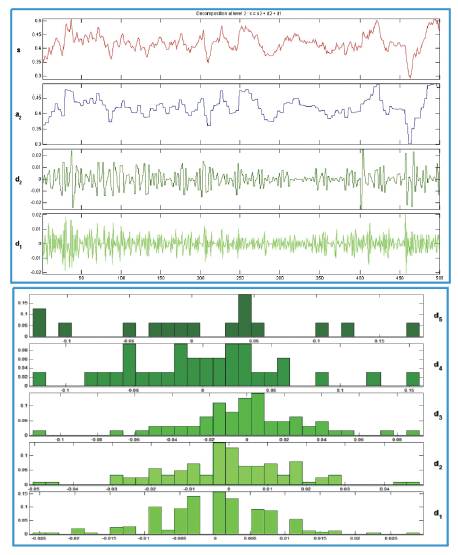
Figure 13. Two level wavelet decomposition of the signal shown in figure 3 but only during the relaxation of muscle
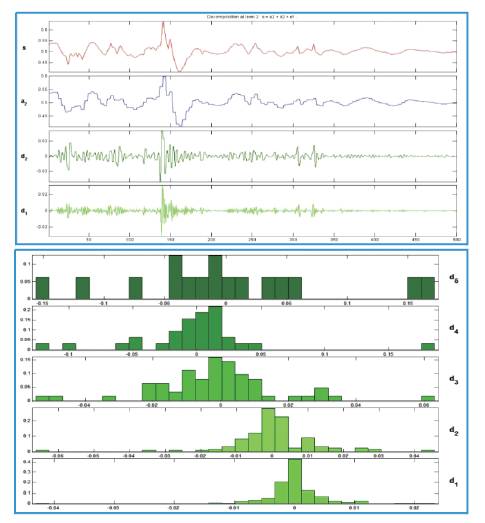
Figure 14. Two level wavelet decomposition of the signal shown in figure 4 but only during the activity of muscle
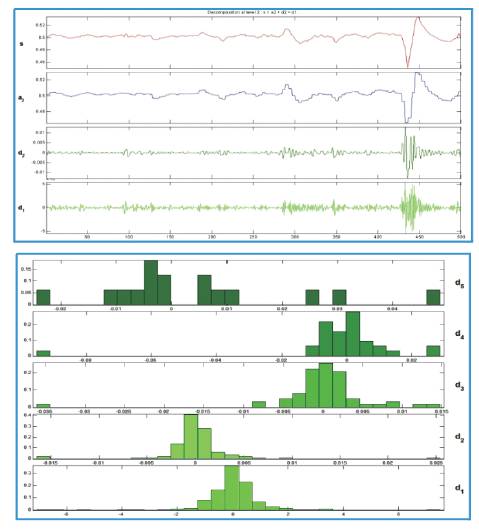
Figure 15. Two level wavelet decomposition of the signal shown in figure 4 but only during the relaxation of muscle
Firstly for the Fourier transform the significant Fourier coefficients variation at the lower frequencies can be seen between the normal and abnormal persons (Figures 5 and 6). However the response of abnormal persons during relaxation closely matches to same persons response during activity (Figures 6 and 8), this is also reflected by the statistical information shown in histogram; on the other hand wavelet transforms decomposes the signal characteristics at different scales efficiently. As Figure 9 shows the level level d collects the noises in the data, while the s contains the major variations of the signal. Looking at the histogram, it shows that the coefficients contain so much information at every decomposition which can be used for very complex understanding and analysis of the signal. The extract details also makes wavelet a practically useable one for the classification of a large number of movements classification. Finally the authors conclude that the wavelet is a much better choice for EMG signal analysis and it can helps in proper filtration of noise as well as characterization and classification of EMG signals.