(1)
In this paper, Efficient least mean squares, Normalized least mean squares and Sign least mean squares algorithm are proposed for removing artifacts preserving the low frequency components and tiny features of the ECG. The proposed implementations are suitable for applications requiring large signal to noise ratios with fast convergence rate. The sign least mean squares algorithm, being the solution of the steepest descent strategy for minimizing the mean squared error in a complete signal occurrence, is shown to be steady-state unbiased and with a lower variance than the LMS and NLMS algorithm. Finally, we have applied this algorithm on ECG signals and compared its performance with the LMS and NLMS algorithms. The results show that the performance of the sign least mean squares algorithm is superior to the LMS and NLMS algorithms.
The extraction of high-resolution ECG signals from recordings contaminated with background noise is an important issue to investigate. The goal for ECG signal enhancement is to separate the valid signal components from the undesired artifacts, so as to present an ECG that facilitates easy and accurate interpretation. Many approaches have been reported in the literature to address ECG enhancement using adaptive filters [1], which permit to detect time varying potentials and to track the dynamic variations of the signals. In [2], Thakor et al. proposed an LMS based adaptive recurrent filter to acquire the impulse response of normal QRS complexes, and then applied it for arrhythmia detection in ambulatory ECG recordings. The reference inputs to the LMS algorithm are deterministic functions and are defined by a periodically extended, truncated set of orthonormal basis functions. In these papers, the LMS algorithm operates on an instantaneous basis such that the weight vector is updated every new sample within the occurrence, based on an instantaneous gradient estimate. There are certain clinical applications of ECG signal processing that require adaptive filters with large number of taps. In this paper, we present SLMS, LMS and NLMS algorithms to remove the artifacts from ECG. Among all these algorithms, SLMS enjoys less computational complexity and good filtering capability. To study the performance of the proposed algorithm to effectively remove the noise from the ECG signal, we carried out simulations on MIT BIH database for different artifacts. The simulation results show that the proposed algorithm performs better than the LMS counterpart to eliminate the noise from ECG.
The Least Mean Squares (LMS) algorithms adjust the filter coefficients to minimize the cost function. Compared to Recursive Least Squares (RLS) algorithms, the LMS algorithms do not involve any matrix operations. Therefore, the LMS algorithms require fewer computational resources and memory than the RLS algorithms. The implementation of the LMS algorithms also is less complicated than the RLS algorithms. However, the Eigen value spread of the input correlation matrix, or the correlation matrix of the input signal, might affect the convergence speed of the resulting adaptive filter.
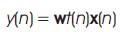
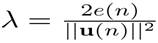
In order to remove the noise from the ECG signal, the ECG signal s1(n) with additive noise p1(n) is applied as the desired response d(n) for the adaptive filter shown in Figure 1. If the noise signal p2(n), possibly recorded from another generator of noise that is correlated in some way with p1(n) is applied at the input of the filter, i.e., x(n) = p2(n), the filter error becomes e(n) = [s1(n) + p1(n)] − y(n). The filter output y (n) is given by
Since the signal and noise are uncorrelated, the Mean- Squared Error (MSE) is

Minimizing the MSE results in a filter output that is the best least-squares estimate of the signal s1 (n).
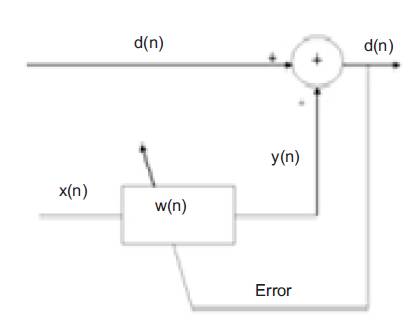
Figure 1. Adaptive filter structure
The standard LMS algorithm performs the following operations to update the coefficients of an adaptive filter:

where μ is the step size of the adaptive filter,  is the filter coefficients vector, and
  is the filter input vector. which is derived from SD as an approximation

where the step size is originally considered for a deterministic gradient.The LMS algorithm suffers from gradient noise due to its random nature. And also above update is problematic due to the noise.
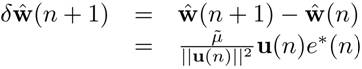
The normalized LMS (NLMS) algorithm shown in Figure 2 is a modified form of the standard LMS algorithm. The NLMS algorithm updates the coefficients of an adaptive filter by using the following equation

We also can rewrite the above equation to the following equation:

Where

In the previous equation, the NLMS algorithm becomes the same as the standard LMS algorithm except that the NLMS algorithm has a time-varying step size μ(n). This step size can improve the convergence speed of the adaptive filter. We have seen that LMS algorithm optimises the H∞ criterion instead of MSE.Similarly, NLMS optimises another problem. From one iteration to the next, the weight vector of an adaptive filter should be changed in a minimal manner, subject to a constraint imposed on the updated filter's output. Mathematically
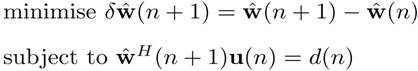
which can be optimised by the method Lagrange multipliers
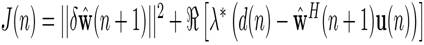


 set to zero to find
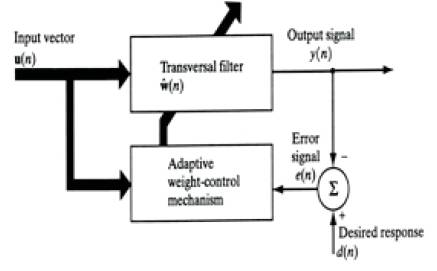
Figure 2. NLMS algorithm
Some adaptive filter applications require you to implement adaptive filter algorithms on hardware targets, such as Digital Signal Processing (DSP) devices, FPGA targets, and Application-Specific Integrated Circuits (ASICs). These targets require a simplified version of the standard LMS algorithm. The sign function, as defined by the following equation, can simplify the standard LMS algorithm
Applying the sign function to the standard LMS algorithm returns the following three types of sign LMS algorithms.
Notice that when e(n) is zero, this algorithm does not involve multiplication operations. When e(n) is not zero, this algorithm involves only one multiplication operation.

 . This algorithm updates the coefficients of an adaptive filter using the following equation: is zero, this algorithm does not involve multiplication operations. When is not zero, this algorithm involves only one multiplication operation.. This algorithm updates the coefficients of an adaptive filter using the following equation:
Notice that when either e(n) or is zero, this algorithm does not involve multiplication operations. When neither e(n) or is zero, this algorithm involves only one multiplication operation. The sign LMS algorithms involve fewer multiplication operations than other algorithms. When the step size μ equals a power of 2, the sign LMS algorithms can replace the multiplication operations with shift operations. In this situation, these algorithms have only shift and addition operations. Compared to the standard LMS algorithm, the sign LMS algorithm has a slower convergence speed and a greater steady state error.
Electrocardiograph (ECG) artifacts are disturbances on ECG which is a measurement of cardiac potentials on the body surface. As a result of artifacts, normal components of the ECG can be distorted. The word artifact is similar to artificial in the sense that it is often used to indicate something that is not natural (i.e. man-made). In electrocardiography, an ECG artifact is used to indicate something that is not "heart-made." These include (but are not limited to) electrical interference by outside sources, electrical noise from elsewhere in the body, poor contact, and machine malfunction. Artifacts are extremely common, and knowledge of them is necessary to prevent misinterpretation of a heart's Rhythm [5].
To show that SLMS algorithm is really effective in clinical situations, the method has been validated using several ECG recordings corrupted with all four noises which are found in ECG signals, individually. We used the pure ECG wave, which is generated by MATLAB, as the reference for our work and real noise is obtained from MIT-BIH noise stress test database. The recordings were digitized at 2000 samples per second. For evaluating the performance of the proposed adaptive filter, we have measured the SNR improvement and compared the SNR improvements of all the four noise corrupted ECG signals filtered by SLMS ,NLMS & LMS algorithm, as shown in Table 1. For all the figures, number of samples is taken on x-axis and amplitude on y axis, unless stated. The difference signal after filtering is shown for BW, MA, PLI and EM .Cross correlation graphs between (i)pure ECG wave & noisy ECG & (ii) pure ECG wave & filtered ECG are shown for PLI corrupted noise due to space constraint. Also, Power Spectral Density curves for pure ECG, PLI corrupted ECG wave and filtered ECG wave with PLI using all three algorithms have been shown here due to space constraints.

Table 1. Comparative table of three algorithms of adaptive filter showing SNR improvements in ECG signals corrupted by different artifacts
In this experiment, first we collected samples of the pure ECG signal from the MIT-BIH arrhythmia database (data105) and it is corrupted with real Baseline Wander (BW) taken from the MIT-BIH noise stress test database. The contaminated ECG signal is applied as primary input to the adaptive filter.
The real BW is given as reference signal. The adaptive filter was implemented using the LMS SLMS and NLMS algorithms to study the relative performance and results are plotted in Figure 3
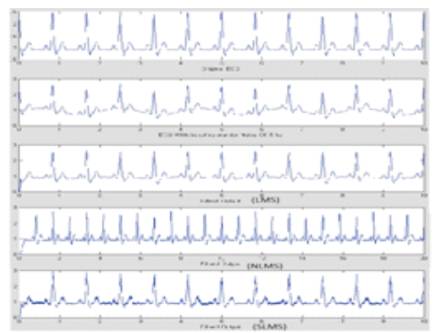
Figure 3. Comparative filtered outputs of BW added ECG (a) Pure ECG (b)Noisy ECG (c)LMS filtered output (d)NLMS filtered output (e)SLMS filtered output
To show the filtering performance in the presence of nonstationary noise, real Muscle Artifact (MA) was taken from the Phsyco net database Noise Stress Test Database. The MA originally had a sampling frequency of 200 Hz .The original ECG signal with MA is given as input to the adaptive filter. MA is given as reference signal. The output from the filter is noise free signal. The adaptive filter was implemented using the LMS SLMS and NLMS algorithms to study the relative performance and results are plotted in Figure 4.
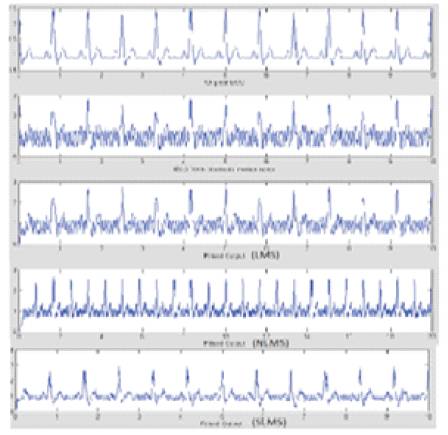
Figure 4. Comparative filtered outputs of MA added ECG (a) Pure ECG (b)Noisy ECG (c)LMS filtered output (d)NLMS filtered output (e)SLMS filtered output
To demonstrate Power Line Interference (PLI) cancelation we have chosen the input to the filter as an ECG signal which is corrupted with synthetic PLI with amplitude 0.2 mV and frequency 50Hz, sampled at 200Hz. The reference signal is synthesized PLI, the output of the filter is recovered signal i.e. the filtered output. These results show the pure ECG,noisy ECG & filtered ECG waveforms by using all the algorithms i.e. LMS, SLMS & NLMS. From the power spectrum, it is clear that the adaptive filter based on SLMS algorithm filters the PLI efficiently as shown in Figure 5.
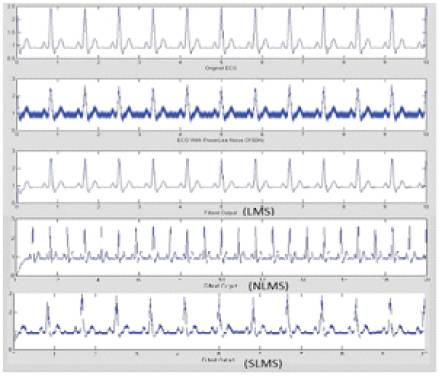
Figure 5. Comparative filtered outputs of PLI added ECG (a) Pure ECG (b)Noisy ECG (c)LMS filtered output (d) NLMS filtered output (e)SLMS filtered output
To demonstrate this, we used MIT-BIH record number 105 ECG data with electrode motion artifact (EM) added, where EM is taken from MIT-BIH NSTDB. The ECG signal corresponding to record 105 which was corrupted with EM was given as input to the adaptive filter. The EM noise was given as reference signal. Output of the filter is the required high resolution ECG signal. The adaptive filter was implemented using the LMS SLMS and NLMS algorithms to study the relative performance and results are plotted in Figure 6.
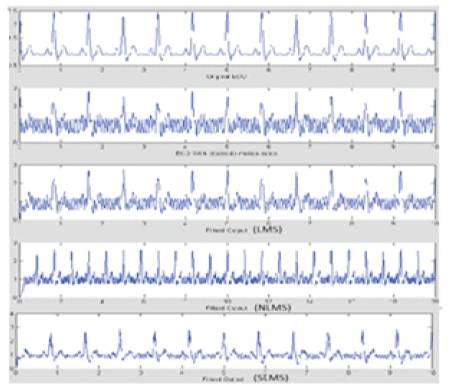
Figure 6. Comparative filtered outputs of EM added ECG (a) Pure ECG (b)Noisy ECG (c)LMS filtered output (d) NLMS filtered output (e)SLMS filtered output
Signal to Noise Ratio can be defined as the ratio of the signal power to that of noise power. Here in our paper, we are calculating Signal to Noise Ratio of pure ECG signal to that of noisy ECG signal which includes noisy ECG signal affected by power line interference, electrode motion, and base line wander and muscle artifacts which is shown in Table 1.
According to the SNR calculation obtained, we come to the conclusion about which algorithm among the three algorithms of the adaptive filtering produces best SNR improvement.
In signal processing, cross-correlation is a measure of the similarity of two waveforms as a function of a time-lag applied to one of them. This is also known as a sliding dot product or inner-product. It is commonly used to search a long duration signal for a shorter, known feature. It also has applications in pattern recognition, single particle analysis, electron tomography averaging, cryptanalysis, and neurophysiology. The cross-correlation is similar in nature to the convolution of two functions. Whereas convolution involves reversing a signal, then shifting it and multiplying by another signal, correlation only involves shifting it and multiplying (no reversing). Here, cross correlation of only 10 samples is only shown here in the diagram below. Cross correlation between (a) noisy ECG and Pure ECG and (b) Pure ECG and filtered ECG has been shown in Figure 7, for LMS, Figure 8, for NLMS and Figure 9, for SLMS.
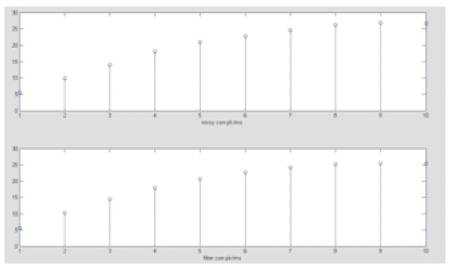
Figure 7. Correlation between (a) Pure ECG and noisy ECG. (b) Pure and filtered ECG using LMS algorithm
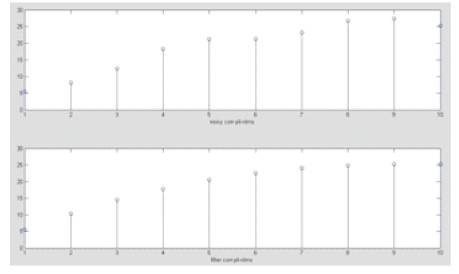
Figure 8. Correlation between (a) Pure ECG and noisy ECG. (b) Pure and filtered ECG using NLMS algorithm
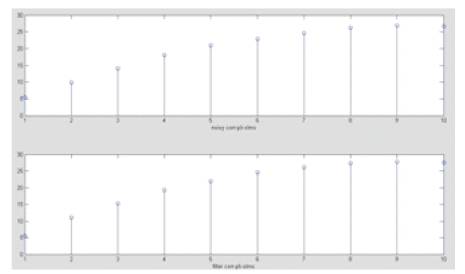
Figure 9. Correlation between (a) Pure ECG and noisy ECG. (b) Pure and filtered ECG using SLMS algorithm
In statistical Signal Processing and Physics, the spectral density, Power Spectral Density (PSD), or Energy Spectral Density (ESD), is a positive real function of a frequency variable associated with a stationary stochastic process, or a deterministic function of time, which has dimensions of power per Hz, or energy per Hz. It is often called simply the spectrum of the signal. Intuitively, the spectral density captures the frequency content of a stochastic process and helps identify periodicities. In Physics, the signal is usually a wave, such as an electromagnetic wave, random vibration, or an acoustic wave. The spectral density of the wave, when multiplied by an appropriate factor, will give the power carried by the wave, per unit frequency, known as the Power Spectral Density (PSD) of the signal. Power spectral density is commonly expressed in Watts per Hertz (W/Hz) or dBm/Hz. For voltage signals, it is customary to use units of V2Hz−1 for PSD and V2sHz−1 for ESD. For random vibration analysis, units of g2Hz−1 are sometimes used for acceleration spectral density.
Although it is not necessary to assign physical dimensions to the signal or its argument, in the following discussion, the terms used will assume that the signal varies in time. the Power Spectral Density (PSD) describes how the power of a signal or time series is distributed with frequency. Here power can be the actual physical power, or more often, for convenience with abstract signals, can be defined as the squared value of the signal, that is, as the actual power dissipated in a load, if the signal were a voltage applied to it. This instantaneous power (the mean or expected value of which is the average power) is then given by P (t) = s (t) for a signal s (t).
Since a signal with nonzero average power is not square integral, the Fourier transforms do not exist in this case. The formula used for power spectral density calculation is
Where Sf (w) is a function that would give us some indication of the relative power contributions at various frequencies. Power Spectral Density between (a) noisy ECG and Pure ECG and (b) Pure ECG and filtered ECG has been shown in Figure 10, for LMS, Figure 11, for NLMS and Figure 12, for SLMS.
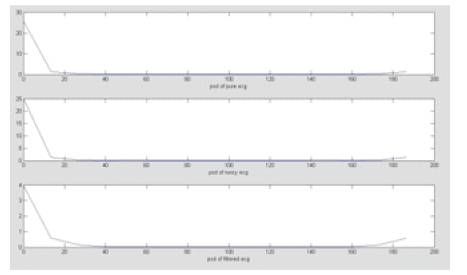
Figure 10. Showing Power Spectral Density of (a) Pure ECG (b) Noisy ECG (c) Filtered ECG using LMS algorithm.
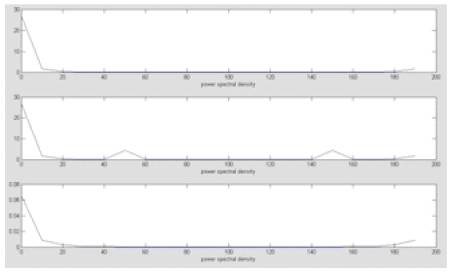
Figure 11. Showing Power Spectral Density of (a) Pure ECG (b) Noisy ECG (c) Filtered ECG using NLMS algorithm
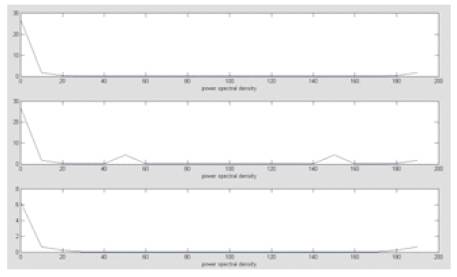
Figure 12. Showing Power Spectral Density of (a) Pure ECG (b) Noisy ECG (c) Filtered ECG Using SLMS algorithm
In this paper, the process of noise removal from ECG signal using SLMS based adaptive filter is presented. For this, the input and the desired response signals are properly chosen in such a way that the filter output is the best least squared estimate of the original ECG signal. The proposed treatment exploits the modifications in the weight update formula and thus pushes up the speed over the respective LMS based realizations. Our simulations, however, confirm that the SNR of the SLMS algorithm is better than that of LMS and NLMS algorithms. Also, the convergence rate is faster than LMS and NLMS algorithms.