(1)
In co-operative spectrum sensing system, secondary users co-operate among themselves, improving the cognitive radio spectrum sensing performance. The presence of two or more malicious user in the secondary users severely degrades the performance of the cognitive radio spectrum sensing system. In this paper, the author have studied the detection and elimination of the malicious users in a co-operative spectrum sensing system using clustering technique namely k-mean clustering and compared its performance with Dixon's outlier test and box plot test. The performance of the system with different outlier tests is shown by plotting the receiver operating characteristics curves. From this we can show that cluster removal method outperforms the Dixon's outlier test and box plot test for the case of two or three malicious users in a co-operative spectrum sensing system for cognitive radio network.
According to a survey conducted by the Federal Communication Commission (FCC) [1], most of the allocated spectrum is underutilized which leads to reduced efficiency in spectrum utilisation. To improve efficiency of usage of allocated spectrum, cognitive radio based on Software Defined Radio (SDR) allows opportunistic usage of licensed frequency bands by secondary users without causing any interference to the licensed user[11], thus increasing the efficiency of spectrum utilization called Dynamic Spectrum Access (DSA). Cognitive radio relies on efficient spectrum sensing to detect the presence of vacant spectrum bands called white space.
In single unlicensed or secondary user spectrum sensing Cognitive Radio (CR) system spectrum sensing performance may degrade due to various effects like fading, shadowing, and due to hidden terminal problems. To overcome these problems we are going for Cooperative Spectrum Sensing (CSS), which contains more than one unlicensed user or secondary user. These secondary users involve in exchange of local sensing decisions using an centralised or decentralised fusion centre to arrive at a final decision regarding the presence or absence of primary user [7]. However, collaboration between multiple secondary users also raises a number of security risks. One of the main security issues is the Spectrum Sensing Data Falsification (SSDF) attack, where the malicious secondary user or attacker purposely report false local sensing report to other secondary users and there by reduces the efficiency of the fusion centre to make a correct decision. In other cases like malfunctioning of the honest secondary user, it unwillingly reports incorrect local sensing report to fusion centre, there by reducing the performance of the total CR system.
To make the Cooperative Spectrum Sensing robust against such deceitful local spectrum sensing results reported by malicious SU or attacker and malfunctioning of SU, we need an robust outlier detection scheme for Cooperative Spectrum Sensing.
In [12], Weighted Sequential Probability Ratio Test (WSRPT) is used to identify the malfunctioning of malicious terminal based on reputation rating assigned to every cooperating terminal. In [13], authors compute the suspicious level of secondary users based on their past sensing reports. Trust values and consistence values of cooperating secondary users are calculated which are then used to eliminate the influence of malicious user on the detection of primary user in the given spectrum band. In Several outlier detection methods for low SNR case are compared. In this paper, the authors have proposed a new outlier detection method based on k-mean clustering [2] to detect the presence of two or more malicious user. We have compared the same outlier detection scheme with Dixon's outlier test and box plot test.
We have considered a system model similar to that of [3] in their model. We have N secondary users cooperating among themselves to detect the presence and absence of single primary user. For sensing presence and absence of PU in the given spectrum, secondary users employ energy detection method. They report their local received signal strength to the fusion centre through a specified error free control channel.
Let P0 and P1 are the cases representing the absence and presence of primary users respectively in a given spectrum band. We denote energy received by the nth secondary user in decibels during kth sensing iteration by en[k].
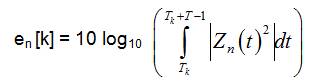
Under hypothesis P0 , en[k] is given by
While under hypothesis P1 , en[k] is given by
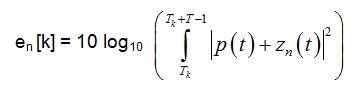
Where T represents the length of the sensing interval, Tk represents the time when kth time interval begins. P(t) represents the primary user signal and zn(t) represents the Additive White Gaussian Noise (AWGN) received by nth user.
Here we have mainly considered two types of Spectrum sensing data falsification attack models presented by malicious secondary users, namely, Always HIGH attacks, Always LOW attacks [9]. In always HIGH attack, the malicious SU always reports higher received local sensing energy to the fusion centre in order to make believe other cooperating secondary users that the primary user is present in the spectrum band. The main motive of this type of attacks is self centred and so called as selfish SSDF attack [10]. This model of attacks results in increase in false alarm probability. In always LOW attacks, malicious user always reports lower received sensing energy to the fusion centre suggesting that the primary user is absent so that SUs start using corresponding channel. The intention of this kind of attacking model is to cause interference to the primary user and it is known as interference SSDF attacks.
Clustering is a method used for partitioning the large data set into sub classes of sets with more meaning, called clusters. Clustering helps us to understand the variations or natural structure of the given large data set. Clustering is used as a unique tool to get a thorough idea regarding data distributions, data compression and outlier detector of large data sets.
Thus we are using clustering algorithms for outlier detection. For detecting outliers their are different clustering techniques. Among those techniques, there are using kmean clustering algorithm. K-means [2] is a well known partitioning method, whose cluster membership is estimated by calculating the centroid for each sub cluster and assigning each object to the sub cluster with the closest centroid. This method decreases the overall within cluster dispersion by iterative reallocation of cluster numbers.
Here, pseudo code for the k-mean algorithm is calculated by
Here the clustering is applied to all the local sensing reports obtained through energy detection, and after applying kmean clustering and after clustering, we remove the cluster with lower number of data points which are outliers. Thus the remaining data points are taken for making final decision taken at fusion centre. This clustering analysis is applied for always HIGH attack model and always LOW attacking models.
For the purpose of simulation, we have taken N=20 cooperative SUs. We assume Additive White Gaussian Noise (AWGN) channel. Also primary user signal is assumed to be BPSK modulated. At fusion centre, energy values received from all the sensors are combined by averaging and it is then compared to the threshold value as follows:
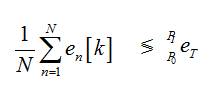
Where eT is the threshold used at fusion centre.
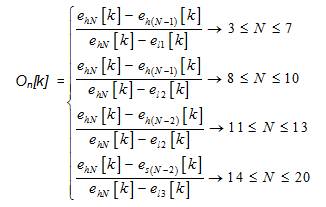
Outlier factor is a measure of deviation of a data point from the remaining amount of data. In outlier detection techniques, outlier factors are used in order to find the presence of malicious users in the cooperative spectrum sensing (CSS) system. Each secondary user in the cooperative spectrum sensing system is assigned a set of outlier factor from its local energy detection based spectrum sensing. In this outlier test the data values are arranged in ascending order and outlier factor on[k] for nth user for kth sensing iteration is calculated as follows[4]:
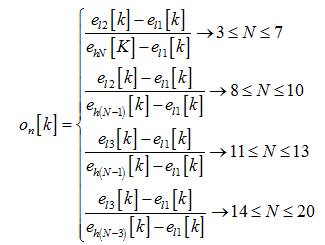
Where

The value of On[k], practical outlier factor obtained from equations (4) and (5) are then compared with critical value Q which depends on N and the significance level. Critical values can be obtained from standard table [5] available from Dixon's test. If the practically calculated outlier factor On[k] is less than the critical value Q for a given significance level, then the energy level under evaluation is assumed to belong to the same normal population as the remaining values. This is also known as null hypothesis [6]. On the other hand, if the practically calculated outlier factor On[k] is greater than the critical value Q for a given significance level, then the energy level under evaluation is assumed to be from an outlier. This is also known as the alternate hypothesis. Equation (3) is used for calculating the outlier factor On[k] when the attracter follows always HIGH type of attacking mode. On the other hand, equation (4) is used for calculating the outlier factor On[k] when the attracter follows always LOW type of attacking mode. Dixon's test can detect at most a single outlier from a set of data points and for two or three outliers its performance degrades.
In box plot method, data is arranged in ascending order. Here the data is energy values received from local sensing reports in decibels (dB). Then lower and higher thresholds are calculated as follows
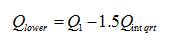
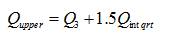
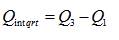
Where Q lower and Qupper are the lower threshold and the upper threshold values respectively. Q1 is the first quartile range and Q3 is the third quartile range. Here in this method [8] we are having an uncertainty about the appropriate selection of the multiplier that is used.
Figure 1 represents the receiver operating characteristics (ROC) curve for always HIGH attack model used by malicious user, which always reports 20dB higher than that of the normal user. It can be seen that the k-mean cluster reduction technique out performs the Dixon's outlier test and the box plot test. Probability of detection for k-mean cluster reduction, box plot test and Dixon's test is 0.9018, 0.8644 and 0.8525 respectively at given fixed probability of false alarm of 0.1. Here the box plot test performance increases very sharply when compared to system having only one malicious user. Since it detects 3-4 attackers at a time, which was a disadvantage in case of single attacker model.
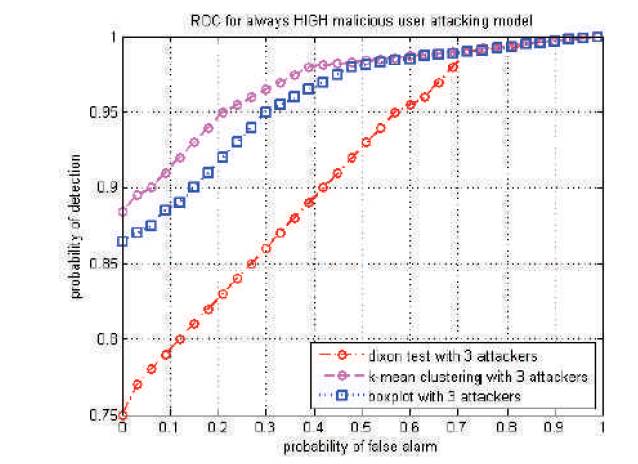
Figure 1. Probability of detection versus probability of false alarm for average normal SNR=0 dB for always HIGH attack model
Figure 2 shows the receiver operating characteristics curve performance for the attacker model of always LOW attacks. Here the attacker always reports the local received sensing energy lower than 29dB when compared to that of the honest users or normal users. Here again the k-means cluster reduction technique out performs the remaining two methods, box plot test and Dixon's test.
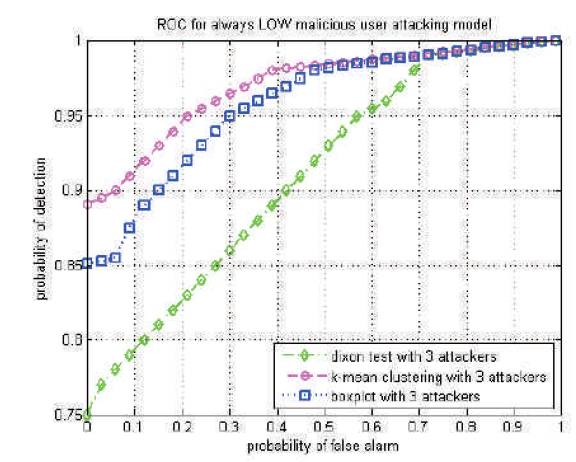
Figure 2. Probability of detection versus probability of false alarm for average normal SNR=0 dB for always LOW attack model
Figure 3 represents the performances of k- mean clustering technique when the attacker does not follow any particular attacking model and randomly [10], reports either high or low received local sensing report, where we does not predict its action. In this case the k-mean cluster reduction technique is out performed by the box plot test method, but this is only true for 3-4 outlier case, since the box plot test removes the 3-4 outliers effectively. But for large number of outliers with any preferred attacking model called RANDOM attacking model, then the k-mean clustering method have very poor system performance.
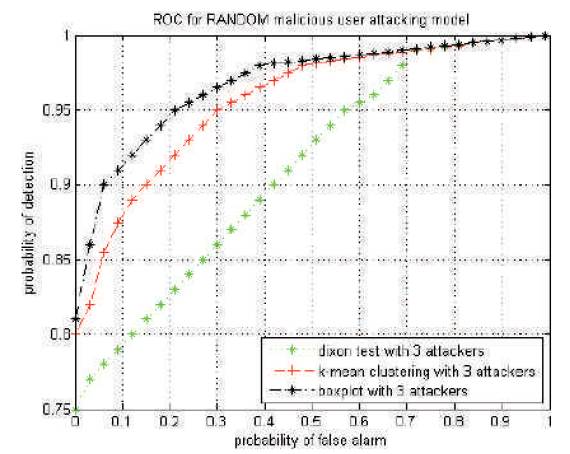
Figure 3. Probability of detection versus probability of false alarm for average normal SNR=0 dB for always RANDOM attack model
In this paper, we have proposed the use of k-mean clustering algorithm based outlier detection technique in cooperative spectrum sensing systems in cognitive radio to detect three or four attackers or malicious users. Monte- Carlo simulations are performed to compare the k-mean clustering with Dixon's test and box plot test. It is observed that the k-mean clustering technique out performs the box plot test and Dixon's test when attacker follows the always HIGH and always LOW attacking models. We also show the limitation of k-mean clustering under random attacking model or if we cannot predict its attacking model.