Figure 1. Classification of Mobility Models
In present days, Wireless Sensor Networks (WSN) play an important role in wireless communication. Wireless Sensor Networks are self-configurable, self-healing networks consisting of a larger number of small size sensor nodes. Senor Node is composed by processor, memory, battery, sensor devices and transceiver. WSN focuses mainly on sensing environment data and transferring it to the computational centre via the sink. Mobility Models play an important role in the performance of WSN. In this paper, various performance parameters of WSN on different mobility models are analyzed with the help of NS- 3.22 simulation tool. Network performance depends on the nodes' population and displacement.
In wireless sensor network, the sensor nodes are distributed in various geographic areas for sensing the data and the sink nodes are used to collect data from different sensor nodes. In the in-building scenario, the base station acts as an access point to a wired network and nodes form a wireless backbone to provide wireless connectivity. Mobility models are defined as nodes which have displacement capability, change in their position, velocity and acceleration, in particular time interval. For an investigation of communication or navigation techniques, such models are simulated. In mobile communication, mobility management technique is used to predict the actual position node (Alaybeyoglu et al., 2009).
For Wireless Sensor Networks (WSN), various mobility models have been proposed. WSN is a group of N sensor nodes in dynamic topologies consisting of 1 master node and N-1 slave nodes. WSN works on data gathering mechanism where data from environment are collected and routed to the processing node (Stevanovic and Vlajic, 2008). WSN supports wide variety of applications such as military application, industrial area, machine health monitoring, environmental, home automation, traffic control etc (Ali, 2012). There are a number of mobility models such as Random Direction Mobility Model (RDMM), Random Waypoint Mobility Model (RWMM), Random Walk 2D Mobility Model (RW2DMM), Gauss-Markov Mobility Model (GMMM) etc. for wireless sensor network. Network Simulators (NS2, NS3), OPNET (Optimized Network Engineering Tools) modeler Wireless Suite, QualNet, OMNet++ (Objective Modular Network Testbed in C++), J-Sim, MATLAB SIMULINK, ATEMU tools etc are used in the implementation of wireless sensor networks (Ali, 2012; Dharani et al., 2014).
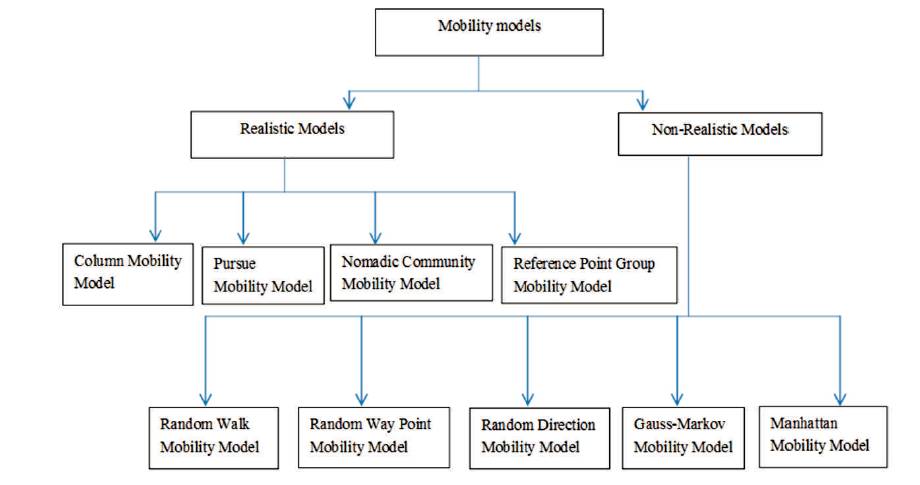
A mobility model attempts to mimic the movement of real mobile nodes that change the velocity and direction with time. Mobility model represents the nodes' displacement and position. It also signifies the movement of nodes and their location, velocity and acceleration change over time. Such models are frequently used for simulation purposes, when new communication or navigation techniques are investigated. Mobility management schemes for mobile communication systems make use of mobility models for predicting future node positions (Jain et al., 2015). Israni et al., (2015) presented the classification of mobility models used in Mobile Ad Hoc Network (MANET). It is classified into two types, one is Realistic model and another one is Non-realistic model. Classification of mobility models are shown in Figure 1.
Figure 1. Classification of Mobility Models
In realistic mobility model, mobility patterns are observed via real life systems. It is also known as group / traces model. The realistic mobility models depend on having a group of mobile nodes that use the same mobility model to move within the network (Israni et al., 2015). In a realistic mobility model some demerits are imposed on node movement. These limitations may be due to environmental obstacles such as buildings, or the rules made for node movement such as moving in predefined pathways.
1.2 Non-Realistic Mobility Model
This group of model considers node movement which is completely random in nature. In non-realistic mobility model, environmental factors such as buildings, nonenvironmental factors such as movement rules cannot limit the node mobility. In this model, a mobile node moves independently of any other nodes that may exist in the network. Thus, the mobile node moves according to the adopted mobility model without taking the position and the mobility model adopted by other mobile nodes, that may exist in the network into consideration (Israni et al., 2015). In this work, the authors' have considered various non-realistic mobility models which are as follows.
In Random Walk 2D Mobility Model, mobile nodes move from its current location to a replacement target location randomly with new direction and speed. This new speed and direction square measures each chosen parameter from predefined ranges, [min-speed, max-speed], and [0, 2*Π] supports uniform distribution (Jain et al., 2015).
It is a very simple model based on pause time between changing direction/speed. These models background a random point in the simulation area with a uniformly distributed speed between [min_Speed, max_Speed]. After arriving to the destination, it again waits for the same period of time (pause time) before moving to a new place (Jain et al., 2015).
Random Direction 2D Mobility Model is sculptured for concentrating on the shunning of mobile nodes at centre of the world. In this model, the mobile node decides a random direction to travel, then travels to the border of the simulation space. Once the simulation boundary is reached, the mobile node halts at a particular time and then chooses the direction in a specific angle i.e., between zero to a hundred and eighty degree, thus continuing once more in elect angle direction (Israni et al., 2015).
In the Gauss-Markov Mobility Model, every mobile node is initialized with a speed and direction with mounted intervals of time; movement happens for change in the speed and direction of every node. Value of speed and direction at th the n instance of time is calculated, supporting the worth th of speed and direction at the n-1 instance and variance (Jain et al., 2015).
The Manhattan quality model uses a grid road topology. This model is principally projected for the movement in geographical area, wherever the streets are associated in organized manner and also the mobile nodes are allowed to maneuver solely in horizontal or vertical direction. At every intersection of a horizontal and vertical street, the mobile node will flip left, right or go straight with certain probability (Jain et al., 2015).
In this study, many literatures related to the field of WSN are reviewed. Most of the related works are highlighted in the existing mobility models as well as different performance metrics. Apart from these, it also collected the researchers' point of views and their directions in the future work. Jain et al. (2015) presented the study of Mobility Models for WSN. They described the various performance metrics of WSN and predicted better efficiency of WSN. Khan et al. (2013) evaluated the performance of WSN by placing the sensor nodes in three different topological designs namely Linear, Tier-one and Split-Tier-One. They found that simpler network design does not offer better network performance in WSNs, especially in delay sensitive industrial applications with higher traffic load. Vasanthi et al. (2011) presented the study of various mobility models with unique characteristics such as temporal dependency, spatial dependency or geographic restriction. Kumar et al. (2007) observed the mobility patterns on various routing protocols of Mobile Sensor network. Aslam and Rashid (2011) presented the comparison between random walk and random way point mobility models. Their experiment result showed that all routing protocols performed same under random way and random walk mobility models. Wang and Akyildiz (2010) presented the study of traffic pattern in WSN with respect to different mobility models and found the relationship between the temporal property of network traffic and the spatial property of mobility models. Manjula et al. (2008) presented the study of Ad Hoc On-Demand Distance Vector (AODV) Routing protocol with two mobility models. Their experiment result showed that Pursue Group mobility model is better than Random Based Entity model (Patel et al. 2014). Mobility is important for the purpose of improving communication performance in wireless networks. Katkar and Ghorpade (2016) presented the comparison between NS-2 and NS-3 and found that NS3 is better than NS2.
The experiment work is carried out in the Network Simulator NS -3.22. Analytical modeling, simulation and measurement are the three methodologies used to evaluate the performance of WSN. The simulation model developed and used here for NS-3.22 scenarios, simulates the result and generates the graph for Non-Realistic Mobility Models with different numbers of nodes of Wireless Sensor Network. This work is done to know which Nonrealistic Mobility Model performs best with varied number of nodes. In these models, 5-25 nodes are used and various performance matrices in terms of Packet Delivery Ratio (PDR), delay, packet loss and throughput are taken for simulation.
In this experiment, 5, 10, 15, 20, 25 number of nodes with different mobility models are simulated and the performance metrics PDR, throughput, delay, packet loss etc. are measured. Node pause time was also considered. For this simulation in NS-3.22, the parameters used are shown in Table 1.
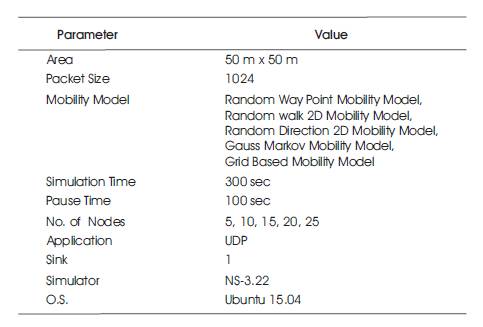
Table 1. Simulation Parameter of WSN
The analyzed results from the particular trace file of Non Realistic Mobility Model are assessed on the basis of different performance metrics like PDR, throughput, Delay and Packet loss and results are shown in Figures 2 to 5.
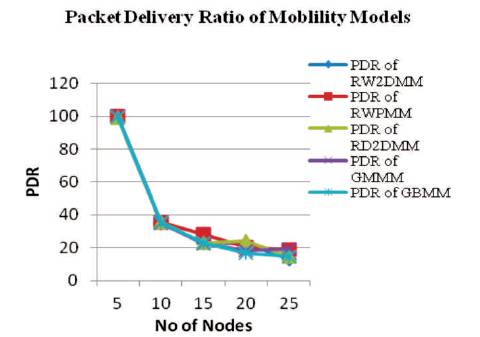
Figure 2. PDR of Mobility Models
Figure 2 shows the variation of PDR with varying number of nodes. The graph shows that at 15 no. of nodes, Random Way point gives better Packet Delivery Ratio (PDR) compared to other Mobility Models.
Figure 3 shows the variation of delay with varying number of nodes. The graph shows that at 15 no. of nodes, Random Way point gives less delay compared to other Mobility Models.
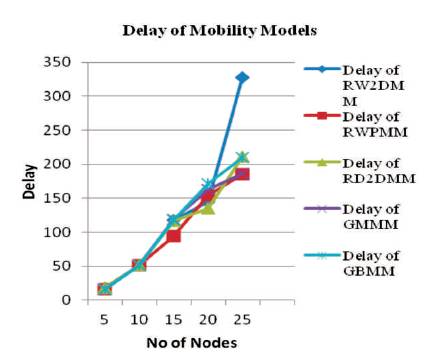
Figure 3. Delay of Mobility Models
Figure 4 shows the variation of packet loss with varying number of nodes. The graph shows that at 15 no. of nodes, Random Way point gives less number of packet loss compared to other Mobility Models.
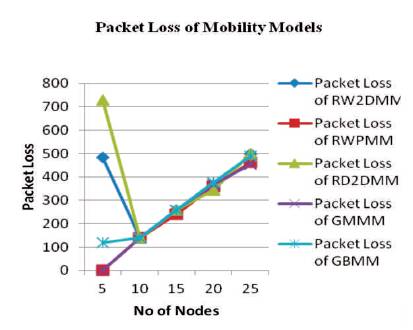
Figure 4. Packet loss of Mobility Models
Figure 5 shows the variation of throughput with varying number of nodes. The graph shows that at 15 no. of nodes, Random Way point gives better throughput compared to other Mobility Models
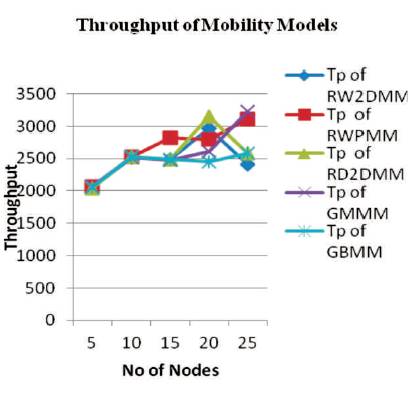
Figure 5. Throughput of Mobility Model
In this paper, MANET Mobility Models are applied on WSN and results are obtained on various parameters such as PDR, throughput, delay, packet loss with the help of NS-3.22 simulator. By applying different Mobility Models and varying the number of sensor nodes, results are analyzing. After analysis of all the results of Mobility Models, it is found that Random way point Mobility Model gives the better performance for 15 number of sensor nodes in 50*50 area as compared with Random Walk 2D Mobility Model, Random Direction 2D Mobility Model, Gauss Markov Mobility Model and Grid Based Mobility Model. In future, this work can be enhanced with other Mobility Models of Wireless Sensor Network, for extended performance considering other scenarios like traffic generators, packet interracial duration, speed etc. This work can also be extended with other 9 simulator tools of WSN like OMNeT++, OPNET etc.