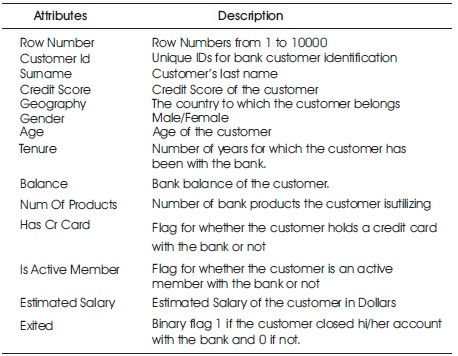
Table 1. Attributes of the Dataset and Their Descriptions
Over the years it has been observed that, market expansion in any sector has led to a huge customer base for service providers. This huge base comes with a variety of expectations. When these expectations are not met, it leads to dissatisfaction which ultimately leads to churn. Thus, in competitive markets, Customer Churn is a big problem for any company, causing huge loss of revenue. Our work contributes to developing a model that can predict potential customer for churn. We have used machine learning algorithm like SVM, Random Forest, Linear Regression to predict churn. We have compared different algorithms and speculated to use a method that could provide better accuracy. However, these algorithms do not provide the expected accuracy, so Artificial Neural Networks are applied in the dataset, which provides us with excellent accuracy.
The volume of data generated in any industry has seen a huge spike over the years. It can be said that data is the key to success of any company if it is rightly used. In recent times, many new technologies have been used to infer knowledge which is concealed in the raw data. The method of extracting valuable information from data is known as Data Mining. The extracted data is further analyzed to find meaningful insights from it for business development. A large amount of data is generated by the customers of the companies. Customers are a valuable asset to the company. Nowadays, companies are not only trying to get new customers but also retain existing customers. Customer churn occurs when customers or subscribers stop doing business with a company or service. In order to retain the customers, companies and businesses should be able to predict the customers' behavior accurately and develop connections with them. Banking is one of the competitive sectors where customer relation is of the utmost importance for any bank.
Home Loans are typically the longest relationship with any customer. Statistics prove that customers are more sophisticated and they need some offers and boosts to continue their relationship with organizations. Customer churn hinders the growth of an organization and so one must have an efficient way of calculating the churn. By this method, organizations can monitor the behavior of their customers and predict the churn at an early stage and implement strategies to prevent the churn.
This article presents a study on the use of the neural network as one of the data mining methods for knowledge discovery from databases in the banking industry. Data mining is automated process of analyzing, organizing or grouping a large set of data from different perspectives and summarizing it to useful information using special algorithms. Data mining can be helpful in resolving banking problems by finding some hidden patterns in large amounts of data (Oyeniyi et al, 2015). In this paper, the author uses the data mining methods, neural network, within the software package Alyuda Neuro Intelligence to predict customer churn in bank. The focus of the customer churn is to determine the customers who are at risk of leaving and analyzing whether it is worth retaining those customers. The results showed that the loyalty of customers was proportional to the bank services used by them. An Neural network is a valuable forecast tool in financial economics due to the learning, generalization and nonlinear behavior properties. It is powerful generalpurpose software tool used for a number of data analysis tasks such as prediction, classification (Ying et al., 2008).
Customer churn has become a major problem within a customer centered banking industry and banks have always tried to track customer interaction with the company, in order to detect early warning signs in customer's behavior such as reduced transactions, account status dormancy and take steps to prevent churn. This paper presents a data mining model that can be used to predict which customers are most likely to churn (or switch banks). This study used actual customer records provided by a major Nigerian bank. The raw data was cleaned, pre-processed and then analyzed using WEKA, a data mining software tool for knowledge analysis. Simple kmeans was used for clustering phase while a rule-based algorithm, JRip was used for the rule generation phase. The obtained results showed that the methods used can determine patterns in customer behavior and help banks to identify churners and hence develop customer retention modalities (Li & Wang, 2018).
Improved Balanced Random Forests (IBRF) was utilized to predict the customer churn, by incorporating a cost-touchy learning and a testing method into standard random-forest to get a superior exhibition. This enabled it to achieve a higher performance than the existing algorithms. The IBRF algorithm alters class distribution and imposes a high penalty on misclassification of minority classes and hence the IBRF learns the best features iteratively.
This algorithm used the transactions data like credit and debit of customers at a particular commercial bank in China. This data helped to improve the prediction accuracy and minimize the loss, using algorithms such as CWC-SVM (Class- Weighted Core Support Vector Machines). In addition, the top decile lift of IBRF is better than that of ANN, DT, and CWCSVM. IBRF offers great potential compared to traditional approaches due to its scalability, and faster training and running speeds (Karvana et al., 2019). Customer churning is not only a concern for banking industry but for other industries as well.
Telecommunications industry has faced a mass customer churn and has attracted the need for customer churn prediction. Many authors have per formed churn prediction using various data mining concepts which employ machine learning algorithms. This paper studies about accurate customer survival and customer churn tenure. It also researched about the identification of customers who are at the blink of churn and approximating the time they will churn. It focused on analyzing the churn prediction techniques to identify the churn behavior and validate the reasons for customer churn. In order to gain a deeper understanding of customer churn, it summarizes the churn prediction techniques and shows the most accurate churn prediction, which is given by the hybrid models. Hence making the industries in telecom sector more aware of the risks and enhance their services. From this analysis, it can be concluded that the most accurate churn prediction is obtained when utilizing hybrid methods instead of single algorithms. The research on churn prediction has greater scope which influences us to come up with our own version of hybrid model of churn prediction in future (Amin et al., 2014; Gaur&Dubey, 2018; Ahmed&Linen, 2017).
Dolatabadi and Keynia (2017) tried to use data mining models to predict two aspects, namely churn customers and churn employees. The data used is demographic and transaction data. This study compares the number of employees or customers who leave with those who remain as much as 15–20% versus 80–85%. They used several data mining models, namely Decision Tree, Naïve Bayes, SVM and Neural Network classifiers. From this study, researchers concluded that data mining techniques such as SVM can predict employees and customers to create accurate predictive models. The customer churn problem was discussed and surveyed, also the techniques used to build the predictive customer churn models were compared. The major contribution of this paper is the demonstration that machine learning techniques (e.g., SVM) can be used to build reliable and accurate predictive models for employee and customer churn (Bilal Zoriæ, 2016; Dolatabadi & Keynia, 2017).
Nowadays, all the banking industry should measure customer churn rate and need a solution to predict customers who are on the verge of leaving the organization. Machine learning algorithms act as the saviors of financial institutions. Machine learning helps predict customers churn. Customer acquisition proves to be much more expensive than retaining a customer. In order to earn business from the new customers, we need to work on the leads and lead to funneling the sales, utilizing resources and investing time behind customer needs. For customer retention, it is more cost effective as we only need to work upon the trust created with the customers. For example, If you lose 20% of your customers yearly, it would take 25% increase in new customer to get you back on track. What if you could reduce that churn rate to 10%? It would take only 11% increase in new customers to get you back on track.
There may be a number of reasons for customer churn, but a few of them are common. The main reasons are dissatisfaction with service provided to customers, bad support to customers, expensive cost for servicing, unviable plans. If a business has the power to predict if a customer is probable to be churned then it acts as a way to save money for the business because it is known that the cost for customer acquisition is six to seven times higher than customer retention. It may be the case that apart from the loss incurred to the business by the leaving of the customer, the initial cost of acquiring the customer may not be covered by the business to date. Thus, due to all such reasons, we need to identify and create the possible technical/non-technical solutions, which helps the bank to identify the withdrawn customers and act accordingly to ensure retaining the customers.
Machine Learning is a technology that can convert information into knowledge. It consists of various algorithms which can be applied to data to mine knowledge out of it. There are three major types of machine learning approaches, which are unsupervised, semi-supervised, and supervised approach. The process of finding hidden patterns from the labelled dataset is known as supervised learning (Hemalatha & Amalanathan, 2019). The process of discovering patterns from unlabeled data is known as unsupervised learning (Spanoudes & Nguyen, 2017). Semisupervised learning is a type of supervised learning approach but it uses unlabeled data for its training period, usually a small dataset is used for the training. It is a technique in the middle of the other two techniques.
For our project we make use of customer's data of a certain bank. This dataset is studied for predicting customer churn. It consists of ten thousand rows and fourteen columns. Each row represents a customer's data and each column represents an attribute associated with the customer. The dataset is available on Kaggle and it has reliable data and did not consist of empty tuples. Table 1 shows the attributes of the dataset and their descriptions. Figure 1 shows a heat map indicating the correlation between the attributes.
Table 1. Attributes of the Dataset and Their Descriptions
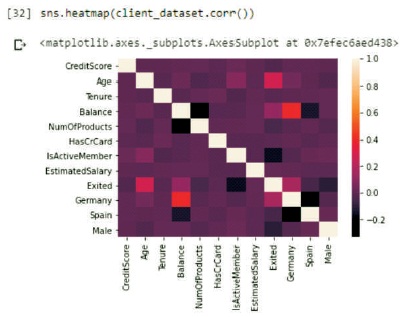
Figure 1. Heatmap Showing the Correlation Between the Attributes
We try to build a model that can predict the probability of customer churn, by using its record of data from the dataset. This will help the bank to know which customers are likely to terminate their business with bank. The bank can accordingly develop and implement strategies to retain their customer. Once the data is collected by the bank and is ready for use, it is transformed and processed for training phase. The algorithms mentioned are applied into this data to generate a classification model. The data is split into two parts. One is used as training data to train the model, whereas the other is used to test the model. The model generate rules from training data and applies them on testing data to determine which customer may leave. The dataset consists of 14 attributes out of which, 3 attributes namely Row Number, Customer ID and Surname were irrelevant and were dropped. Geography and Gender are Categorical attributes and so they were mapped to numeric values. For Geography, there are three values namely, France, Spain and Germany. Using One Hot Encoding, we assigned numeric values '0', '1', '2' to France, Spain and Germany, respectively. Similarly, for Gender, Female – '0' and Male – '1'. We performed statistical analysis on the dataset to discover correlations between different attributes of the dataset. Accordingly, different plots were generated to perform analysis and for visualization purposes.
We are using Python 3.7 as our basic programming language for building machine learning models to predict customer retention. Our prototype back end is completely built in Python (Anaconda). Python has a powerful set of packages for an extensive range of data computing and prediction. We have deployed Python backend with the help of Flask framework on web. The main packages and Python libraries that are used in this project are as follows.
The prediction of whether a customer will stay with the company or not will be mainly done with Keras library. This library is used to train our model to predict whether customers will leave or not. We have implemented Neural Network with the help of Keras.
We have performed the following methods as shown in Figure 2.
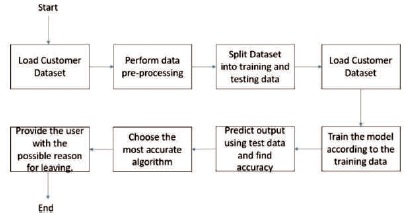
Figure 2. Overview of the Method
Step 1: Load the dataset which we want to train our model and predict outcomes.
Step 2: Remove the redundant attributes which are not useful for training our model.
Step 3: Split the dataset into training and testing data, in our representation we have split the data in the ratio of 70:30. i.e., 70% will be used for training and 30% for testing.
Step 4: Load the training data into our model which we have developed.
Step 5: Train the model according to the training data.
Step 6: Predict the output using the testing data and find the accuracy of the model trained.
Step 7: Use the best suited algorithm.
Step 8: Provide the user with the most probable reason for the customer leaving the organization.
We have used machine learning libraries, scikit-learn to predict customer churn. Scikit-learn provides a range of learning algorithms through a python interface. Before we use Scikitlearn, we need to install SciPy (Scientific Python), which is created by scikit-learn library. Some popular models provided by scikit-learn are Clustering, Cross Validation, Datasets, Ensemble methods etc.
A number of different python libraries have been used for training machine learning models. To import the dataset, we have used the pandas library. For visualization purposes, the seaborn library was used and for training the ML algorithms scikit-learn library was used. We need to perform exploratory data analysis to find patterns in our datasets. We see that our dataset has fourteen columns/attributes. Some columns/attributes in the dataset have no relation with customer churn and hence they are redundant.
For example, the first attribute “Row Number” is just a consecutive numbering to rows which has no use. Similarly, the attributes “Customer Id” and “Surname” are in no way related to the customer churn. Hence, we remove these columns from our training datasets. Then we perform the statistical analysis of the data which provides us with details such as mean, standard deviation, count, max, min, etc. Now that we have an overview of our data, we are trying to find a relation between the attributes. Figure 3 shows the data exploration.
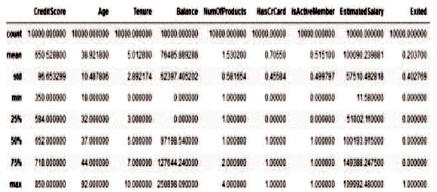
Figure 3. Data Exploration
The Geography and Gender columns in our dataset are categorical. That is, they are text data. However, we know that the ML algorithms work with only numerical data. To convert categorical data, we use the one-hot encoding scheme (Figure 4). In this scheme, we add a unique column for each unique value in the attribute and then assign it with 1 if the value exists and with 0 if it does not exist.
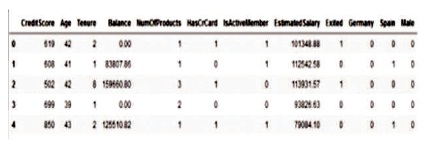
Figure 4. After Performing One-Hot Encoding
We follow the below steps in order to convert the 'Geography' attribute to one hot encoding column:
In fact, we do not need the third column we used above, because if the first two columns have a value 0, then it is implied that the third column will have the value 1 and vice versa. This is done in order to avoid introducing another dummy variable.
For all the algorithms, we have used the same technique which is as follows.
It is a statistical model which uses a logistic function consisting of two variables to predict the value provided by an independent variable. It uses an estimation to determine the value of the dependent variable in its binary representation form, although there are many complex interdependent forms of logistic regression. A logistic regression in its binary form consists of two variables, which can have two values–'0' and '1' which indicate pass and fail respectively. Logistic regression often uses a sigmoidal curve to predict the values and output a number between 0 and 1.
SVMs are a type of supervised learning models that can be used for classification. If we have a set of training examples, we can categorize the data into two or more classes by building a model. A hyperplane is used to separate the classes and the points in space which are mapped according to the categories. The hyperplane used to divide classes can be multi-dimensional and does not need to be just a line or a plane. The new unseen data is used to be input into classes. Non-linear classification is also supported by SVM, which implements it using the kernel trick, which maps the inputs provided in high dimensional spaces.
Random Forest is mainly used for the classification of data and is a supervised means that the data provided to the training sample is labeled Random forest algorithm implemented voting method wherein the decision trees are used on the data and thereafter selects the optimal solution by voting. Random forest performs better than a single decision tree as it averages the result and thus reducing over-fitting.
Artificial neural networks are inspired by the biological brain structures of animals. Such systems generally learn to perform specific activities and tasks by observing at the examples around them without any stringent rules. For instance, for image recognition, they may learn to classify objects using labelled examples given to them. They are able to identify the objects after they are fed enough examples and also function without any prior bias towards objects. ANN consists of interconnected nodes which can also be referred to as neurons. These connections are able to transmit signals from one node to another that act like neurons in a brain. A neuron or anode receives this data and then processes some operation on the data, then passes it forward to other nodes. Figure 5 shows the correlation of the dataset.
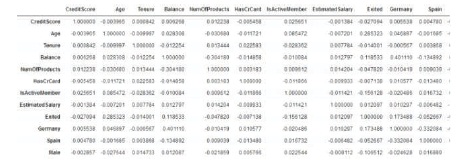
Figure 5. Correlation
For our application, we have built a neural network of three layers, consisting of the input layer, the hidden layer and the output layer. In the input layer, there are 11 inputs, in the hidden layer we have initialized 6 neurons with the 'ReLU' activation function. For the final output layer, we have used the 'sigmoid' activation function as we want the final predicted value to be between 0 and 1. We have trained the neural network to 500 epochs. If the value is greater than 0.5, then the value is updated as 1 and 0 if it is not. Then we check the accuracy of our model by comparing the actual output and the predicted output.
By analyzing the results, we get some insights. We find that the probability of churn in females is higher than that of males. It is found that from a set of customers, 25% females are more probable to churn while the percentage in case of male customers is 16.45%. Based on geography, the customers in Germany are more probable to churn as compared to those in France and Spain. For a set of customers in each country, 32.44% in Germany, 20.29% in Spain, 16.15% in France are likely to churn. We also found that churn among elderly customers is higher than younger customers. Also, the customers with higher salaries and balances in account show a higher churn than others. Figure 6, 7 and 8 shows the upload page, default page for uploading and prediction page, respectively.
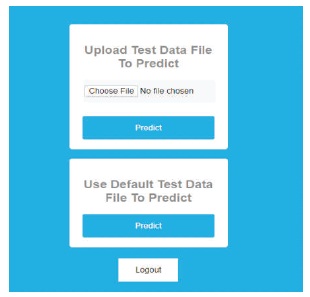
Figure 6. Upload Page
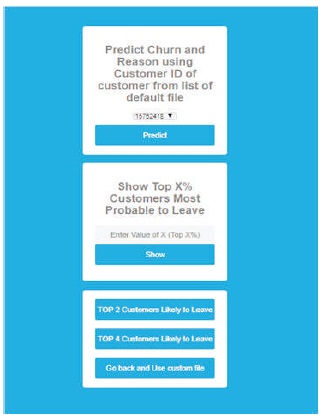
Figure 7. Default Page for Uploading
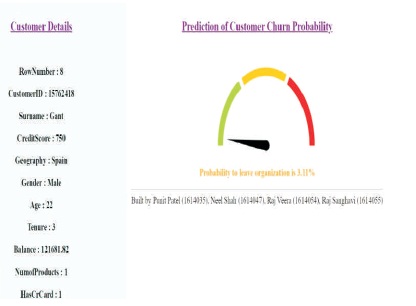
Figure 8. Prediction Page
We have implemented the four algorithms, i.e., Linear Regression, Support Vector Machine (SVM), Random Forest and Artificial Neural Network with the same dataset to compare their accuracy. We need to keep in mind that the accuracy changes in every iteration as the training and testing data is selected randomly. The maximum accuracies obtained using the algorithms are provided in Table 2.
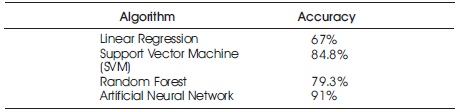
Table 2. Algorithms Implemented Along with their Accuracy
Customer churn is a prominent problem for all the industries. Customer churn causes loss of revenue and deteriorates brand value and brand image. Customer churn is painful for every organization as it leads to revenue disruptions, customer dissatisfaction and time and efforts to recover the loss in business. We have previously explained that customer retention is cost- effective as compared to new customer acquisition. As a solution to it, we have developed a responsible predictive model for predicting the customer problem so that the organizations can devise suitable measures for customer retention based on the results provided to us. The model relies on many attributes that determine customer behavior, and we can predict a probability of how likely the customer is about to churn. This gives an organization an initial sight to the problem and it can take rapid measures to avoid loss of business. This paper reviews and analyzes the churn prediction methods that make use of machine learning algorithms like-SVM, Random Forest, Linear Regression and summarized them in a table with their accuracy results along with details of the dataset. However, these algorithms do not provide the expected accuracy, so Artificial Neural Networks are applied in the dataset, which provides us with excellent accuracy and hence application is built to provide different functionalities.