Figure 1. Non Redundant (RAID Level 0)
In order to improve the performance of I/O and reliability, 1980's disk arrays were introduced, in which we have used multiple disks in parallel. Today, it is used by most of the companies as a product. In this paper, we provide the complete overview of disk arrays and propose a framework for which we can organize current and future work of RAID (Redundant Arrays of Inexpensive Disks). There are two architectural techniques used in disk array, to improve the performance striping across multiple disks, and redundancy is used to improve reliability. This paper describes seven disk array architecture called RAID with levels 0-6 and also equates the cost, performance and their reliability. At last we discuss the advanced topic, such as how to improve performance by purifying the RAID levels and maintain the consistency by designing algorithm.
During server setup, storage is an important consideration. All the necessary information about you and your customer can be stored in one place and retrieved for later use (Chen et al., 1994). If your needs are simple then only single disk can fulfill it. If your requirements are complex, redundancy and performance, then RAID will help you in that situation (Long et al., 1994).
The combination of drives in different pattern can obtain greater performance and redundancy (Merritt et al., 2001). It is implemented as a layer in between the raw drives or partitions and the file system layer.
The main thing that RAID provides is performance and redundancy. Redundancy is an increase in the availability of data (Long et al.,1994). During certain condition, when drive gets corrupted, your information can be easily accessible and system will work as usual until disk is replaced (Chen et al., 1994). This is used when disturbance occur in system.
RAID offers another advantage that is performance. By using a single disk, the speeds are limited. With RAID, data is distributed, which means that multiple disk can be accessed for each read operation which increase the speed. Write operations can also be improved in certain configurations, as each individual disk might be asked to write only a fraction of the total data (Merritt et al., 2001).
RAID is mainly designed for servers, and can also be used for the systems where we need high data security, high speed and larger performance. Fast read and write operations for large files are important for video editing, CAD, graphic design (Franaszek et al., 1996).
There are different techniques used to manage the data across multiple disks called RAID levels. Data redundancy and performance is different for each level. Some levels provide more performance while others provide better security (Franaszek et al., 1996).
With a single storage disk, you cannot protect yourself from disk failure. Your system will stay down, and will require additional cost and time to replace that disk, reinstalling operating system and to backup your files. If no back up IS present, we need to enter all the data again, and this whole process takes a lot of time. With multiple disk and redundancy, you can overcome these issues, and your system stays up even while the replacement process take place.
A disk contains a set of platters covered with the magnetic medium (Chen et al., 1994). It rotates at a constant speed and has a set of disk arms with read write heads, which moves across the platters through an actuator. Once the heads are fixed correctly, the read and write data are done in sectors on the surface of platters. Heads are moved collectively in every disk and only one head can write or read in given specified time, and a complete circular swatch of data is called tracks and each pattern consist of ring of tracks. A vertical collection of tracks are called cylinders (Chen et al., 1994). The disk service time is divided into three modules: seek time, rotational latency and the data transfer time (Long et al., 1994). As we know that read write operation is done through heads, first we have to adjust the head on correct position. The time needed to move or adjust the head to the correct position is called seek time. We have sectors on which we perform read write operation and the time needed for our desired sector to rotate under the head is called rotational latency. Average rotational time for disk is in between 20 to 28 milliseconds (Chen et al.,1994). The rate at which data is transferred from/to a platter surface, rate of rotation, magnetic medium's density are the dependencies of data transfer time. Normally, the data transfer time range is between 1 to 5MB's/Second (Chen et al.,1994).
The fast data transmission rate and slow head- positioning of disks results in very different performance for a sequential access depending on the location and size of every individual access (Chen et al., 1994). Suppose, we have transferred 1MB of data and data is laid in both ways sequential and randomly placed, sequential with in a single cylinder and randomly paced in 8KB block, In both the cases, the time for transferring 1MB data is 200ms, but the head positioning time of sequential is 16ms and the random is 2000ms. Because of this sensitivity of work load, input output applications are categorized as high data rate (Patterson et al., 1989).
In this paragraph, we discuss the data path between disk and user application. On the surface of disk platters, information is characterized as reverse in the direction of stored magnetic fields. Lowest level read electronics sense and amplify the flux reversal and digitize the flux reversal into pulses. The interface of disk system is defined by ST506/412 protocol (Chen et al., 1994). Beyond this level, pulses are decrypted to distinct data bits from timingrelated flux reversals. The computer requires a logical block number, and the controller surrounded by the disk maps that block number to a physical track cylinder and sector (Long et al., 1994). Data path between host computer and disk have topologies and devices and varies depending upon the type and size of input output system.
In this section, we will discuss the issues in the design and implementation of disk array. We will discuss data stripping and redundancy in RAID and compare the performance and cost of RAID. At last we will discuss the reliability of RAID.
In disk arrays, data stripping and data redundancy are two most important concepts to be understood. Data stripping is used for improving performance, and data redundancy is used for reliability/availability.
Data striping means transmitting data over multiple disk which appears as a single, large and fast disk (Shooman & Shooman, 2012). Striping works in parallel, allows multiple input/output, which increases its aggregate performance. It has two aspects when working in parallel.
Redundant disk array groups can be renowned on two characteristics.
Fine grained inter leaving data is in small units, so the size of data does not matter. I/O request access a disk of the array which results in higher transfer rate, but the disadvantage of fine grained is, only one request can be entertained at a time (Merritt et al., 2001).
Coarse grained interleaving data is in large units so small request access small number of disk and large request access the large number of disks in disk array. It entertains multiple requests simultaneously (Merritt et al., 2001) .
If we have large number of disks in disk array then our overall reliability is less, therefore we have to add redundancy in disk array to tolerate disk failure and make the continuous operation on the system and avoid data loss. If disk array has redundancy among the disks, two problems occur (Patterson et al., 1989). They are,
Distribution methods can be classified into two schemes.
This section provides the information about the basic RAID organization, which can be used further for examining the cost, performance and reliability of disk arrays. Mostly RAID levels provide recovery and protection against hardware defects, and they do not give protection against data loss due to software malfunction. In short, RAID is not the replacement of backup plan, it is a recovery scheme and aims to prevent data loss. RAID has different levels, every level useS its own technique to prevent data loss and recovery scheme. RAID levels are described as follows.
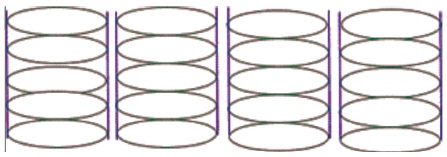
RAID level 0 uses the concept of stripping. It divides the data across the multiple storage devices. This technique increases the I/O performance because of accessing multiple disks at the same time. It is very useful in large application having huge data. (Merritt et al., 2001) It is easy to implement and it uses all the storage capacity, and has no over head. Level 0 is also known as non-redundant disk array and it is the lowest cost level of RAID because it has no redundancy as shown in Figure1. It gives the best write performance, because the update is performed directly on the original file, no need to update redundant file at all, but for read operation, redundant schemes such as mirroring can perform better (Chen et al., 1994).
Figure 1. Non Redundant (RAID Level 0)
Non redundant disk array is not fault tolerant. If anyone of the disk in the array fails because of unredundancy, it results in huge data loss. It is useful in super computing environment where the primar y concern is not performance reliability.
RAID level 1 uses mirroring and shadowing, a traditional approach of mirroring in which every disk has a redundant disk as shown in Figure 2. It means that it uses twice the number of disk than level 0 (non-redundant disks). So if we write on one disk, same data is written on its redundant disk, so the write or update operation on RAID level 1 is slower than level 0 because of dual write operation. But for retrieval or read operation, it is totally different, as data is saved on two disks. When retrieval is needed, it retrieves the data from the disk having short seeking, rotational, queuing time. Retrieval operation of level 1 is faster than level 0.

Figure 2. Mirroring (RAID Level 1)
RAID level 1 is fault tolerant. If one disk fails, the service is provided from the copy of that disk. This level is best for the application where availability is more important than efficiency such as database applications. The only disadvantage is storage capacity, as only half storage is used in level 1 because other half is used for redundancy.
RAID level 2 stripes the data at bit level, rather than block level, and it uses hamming code for recovery (Franaszek et al., 1996). All the disks are synchronized by controller at same orientation, so only one request can get the service at a time at level 2.
It is cost effective than RAID level 1 mirroring because at one, scheme 4 disks required three redundant disks, one less than mirroring as shown in Figure 3. The number of redundant disk used in this level is proportional to the log of total number of disks (Guha et al., 2008). If one component fails, many parity value becomes in-consistent and the failed module is the one whispered by every incorrect subset. Recovery is done by reading the other components of a subset which includes parity components and set the lost bit 0 and 1. Multiple redundant disks identify the failed disks, but only one disk is needed for recovery. RAID level 2 is rarely used or currently not in use.
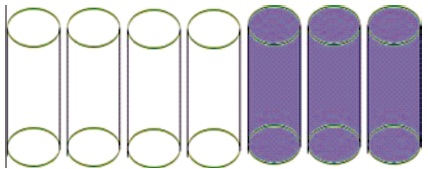
Figure 3. RAID level 02
Raid level 3 identifies the memory component failure easily than level 2 because it uses a single parity disk as shown in Figure 4. RAID level 2 uses multiple parity disk (Hitz et al., 2000). It is which, means data is inter leaved bit wise and a single parity disk is located for the fault tolerance. Read request can access all the disks that contain data and write request can access all the disks containing data and parity disk, and also it means only one single request can be served at a time. Parity disk is not included in read operation because parity disk contains only one parity, and has no information. Due to this, read performance is low because in redundant we have data in different disk and read operation can be done on the disk having less seeking time, but there is no data on redundant disk. This level is used in applications that requires high bit and width than I/O rates.
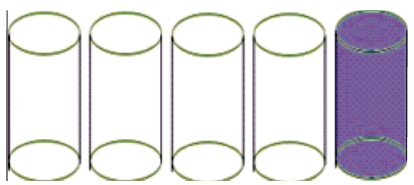
Figure 4. Bit Interleaved (RAID level 3)
Raid level 4 is a block level interleaved parity disk having one dedicated parity disk as shown in Figure 5. The only difference between RAID 3 and RAID 4 is block RAID 3 uses bit and RAID 4 uses block, and the size of block is known as stripping unit (Raid,2015). Read requests smaller than the stripping unit access only a single disk. Write request access the disks, and parity disk for small request which access only single disk parity is calculated based on how the new data is different from the old one and applying the difference to parity block.
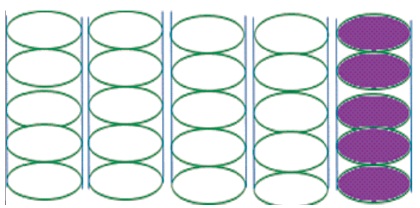
Figure 5. Block Inter Leaved (RAID level 4)
RAID level 4 provides good performance on read, but write performance is low because of a single dedicated parity disk.
Nowadays, RAID level 5 is the most commonly used raid level. RAID level 5 uses data striping and parity. Parity and data is stripped across all the disks in the array, as Figure 6 shows no disk is fixed alone for the parity unlike previous levels 3 and 4. Minimum 3 disks are required in this level. It gives storage capability more than level 1 and 10 and performance better than level 0.
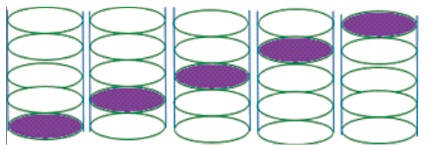
Figure 6. Distributed Parity (RAID level 5)
Benefit of level 5 is that it uses stripping and parity combined. Stripping stores the data on multiple disks. This increases the performance but striping is not fault tolerant, and here parity is used for recovery. When data is written to the disk, system will calculate its parity and parity is saved across different disks, and when the data is lost from any disk, we can recover it from the calculated parity (Chen et al., 1994).
RAID level 5 provides best read performance across all the redundant disk array level because all the disks are involved in the read operation. Where a disk is dedicated for the parity only, which is not included in read operation, the write operation is somewhere slow than other due to read modify write operation cycle to update parity.
RAID level 6 works same as Raid level 5, As Figure 7 shows that it uses double parity. It means parity data for each drive is written on two drives, data and parity are on same drives, and there is no dedicated drive for the parity. In RAID 5, if a drive fails and is replaced by another drive, new drive requires hours to rebuild and at the same moment if another drive failed, it means both drives fails simultaneously, and our data will be lost surely. But in RAID level 6 due to double parity dual drive failure survival data will not get lost (Cudak et al., 2015). Level6 is the best fault tolerant technique and it is the only RAID level which can overcome two drive failure simultaneously without data loss.
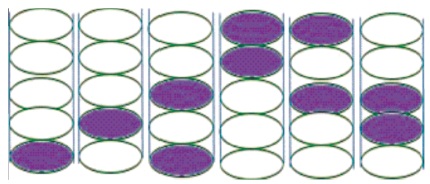
Figure 7. Dual Distributed Parity (RAID Level 6)
RAID 6 provides good read performance like RAID 5 but write operation is little bit lower because of read update write operation cycle of dual parity. It performs twice the calculation of parity than level 5, so its write time is 20% greater than RAID level 5. It is a complex technology and takes a long time to rebuild the array if one drive fails.
By combining RAID 0 stripping and RAID 1 mirroring, we to make a single system, the RAID level 10, as shown in Figure 8. It provides security as level 1 by mirroring and performance, and as level 0 by stripping the data across multiple drives (Cudak et al., 2015). If one disk fails, its recovery time is very fast due to mirroring, because we have exact copy of that disk available. But it uses only half storage memory available because other half has redundant disk, therefore it is very expensive as compared to RAID level 5 and RAID level 6.
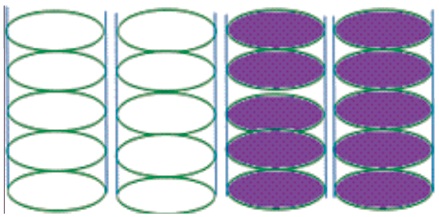
Figure 8. Stripping + Mirroring (RAID Level 10)
Even though process of block inter leaved, redundant array is just modest, in order to work smoothly for system many practical consideration may be chosen by a disk array. The one difficulty is that useful information for disk array is more than data and parity stored in disk. Information like which disk is corrupted and which way is used to reconstruct it and define the sector, can be updated in system crashes.
The metastatic information preserved in redundant disk array is the rationality of each sector of parity and data in disk array. The following type of restrictions should be perceived in preserving information.
Both these restrictions are important, as user does not get the stale data from disk array.
In block interleaved disk array, when the system failed then it is same as disk failure in which the parity information may be lost. The data can be lost when the system crashes. System crashes are more common than system failure. Using the system with failed disk is risky. When every user use the system with failed disk, they should perform logging for write operation to prevent loss of necessary information if the system crash. There are two methods that are used for logging, first is called demand reconstruction. This method is very easy to admitt the parity stripe with an unacceptable sector, which triggers rebuilding of suitable data into spare disk.
The second method is called parity strapping. Before applying this method, we need meta state information and apply that to the system short of stand by spare. Earlier repairing of a write request can get parity stripe with an unacceptable sector. The unacceptable sector is rebuilt and rearranged to overwrite its equivalent parity sector. Then the sector is marked as shuffled.
In this section, we will discuss the way we have to connect disks with host computers. There are many computers connected with many disks through lesser number of strings. If the string fails, it can cause many disk failure.
In Figure 9, there are two ways to connect multiple disks. First option is to join every string of 4 disks into a particular error correction group. Second option is to join 1 disk on every string into a solitary error correction group. In appropriately for first option, all four group of disks are inaccessible if string fails. While in second option, if one disk is lost from these 4 groups, then all others can still access the data.
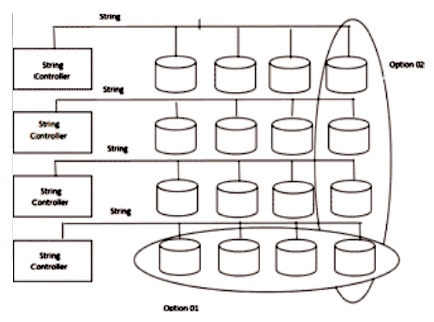
Figure 9. Orthogonal RAID
The very significant metrics to I/O systems are cost and performance and it is also important reason for prominence of redundant disk array. This portion describes the basic reliability provided by parity disk array and states three reasons that can challenge the possible reliability of disk array.
A modest parity scheme works very well, when only selfgoverning disk failure are chosen. In 1988 Patterson developed mean time among failure for RAID level 5. MTTF (disk) 2 /N X (G – 1) x MTTR (disk)
where, MTTF (disk) stands for Mean time to failure for only one disk and MTTR(disk) stands for Mean time to repair for only one disk. N stands for number of disk in an array while parity group is G in this equation. Let's consider that, if there are 100 disks, the mean time to failure for each disk is 200,000 hours while MTTR is one hour. According to parity group of normal size 16, if we consolidate these 100 disks then MTTF of the system will be 3000 years. MTTF of this magnitude decrease the opportunity of failure, than provided time period.
In this part, we will discuss about the system crash and parity inconsistency which interrupt in I/O operation of disk array caused by any of the failure such as software crash, operator error and power failure. This type of failure is called as interrupt write up processes. Due to this, data is restructured although there is no parity or parity is updated. In other case, parity is unpredictable and it is not used in the occurrence of disk failure. Power supplies and redundant hardware are the techniques used to make these crashes minimum, but these techniques cannot be used to stop system crashes.
In disk array of both block interleaved and bit interleaved parity, inconsistency can happen due to these system crashes. This inconsistency in bit interleaved, disk array effect the data that can be written. Similarly in disk array of block interleaved, the other block of data will be effected by the interrupts write operation in the strip which is not written.
When we compute the mean time of data loss, then all the disk failure are self-governing. It results in high mean time to data loss. In certainty the disk failure is more due to manufacturing and environmental issues. Let's consider the example that earth quake also increases the disk failure in disk array at times.
Besides environmental factors, there are many correlated failure modes that are constructed in it. Disks are more likely to cause failure in its early time or later on. Early failure is caused due to transient defects. Late failure is caused due to disk wear out. Reliability of disk array is effected more by correlated disk failure.
In this part of paper, we will calculate the statistics of mean time to data loss after considering these factors. In block interleaved parity disk array, there are three ways to lose data.
These are hardware failure in which we are unconscious to prevent these failure without degrading performance. To build a modest model about correlated disk failures, we will consider that every consecutive disk failure is ten times greater than last failure.
In order to evaluate disk array, there are three major metrics used which are cost, reliability and performance. To understand cost and value in each array organization, we have to consider all three metrics. In this part, we compare the cost and performance of RAID.
Whenever we evaluate the disk array, we consider three parameters which are cost, performance and reliability. There are lot of ways to measure one of each parameter and a lot of ways to use them. Let's consider an example, Should performance be measured in bytes per second, I/O per second or in response time? Can a hybrid metric I/O per second per dollar is more suitable? If the metric is finally decided, should system is compared with same performance, same cost or same reliability? The use of system and purpose of comparison is based on which method is used. In some applications, the main metrics can be the capacity of user per dollar. The main metrics in transaction processing application can be I/O per second per dollar and similarly the main metrics of science related applications can be bytes per second per dollar. Sometimes bytes per second, I/O per second both are important.
Many disk array and most of the secondary storage system are based on throughput. We are basically more interested in overall throughput of the system as compared to individual request per time of system. Such a preference has a sound technical basis: techniques such as asynchronous I/O, pre-fetching, read caching, and write buffering are more widely used. A fast response time depends on sustaining a high throughput. Performance can be increased linearly by adding extra component in throughput based systems. If disk 01 provides 30 I/O per second then by combining disk 01 and disk 02,it will provide 60I/O per second. In RAID system by comparing the performance, we will standardize performance by cost. In simple words, the performance metric can be used in term of I/O per second per dollar.
If the metrics are decided then we have to decide that the system can be compared in terms of cost, capacity or in some other metrics. If we consider the system in terms of capacity then the system can store the amount of data in device and eliminate storage which is used for redundancy. We have to contrast frameworks and diverse files limits, we face extreme decisions, For example, how an outstanding task on a framework with client limit X maps onto a framework with client limit 2X.
Lastly, in comparison of RAID levels 0 to 6 as shown in Table 1, there is a lot of confusion. This confusion rises due to not specific implementation of RAID level. Let's consider an example, the RAID disk array level 5 with parity group size of 2 with RAID disk array level 1 in which definite disk scheduling and data layout optimization is performed, which are not employed in RAID level 5. Comparably RAID level 5 will be able to organize in order to operate equivalent to RAID level 3 by picking a unit of information striping to such an extent that the little unit of array access always admittance the full parity of data. In simple words, RAID level 3 and 1 can be observed as subclass of RAID level 5. RAID level 2 and RAID level 4 is better than RAID level 5 in all ways. The use of RAID level 1indicates that parity group size is close to two; a striping unit is little as compared to the size of a normal request, and it may demonstrate the utilization of a RAID level 3 disk array.
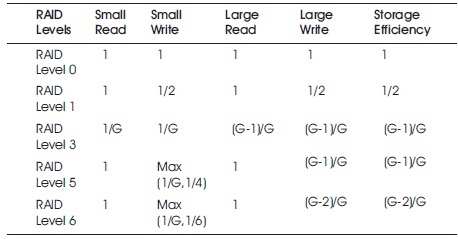
Table 1. Throughput Per Dollar Relative to RAID 0
Table 1 calculates the maximum throughput per dollar comparative to RAID level 0 for RAID level 0,1,3,5 and 6. The total cost depends on the quantity of disks in disk array. In Table 1, the cost of RAID level 0 and 1 is given. Small write up is half in RAID level 1 as compare to RAID level 0. Similarly, if we check the cost of these small writes up, it would be double in RAID level 1 as compared to RAID level 0. Table 1 also shows the storage efficiency of every disk. Comparative to RAID level 0, the storage efficiency is inversely proportional to the cost of each array.
Figure 10 is the graph that shows the performance/cost metrics from Table1 in which RAID levels 1, 3, 5 and 6 are above the variety of parity group size. If parity group size is equivalent to two, then the performance/cost of both RAID level 1and RAID level 5 is equal. If we consider the performance/cost for RAID level 3 which is always less than RAID level 5, It states that the RAID level 5 is the super class of RAID level 3, which is derived by restricting the striping units. There is no restriction on RAID level 5 and its performance/cost which cannot be less than RAID level 3. These observation of performance/cost can only be used to abstract model of disk array. If we consider the implementation of RAID level 3 it is having better performance/cost than RAID level 5 specific implementation.
Figure 10. shows throughput per dollar relative to RAID level 0. These graph show the trade off in group size versus performance/cost for RAID 1, 3, 5, 6.
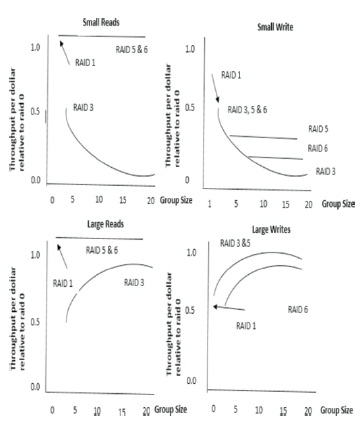
Figure 10. Throughput per Dollar Relative to RAID Level 0. Graphs show the Tradeoff in Group Size Versus Performance/Cost for RAID 1, 3, 5, 6
We have to choose the system according to the parity group or striping unit size. RAID level 3 is enough if small striping unit is showed. Figure 11 is plotted using Table1 for each RAID levels 3, 5 and 6, which is helpful in choosing suitable parity group size.
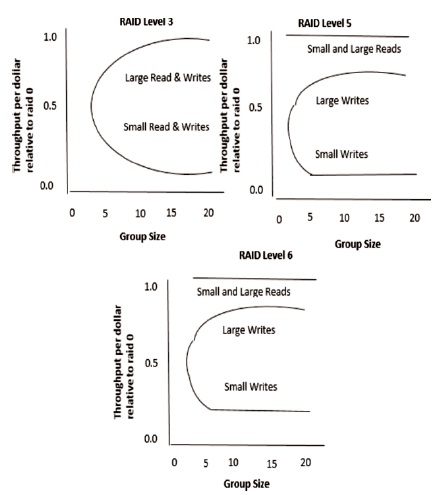
Figure 11. Throughput per Dollar Relative to RAID Level 0. Graph show the Tradeoff in Group Size Versus Performance/Cost for Each Individual RAID
In late 1980's disk arrays are just a research and today disk arrays are a very useful commercial product. RAID is designed for maximum throughput, parallel access on data, higher transfer rate of data by using the concept of stripping and redundancy. Stripping for improved performance and data redundancy for improved reliability or availability of data is proven to be good. Therefore, many computer manufacturers are selling disk arrays and many companies having large data are using RAID concept and its different levels according to their comfort. Many research and implementation on RAID is accomplished and a lot of research is going on in industries and universities as well.
This work would not have been possible without the support of our Professor Muhammad Iqbal who helped us a lot in writing this article, and gave us helpful comments.