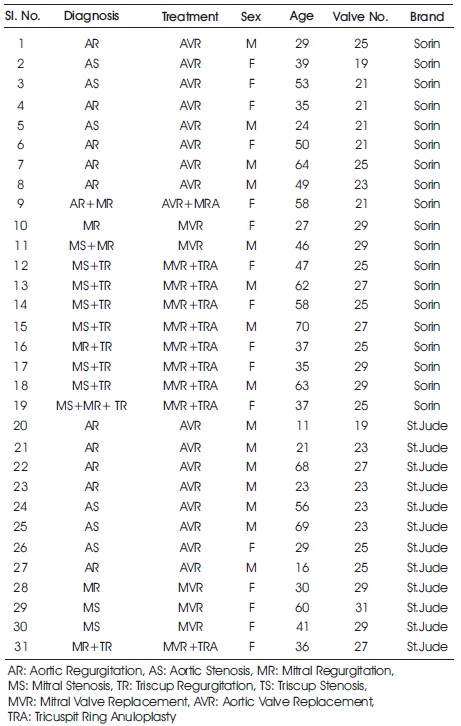
Table 1. Clinical Information from Patients Included in this Study
This study aims to compare the spectral characteristics of bileaflet mechanical heart valve (MHV) sound signals produced by two different companies. For this, heart sound and ECG signals of patients whose aortic or mitral heart valves replaced using commonly used St. Jude and Sorin bileaflet MHV were recorded. Three features relating to frequency of heart sounds and three features relating to energy of heart sounds were obtained from power spectrum of the recorded heart sound signals. Then the features from same recording area and same heart valve were statically compared.
About 50% of the approximately 140,000 valve replacement surgeries performed around the world every year are mechanical heart valve replacements (Famaey et al., 2010). Although mechanical valve replacement has been done for many years, excellent mechanical heart valve has not been manufactured yet and the problems that occur in mechanical heart valves after surgery cannot be prevented (Altunkaya et al., 2010; Rosenberg, 2006). The most serious problems in mechanical heart valves are clotting, tissue degeneration, arthritis, leaks, and prosthetic valve inflammation (González et al., 2005; Kim et al., 1994; Fritzsche et al., 2005). Coagulation in mechanical heart valves is a serious complication that requires reoperation of patients or emergency thrombolytic therapy and may result in death of the patients (Masson & Rieu, 1998; Candy & Meyer, 2001; Roudaut et al., 2007; Kim et al., 1998). Thrombosis can be understood only after the formation of life-threatening thromboembolic complications for the patient (Masson & Rieu, 1998; Kim et al., 1994; Roudaut et al., 2007; Pavlopoulos et al., 2004). Because of the difficulty in making on early diagnosis of thrombosis, and the cost of diagnosis equipment and operators (Kim et al., 1998; Foale et al., 1983; Grigioni et al., 2007), improving non-invasive, cheap and simple methods to evaluate the functionality of prosthesis heart valves is quite important (Masson & Rieu, 1998; Candy & Meyer, 2001; Kim et al., 1998).
Analysis of recorded heart sounds which has been used as the only method for many years in the evaluation of heart valves is still being used as a noninvasive, cheap and easy method. Many studies have been carried out on the evaluation of natural and prosthetic heart sounds by analysis of heart sounds, and significant results have been obtained. Because both the developments in signal processing methods and the analysis of heart sounds are noninvasive inexpensive methods, heart sounds are still being studied up to date despite being a working topic for many years. Although there are many current publications for natural heart valve sounds, the work on mechanical heart valve is limited.
It is necessary to perform new studies related to the mechanical valve sounds when the need for a noninvasive inexpensive method to evaluate mechanical heart valves, the number of inadequate works on the mechanical valve, the loss of meaning of old work due to the development of new covers, and improvements in signal processing methods are taken into consideration.
In this study, heart sound signals and ECG signals of patients who underwent Aortic Valve Replacement (AVR) and Mitral Valve Replacement (MVR) operation with Sorin and St. Jude bileaflet MHV were recorded. The recorded sound signals are separated into first and second heart sounds components (S1 and S2) by means of ECG, and power spectrum are found by autoregressive power spectral density estimate method. Six different features were extracted from the power spectrum density and the features were statistically compared for the MHV, which were structurally the same but produced by different firms.
For this study, heart sounds of 31 patients (17 patients with AVR (9 questions, 8 St. Jude) and 14 patients with MVR (10 Sorin, 4 St. Jude) were recorded 292 times as a result of an average follow-up of 8 months after surgery. Clinical information of the patients is given in Table 1.
Table 1. Clinical Information from Patients Included in this Study
E-Scope II electronic stethoscope manufactured by CardionicsTM was used to record heart sounds and surface electrodes were used to record ECG signals used in the segmentation of heart sounds. BiopacTM 's MP35 data acquisition module was used to convert these two signals into digital and transfer them to the computer. The sampling frequency of the signal is selected as 5000 samples/ second. The BSL PRO 3.7 software (the computer interface of the data acquisition module) was used to view and register the signals.
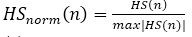
The raw heart sound signals are recorded and then normalized using equation (1) (Liang et al., 1997). HS (n) represents the raw heart sound signals and HSnorm (n) represents the normalized heart sound signals in equation (1).
It is known that the mechanical heart valve sounds that pass through the chest–lung system and reach the stethoscope do not have ver y high frequency components (Baykal et al., 1995; Sava & McDonnel, 1996). Thus, considering the frequency response of the electronic stethoscope, which is used for recording heart sounds and customized to listen to heart sounds, all heart sound signals obtained are filtered with 30 Hz high-pass and 2000 Hz low-pass.
The R-peaks in the ECG signals indicate the onset of a heart cycle, that is, the contraction of the heart. S1 sounds occur shortly after QRS peak of the ECG signal and the S2 sounds occur after T peak of the ECG signal. Therefore, ECG signals can be used as time references to separate heart sound signals into heart cycles.
For this, first, a derivative based QRS detection algorithm is used to find R peaks of ECG signals (Pan & Tompkins, 1985; Köhler et al., 2002; Arzeno et al., 2008). The T-peak of the ECG signal is found in the heart cycle, based on physiological knowledge that it occurs between 60 ms after the R peak and two-thirds of the heart cycle. Based on this information, the point at which the maximum ECG wave is within the specified range is taken as the T-peak (Syed et al., 2007).
After the R and T peaks were found, the envelope of the heart sound signals was used to locate the exact locations of S1 and S2 in the time interval determined by the ECG signal. Shannon energy of the signals was utilized to find the envelope of the heart sound signals (Choi & Jiang, 2008; Liang et al., 1997). After the envelope of the heart sound signals was found, the points at which the envelope is at its maximum are searched to find the center of S1 and S2 within the determined intervals of the heart cycle. Since S1 signals occur immediately after R peak, the point at which the envelope is at the maximum between 1% and 20% of the beginning of the heart cycle is considered the center of the signal S1 (El-Segaier et al., 2005). Since the S2 signals occur after the ECG T wave, the point at which the envelope is at the maximum between the peak of the T wave and the subsequent 150 ms is considered as the center (Syed et al., 2007).
Due to the lack of certain knowledge in the literature for the duration of heart sounds, a period of 150 ms was chosen based on the experimental results. However, it is also seen that the period of 150 ms can be inadequate for some patients. To avoid such situations for those patients, an additional criterion was used for the algorithm which uses the threshold value used by (Choi & Jiang, 2008) for the automatic detection of heart sound components. According to this criterion; If the envelop at the beginning and end of the a period of 150 ms is greater than 40% of the center of envelope, the time taken as 150 ms is increased by 10%. The envelope value was checked again for the new set time and the time was increased until the envelope value dropped below 40%. So S1 and S2 sound components could be selected correctly. Detailed information on the recording and processing of heart sounds can be found in (Altunkaya et al., 2011,).
A parametric method, Burg Auto Regressive (AR), is used to find the frequency components of the signal. Parametric spectrum estimation methods are designed to remove the distortions in the spectrum obtained by conventional methods and are especially effective in detecting the spectra of short data parts. The basic assumption of this method is that a linear model is driven by white noise. The model coefficients of the linear system driven by white noise are adjusted by comparing the signal at the output of the linear system with the desired signal whose spectrum is to be determined. In the case where the desired signal is best matched with the model output, the frequency spectrum of the desired signal is also matched with the frequency characteristic of the model. Since the transfer function of the model is set to produce the desired signal whose spectrum is to be determined, the model's frequency characteristics directly reflects the spectrum of the desired signal (Semmlow, 2004).
After finding the frequency components of the recorded heart sounds, the spectral features defining the heart sounds are extracted from the obtained frequency components. For this, the spectral features used for biological valve sounds by (Durand et al., 1990) are arranged for mechanical valve sounds. These features are
F1: The frequency of the first dominant spectral peak (Hz).
DF1: The bandwidth at 0.707 of the dominant spectral peak (Hz).
Q1: Quality factor of F1 (Q1 = F1/DF1).
AREA : Total area of the spectrum.
A20–100 : Area in the 20–100 Hz band.
A100–200 : Area in the 100–200 Hz band.
Heart sound signals are recorded from both aortic and mitral area. The heart sound signals recorded in each heart cycle have first and second heart sound components (S1 and S2). It is generally accepted that S1 is caused by the closure of the mitral valve and S2 is caused by the closure of the aortic valve (Sava & McDonnell, 1996).
Therefore, the mechanical heart valve sound is more dominant in the S2 component of heart sounds recorded from a patient with AVR and the S1 component of heart sounds recorded from a patient with MVR. Since this study focuses on the comparison of mechanical heart valve sound signals of different mechanical heart valve brands, S1 of patients with MVR and S2 of patients with AVR will be considered. Eight different heart sound signals are obtained when considering mechanical heart valve brand, heart sound signal component and recording area.
These Heart sound signals recorded from patients who have been replaced heart valve with Sorin MHV: S2 sound recorded from the aortic area (Sor_AVRAS2) and the mitral area (Sor_AVRMS2) of the patient with AVR. S1 sound recorded from the aortic area (Sor_MVRAS1) and the mitral area (Sor_MVRMS1) of the patient with MVR.
Heart sound signals recorded from patients who have been replaced heart valve with St. Jude MHV: S2 sound recorded from the aortic area (Jude_AVRAS2) and the mitral area (Jude_AVRMS2) of the patient with AVR. S1 sound recorded from the aortic area (Jude_MVRAS1) and the mitral area (Jude_MVRMS1) of the patient with MVR.
Three features relating to frequency of heart sounds (F1, DF1 and Q1) and three features relating to energy of heart sounds (AREA, A20100 and A100200) are obtained from power spectrum density of S1 and S2. Mean and standard deviations (SD) of the six features obtained from patients with AVR and MVR are given in Table 2 and Table 3, respectively. The features of patients underwent AVR operations with Sorin and St. Jude MHV are in Table 2. The features of patients who underwent MVR operations with Sorin and St. Jude MHV are in Table 3. Also, box plots for these sounds are given in Figures 1 and 2.
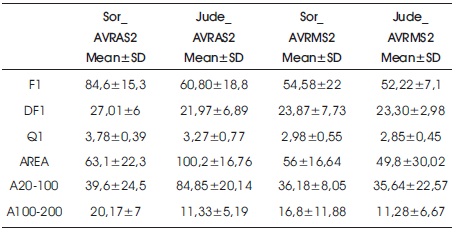
Table 2. Mean and Standard Deviation of Six Features obtained from Patients with AVR
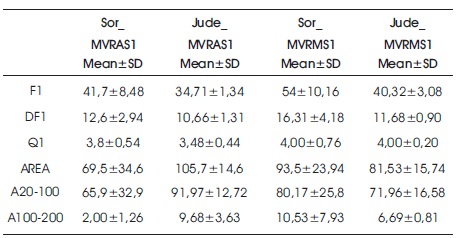
Table 3. Mean and Standard Deviation of Six Features obtained from Patients with MVR
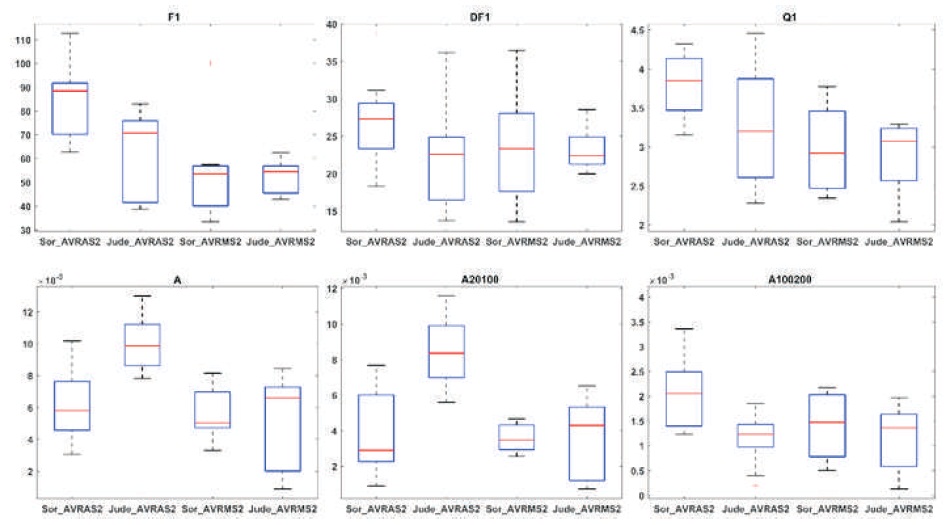
Figure 1. Box and Whisker Plot of Six Features obtained from Patients with AVR
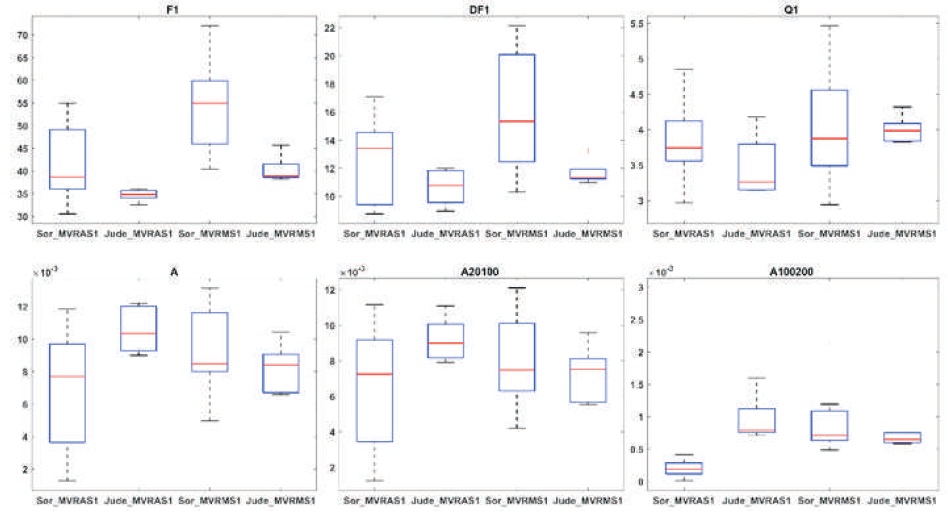
Figure 2. Box and Whisker Plot of Six Features obtained from Patients with MVR
When features extracted from the S2 of patients with AVR recorded from the aortic area (Jude_AVRAS2 and Sor_AVRAS2) were compared, it was found that the AREA and A20100 features obtained from St. Jude MHV were greater than the AREA and A20100 features obtained from Sorin MHV (p<0.01). In other words, it was seen that the energy of sound obtained from St. Jude MHV is higher than sound obtained from Sorin MHV in aortic area records. However, no differences were observed in the features recorded from mitral area.
When features extracted from the S1 of patients with MVR recorded from the aortic area (Jude_MVRAS1 and Sor_MVRAS1) were compared, it was found that the AREA and A100200 features obtained from St. Jude MHV were greater than the AREA and A100200 features obtained from Sorin MHV (p<0.01). As in patients with AVR, it was seen that the energy of sounds obtained from St.Jude MHV is higher than sound obtained from Sorin MHV in aortic area records.
When features extracted from the S1 of patients with MVR recorded from the mitral area (Jude_MVRMS1 vs. Sor_MVRMS1) were compared, and it was found that the F1 and DF1 features obtained from Sorin MHV were greater than the F1 and DF1 features obtained from St. Jude MHV (p<0.01). So frequency components of Sorin MHV sounds are higher than St. Jude MHV when sounds are recorded from mitral area.
It is seen here that the characteristics of the mechanical heart valve sound signals vary according to the brand type. However, these changes depend on the recording area. In other words, there was a difference in the sound energy of records from the aortic area of AVR and MVR patients, but not in the mitral area. Similarly, when comparing the sounds from the mitral area of MVR patients, frequency differences appeared, but no difference was found in the frequency components when comparing the sounds from the aortic area.
It is known that the chest-lung structure has a filter effect on the sound (Sava et al., 1995). The author thinks that the reasons for different outcomes depending on the recording area that the way in which the heart sounds progress in the chest-lung structure changes according to the recording area (Altunkaya et al., 2011). Because of this effect, it is thought that comparing the characteristics of the sounds of the same group of patients with the aorta or mitral area is not the same.
The aim of this study was to compare the sounds of mechanical heart valves produced by different companies, albeit structurally identical. For this, heart sounds of patients with AVR and MVR are recorded and three features relating to the frequency components of heart sounds and three features relating to the energy of heart sounds are obtained from the PSD of heart sounds. After that, these features obtained from heart sounds produced by different companies were compared.
The comparison obviously showed that regardless of where the heart valve was implanted, it is seen that the energy of St. Jude MHVs is higher in aortic area records. In addition, differences in the frequency components were also observed as a result of comparing the sounds recorded from the mitral area of patients with MVR. As a result, it is understood that besides the cover type, the valve brand also affects characteristics of the MHV sounds.
The final goal of the studies on the MHV sounds is to diagnose mechanical heart valve diseases from heart sounds. In order to do this, the formation and properties of mechanical heart valve sounds must be well understood.
In this study, it is shown that MHVs that are structurally the same do not have the same sound properties. Thus, it is obvious that the valve brand must be taken into consideration when working for the diagnosis of mechanical heart valve diseases. However, in this study, only two different brand valves were used. Furthermore, determining the most effective features for determining the valve brand is seen as another issue. The determination of the distinctive features with the highest accuracy will contribute to this area as the first step of automated MHV's disease detection systems. It is aimed to increase the valves brand and to detect best distinctive features for future works.