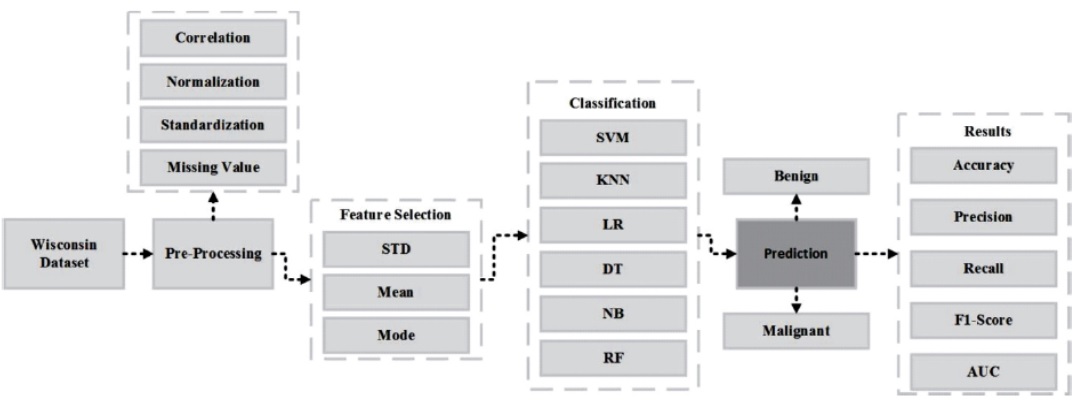
Figure 1. Proposed Methodology
This paper presents a methodology for the early detection and diagnosis of breast cancer using the Wisconsin dataset. The methodology involves four main steps, including data collection, preprocessing, feature selection, and classification. Fine needle aspiration technique is used to extract the ultrasound image features of breast cancer, and preprocessing is performed to eliminate outliers, null values, and noise. Redundant parameters are removed during the feature selection process to improve accuracy. Six machine learning algorithms, including Logistic Regression, Support Vector Machine, K-Nearest Neighbor, Random Forest, Decision Tree, and Gaussian Naive Bayes, are employed for the classification of the breast cancer dataset. Support Vector Machine and K-Nearest Neighbor achieved the highest accuracy, with Logistic Regression, Gaussian Naive Bayes, Random Forest, and Decision Tree having lower accuracy scores. The proposed methodology could aid in the timely detection and diagnosis of breast cancer, and help doctors in selecting the optimal clinical treatment plan for their patients. Further work will be carried out to investigate the effectiveness of additional preprocessing algorithms in improving the classification accuracy of the breast cancer dataset.
Ultrasound is the most common approach for diagnosing breast cancer and statistical analysis of the findings during a mechanical inspection. The pathogenesis of breast cancer is changing because of ultrasound surveillance (Masud et al., 2021). There is a shift towards detecting smaller, less noticeable tumors instead of relying on the presence of larger, more easily observable lesions (Ahmadi et al., 2021). In the last decade, there has been a significant improvement in systems' ability to employ Machine Learning (ML) strategies for dealing with a wide variety of therapeutic scanning challenges. Even while simple Computer-Aided Diagnostic (CAD) techniques have been used in ultrasonography for a long time, their utility and efficacy have traditionally been limited. On the other hand, modern Deep Learning (DL) techniques have been found to spot tumors on routine mammograms just like professional physicians. The prospect of intelligence monitoring systems being able to recognize on their own during a randomized controlled trial has not been realized. At this point in time, the focus is on machine learning algorithms that can aid radiologists rather than serving as independent diagnosticians (Bai et al., 2021). The field of medical imaging, which falls under the broader category of testing, is the largest and most potentially fruitful avenue via which DL could be applied in the field of healthcare (Bluemke et al., 2020; Litjens et al., 2017). In order to have diagnosis as quickly as possible, radiographic tests, regardless of the modality used, require extensive interpretation by a trained physician. As the limitations placed on currently practicing radiologists continue to grow (Wahl et al., 2018; Zhang et al., 2018), there is an increasing demand for diagnostic automation. ML methods have been mentioned in prior literature as being useful for the detection of malignancy in breast cancer images.
On the other hand, machine learning is limited in its ability to interpret vital information in its unprocessed form. The constraint in using machine learning for breast cancer diagnosis is the need for experts who can produce labeled data for classification. However, Deep Learning (DL), a branch of neural networks that is capable of learning many layers of description and conceptualization independently, opens the door to a more thorough examination of breast cancer images. Due to the use of artificial neural networks, image processing has advanced significantly (Sarode et al., 2021). One of the challenges associated with ultrasound is the high rate of occurrence of false positive results. There is a one in five possibility that a woman in Europe between the ages of 50 and 69 who goes through screening every two years will have a false positive result. A more concerning fact is that in the United States, every single woman who has ever been tested has had at least one false-positive result. As a result of the false positive results, women face real consequences, especially in the areas of welfare and medical care. However, the risk of false positives is not the only drawback associated with ultrasound (Mendes & Matela, 2021). Researchers have researched nucleus analysis, and they have identified characteristics of nuclei that can classify cells as either benign or malignant (Lotter et al., 2021).
Nuclei recognition and classification have been achieved through various approaches, including grouping-based methods that use histogram equalization and measurement criteria. However, traditional machine learning techniques, such as filtering, separation, and edge detection, can be complex and limit the effectiveness and efficiency of these methods. Deep Learning (DL), is promising in overcoming these challenges by reducing the number of dimensions and improving image identification and object localization. Common machine learning (ML) methods, such as Support Vector Machine (SVM), K-Nearest Neighbor (KNN), Random Forest (RF), Decision Tree (DT), Naïve Bayes (NB), and Logistic Regression (LR), requires a significant amount of data to train a Convolutional Neural Network (CNN), which is often lacking in the healthcare industry, particularly for breast cancer. In this work, we analyze the use of ML techniques, including SVM, DT, NB, RF, LR, and KNN, on the Wisconsin dataset to diagnose breast cancer. The dataset was successfully classified using these classification strategies (Hassantabar et al., 2020).
Numerous models have been presented in earlier publications that use various feature sets and machine learning techniques to predict Breast Cancer (BC). The primary difficulties in the field of BC prediction research are the lack of large datasets and the disparity between classes that are either positive or negative. The fundamental purpose of the study in Sivapriya et al. (2019) is to determine the algorithm that performs faster and more successfully in predicting BC, and the results demonstrate that Random Forest (RF) surpasses all other algorithms with accuracy. Furthermore, the WBC dataset was used in the studies (Dhanya et al., 2019; Islam et al., 2017; Khourdifi & Bahaj, 2018; Sinha et al., 2020), which compared the accuracy of BC prediction provided by existing ML algorithms. To assess if a person has breast cancer, Yarabarla et al., 2019 employed a RF classifier for classification and prediction. Since the RF algorithm employs both classification and regression methods, it provides the maximum level of identification accuracy. Chaurasia et al., 2018 presented a BC study that can be used to create prognostic models for this disease. In this study, three different models were used to predict survival rates for benign and malignant Bcs. Fatima et al. (2020) summarized all the work done on ML algorithms for diagnosing breast cancer. They hypothesized that using data augmentation techniques would be an effective way to overcome the issue of a meagre dataset.
Toprak (2018) proposed data augmentation techniques to address the issue of limited datasets in the automated detection and identification of cell shapes in mammography images. Jacob et al. (2018) did a survey comparing classification and clustering algorithms was conducted, with findings indicating that classification algorithms are more accurate predictors. Kashyap et al. (2015) discusses an automatic method for detecting anomalies in mammograms using fuzzy-C-means and adaptive threshold strategy to segment the suspect Region-Of-Interest (ROI). After testing the Mini-MIAS dataset, it was found that subtracting preprocessed enhanced images from preprocessed enhanced inverted images can improve questionable region detection. Johra and Shuvo (2016) presented a fuzzy inference system approach to distinguish between malignant and benign states, which outperforms ANN and SVM classification in terms of sensitivity, accuracy, and specificity. Singh and Choudhary (2019) provides a summary of research results and discusses relevant deep learning concepts for analyzing breast mammograms.
The fundamental goal of our research is to clearly define an efficient and predictive model for breast cancer diagnosis. Using the Wisconsin breast cancer dataset, we deployed multiple machine learning models (SVM, KNN, DT, LR, NB, RF) and evaluated the performance to find which model is more accurate. Our proposed methodology comprises mainly of four steps as shown in Figure 1. It includes Data collection, preprocessing, and feature selection and classification. Machine learning models are trained on processed data to create a new set of criteria. The proposed model was trained with 70% of the data and tested with 30% of the data. We compared the performance of the various proposed models after conducting the experiment.
Figure 1. Proposed Methodology
Wisconsin breast cancer data from the Wisconsin online repository is used in the proposed work. The dataset features are retrieved from a digital image of a Fine- Needle Aspiration (FNA) breast cancer result. All of the attributes are utilized to identify the cellular organelles within the image. The dataset contains 569 cases divided into two categories (62.74% benign and 37.26% malignant) as shown in Figure 2.
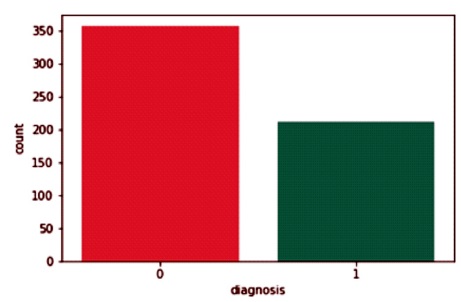
Figure 2. Sample of Wisconsin Dataset
In the pre-processing step, a CSV (Comma-Separated Values) file that provides the dataset's basic information for reading images was created. The CSV file has text- based labels, which was transformed into numeric values of 0 and 1. Figure 3 refers to the eliminated missing value features. Additionally, noise was removed from the data during the pre-processing step. After reducing the data noise, the dataset was partitioned into training (70%) and testing (30%) portions and was fed to the machine learning models.
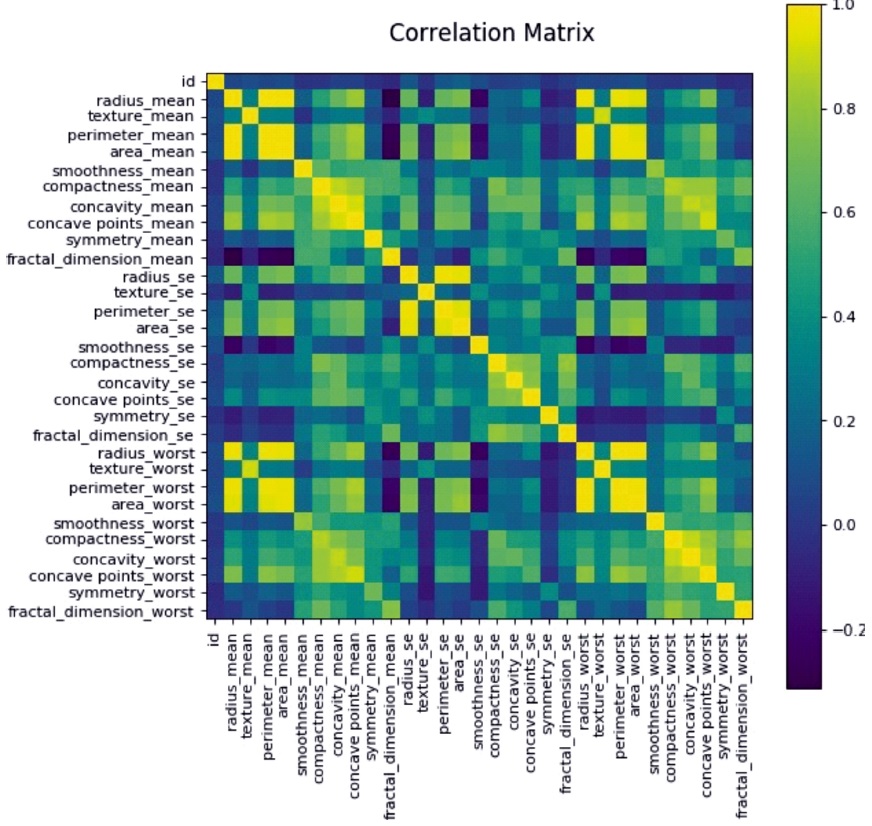
Figure 3. Pre- processing with Correlation Matrix
Various statistical terms (e.g., Mean, Mode, Standard Deviation) are used in the selection of framework features to standardize the framework and eliminate unnecessary parameters as shown in Figure 4. This method restricted many parameters in order to increase classification precision.
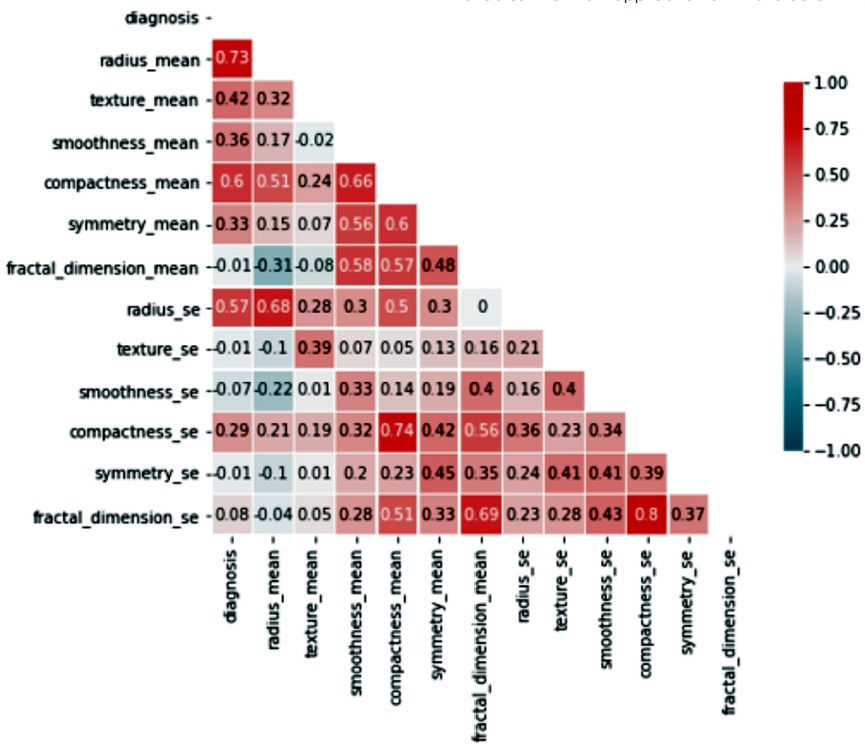
Figure 4. Selected Feature with Correlation Matrix using Heatmap
The suggested research achieved the prediction evaluation of ML models, and our classification employs the following machine learning classifier. The Support Vector Machine (SVM) is a supervised learning model that splits datasets into categories in order to determine the Maximum Marginal Hyper - Plane (MMH) using the closest data points. Random Forests (RF) are an outfit approach to classification, regression, as well as other tasks which work by training a large number of decisions trees and then outputting the category that corresponds to the mode of the classifications or regression of the individual trees. The K-Nearest Neighbors (KNN) classifier, also referred as k-NN, is a supervised learning model that is non-parametric. It takes a large number of labelled points and utilizes them to know and understand how to label new points. To categorize new points, it takes a look at the categorized points closest to it, which become its nearest neighbors, and polls them. Logistic Regression (LR) is a generalization of the regression model and a highly powerful analytics model. It is a statistical method used to determine the probability of an illness or health problem as a predictive marker. Both simple and multiple regression models can be used to investigate the relationship between predictor variables and response variables. The main application of LR is to determine the coefficients of determination for binary and multiclass data. Decision Tree (DT) is a predictive analysis model that can be employed in a variety of scenarios. It can be developed using an automated approach that splits the data in various ways according to various conditions. Naive Bayes (NB) is a type of classification model that employs the Bayes Rule. It evaluates membership probability values for every class, including the likelihood that a provided record or piece of information corresponds to a particular class. It assumes that the most probable category is the one with the maximum probability.
Machine Learning Algorithms were used on a dataset of diagnostic tests for breast cancer performed in Wisconsin. Performance indicators such as the Confusion Matrix, Accuracy, Precision, Recall, F1 Score, and Area Under the Curve (AUC) were utilized to compare and contrast the models and determine the optimal algorithm for predicting breast cancer. The effectiveness of a solution for binary classification where the output may have two or more possible classes can be evaluated using a Confusion Matrix. Confusion matrices are tables with four columns: True Positives (TP), True Negatives (TN), False Positives (FP), and False Negatives (FN).
The most common measure of a classification algorithm's effectiveness is its accuracy, which is the proportion of correct predictions relative to the total number of predictions. The number of highly processed results returned by the ML model is referred to as precision, while the number of positive documents returned by the ML model is referred to as sensitivity. Mathematically, the F1 score is the weighted average of precision and sensitivity, giving the harmonic mean of precision and sensitivity. The percentage of accurate diagnosis for WBCD datasets is listed in Table 1 and shown in Figure 5 below. Based on the findings of the training set and the testing set, it was observed that the accuracy of each of the classifier varies, where SVM and KNN consistently achieve greater accuracy in the testing set (96%) than any of the other classifiers.
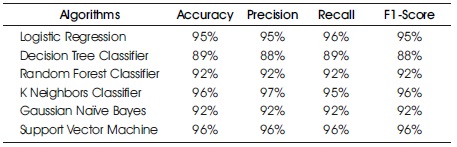
Table 1. Achieved Matrix using Proposed Classifiers
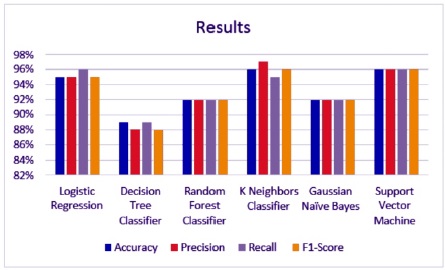
Figure 5. Graphical Representation of Achieved Result
Table 2 and Figure 6 present the Confusion Matrix for the LR classifier, which correctly predicts 164 out of 171 instances. Specifically, 110 instances of benign cases were correctly predicted as benign, and 54 instances of malignant cases were correctly predicted as malignant. However, there were two instances of incorrect prediction, with five instances of the benign class being predicted as malignant. The LR algorithm achieved a Macro Average performance of 96% accuracy, 95% precision, 96% recall, and a 95% F1-Score.
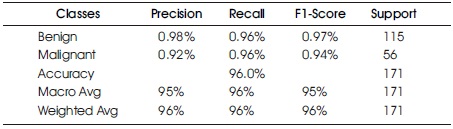
Table 2. Confusion Matrix of Logistic Regression with Support of Benign and Malignant
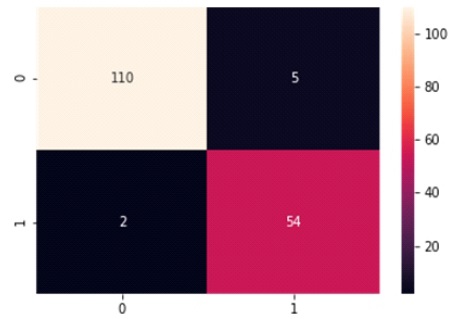
Figure 6. Graphical Representation of Logistic Regression Algorithm
In Table 3 and Figure 7, the Confusion Matrix shows that the DT classifier predicted 156 out of 171 instances, with 108 instances of benign cases correctly predicted as benign, and 48 instances of malignant cases correctly predicted as malignant. However, there were eight instances of incorrect prediction, with seven instances of the benign class being predicted as malignant. The DT algorithm achieved a Macro Average performance of 90% accuracy, 90% precision, 90% recall, and a 90% F1- Score.
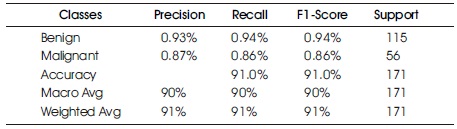
Table 3. Confusion Matrix of Decision Tree with Support of Benign and Malignant
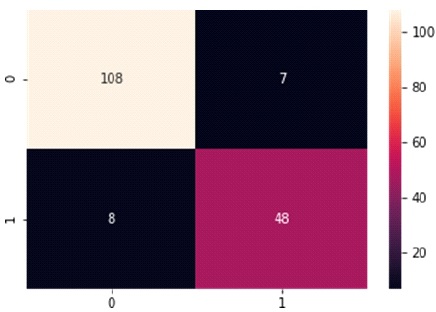
Figure 7. Graphical Representation of Decision Tree Algorithm
Table 4 and Figure 8 display the Confusion Matrix for the RF classifier, which correctly predicts 158 out of 171 instances. Specifically, 109 instances of benign cases were correctly predicted as benign, and 49 instances of malignant cases were correctly predicted as malignant.
However, there were seven instances of incorrect prediction, with six instances of the benign class being predicted as malignant. The RF algorithm achieved a Macro Average performance of 91% accuracy, 89% precision, 89% recall, and an 89% F1-Score.
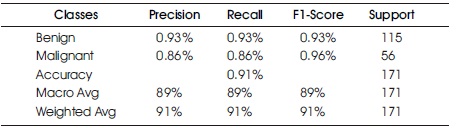
Table 4. Confusion Matrix of Random Forest with Support of Benign and Malignant
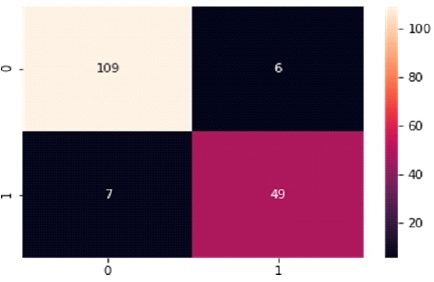
Figure 8. Graphical Representation of Random Forest Algorithm
The Confusion Matrix for the KNN classifier is shown in Table 5 and Figure 9. The classifier correctly predicts 165 out of 171 instances, with 114 instances of benign cases correctly predicted as benign, and 51 instances of malignant cases correctly predicted as malignant. However, there were five instances of incorrect prediction, with one instance of the benign class being predicted as malignant. The KNN algorithm achieved a Macro Average performance of 96% accuracy, 97% precision, 95% recall, and a 96% F1-Score.
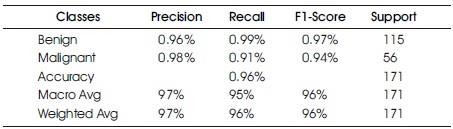
Table 5. Confusion Matrix of K Nearest Neighbor with Support of Benign and Malignant
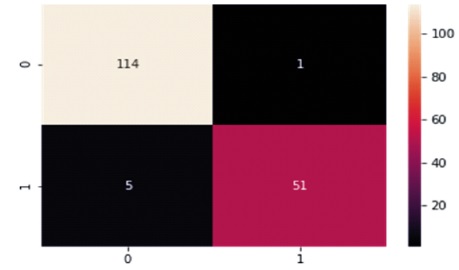
Figure 9. Graphical Representation of K Nearest Neighbor Algorithm
Table 6 and Figure 10 present the Confusion Matrix for the GNB classifier. The classifier predicted 159 out of 171 instances, with 110 instances of benign cases correctly predicted as benign, and 49 instances of malignant cases correctly predicted as malignant. However, there were seven instances of incorrect prediction, with five instances of the benign class being predicted as malignant. The GNB algorithm achieved a Macro Average performance of 93% accuracy, 92% precision, 92% recall, and a 92% F1-Score.
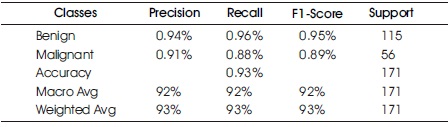
Table 6. Confusion Matrix of Gaussian Naïve Bayes with Support of Benign and Malignant
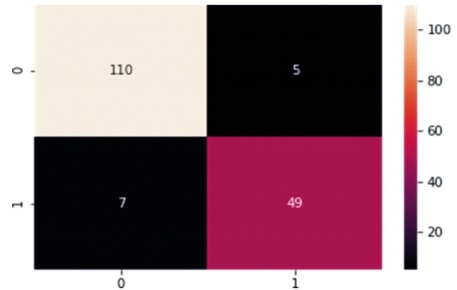
Figure 10. Graphical Representation of Gaussian Naïve Bayes Algorithm
The Confusion Matrix for the GNB classifier is presented in Table 7 and Figure 11. The classifier predicted 165 out of 171 instances, with 112 instances of benign cases correctly predicted as benign, and 53 instances of malignant cases correctly predicted as malignant. However, there were three instances of incorrect prediction, with three instances of the benign class being predicted as malignant. The GNB algorithm achieved a Macro Average performance of 96% accuracy, 96% precision, 96% recall, and a 96% F1-Score.
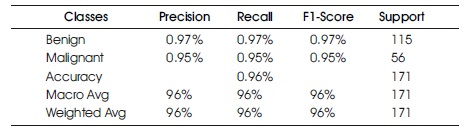
Table 7. Confusion Matrix of Support Vector Machine with Support of Benign and Malignant
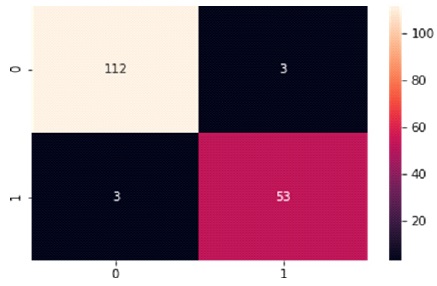
Figure 11. Graphical Representation of Support Vector Machine Algorithm
In terms of accuracy (96%), precision (96%), sensitivity (96%), and F1-Measure (96%), Support Vector Machine (SVM) outperforms the other classification methods. This is consistent across both classes (malignant and benign) on the BCWD Dataset. Figure 12 compares the ROC curves of each machine learning method, which is a useful indicator of their performance. The AUC score, which measures the area under the ROC curve, indicates that SVM and LR have the highest score at 0.96%, while DT has the lowest score at 89%. This suggests that the SVM classifier operates with greater efficiency, as it has a larger surface area under the ROC curve. Overall, SVM proves to be the most effective classifier among the competing methods.
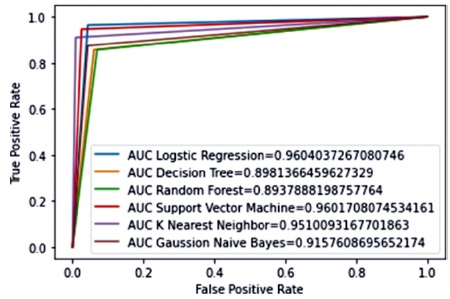
Figure 12. AUC Result for All Classifiers
Machine Learning algorithms were used on a dataset of diagnostic tests for breast cancer to determine the optimal algorithm for predicting breast cancer using performance indicators such as the Confusion Matrix, Accuracy, Precision, Recall, F1 Score, and Area Under the Curve (AUC). Confusion matrices are tables with four columns: True Positives (TP), True Negatives (TN), False Positives (FP), and False Negatives (FN). The most common measure of a classification algorithm's effectiveness is its accuracy, which is the proportion of correct predictions relative to the total number of predictions. SVM and KNN consistently achieved greater accuracy in the testing set (96%) than any of the other classifiers. In this work, machine learning algorithms were applied to a dataset of diagnostic tests for breast cancer in Wisconsin, and performance metrics such as the Confusion Matrix, Accuracy, Precision, Recall, F1 Score, and Area Under the Curve (AUC) were used to compare and evaluate the various models. The most effective model for predicting breast cancer was determined to be SVM and KNN, which consistently achieved greater accuracy in the testing set than any of the other classifiers, with 96% and 96% accuracy, respectively. The proposed work found that SVM and KNN outperformed all other methods in terms of accuracy, precision, recall, f1 score, and AUC, making them reliable predictors and diagnostic tools for breast cancer. However, it is important to note that the results are exclusive to the WBC dataset, and future research will apply the same machine learning algorithms with the addition of new algorithms in preprocessing.