[1]

Clustering analysis is used to partition data set based on objects within a group and the clustering results are influenced by choice of distance measure and the clustering algorithm. Clustering analysis has been applied to group of author's hindex and g-index with similar or dissimilar features. Validity measure is calculated to determine which is the best clustering by finding the minimum value for our measure. In this paper, the authors have presented the effective validations possible with Davies-Bouldin index, Silhouette index and quantization error.
The main rationale behind clustering analysis is to structure and partition data set based on inherent information pertained within the data [1]. The result of such clustering process is grouping of objects in a data set, where the objects within a group have a high degree of similarity and a low degree of similarity with objects in other groups [2].
An important field within literature is citations of articles published in various Journals. An author could receive citation to his paper once it contains information persistent to the query of interest. As a rule of thumb, the more citations a particular paper receives, the greater benefit is expected to the publisher interms of validity and scientific quality content of the Journal. This can be perceived with the fact that the topic chosen by authors, to publish in one Journal specifies the importance of audience to the Journal. Therefore to assess the implicit applicability of citations received for a paper, h-index and g-index were proposed. In this context, clustering analysis can be applied to group of authors with similar or dissimilar features such that the group of authors with one specific index may be divided into subgroups. These subgroups indicate diversity in the indices and hold information on a potential set of characters covered by both indices [3] .
It is known that the clustering results are influenced by two factors namely, the choice of distance measure and the clustering algorithm [4]. The choice of algorithm depends on the data available and the purpose of clustering. Some algorithms result in clusters of similar size while others make clusters of dissimilar size; some algorithms generate spherical clusters while other algorithms form elongated clusters and few clustering algorithms are sensitive to outliers and so on. However, the output is dependent on how the input data is pre-processed and represented. Almost all algorithms require input parameters from the user, for example, the desired number of clusters or threshold values for deciding if an object belongs to or does not belong to a cluster. Another characteristic of most clustering algorithms is that they always impose a clustering structure to a data set, even if there is no meaningful way to cluster the data [5].
The clustering tasks designed and implemented in this paper are based on the h- index and g-index values data set of authors who have published papers of scientific excellence in Journals of repute. While mining and during information retrieval [6], the question of quality data with scientific up-to-date information and Journal source is crucial. The retrieved information from a publisher source should be error free and contain a minimum number of citations to the specific paper. Hence the data equivalence [7] with respect to information and corresponding authors along with number of citations are deemed to be important and hence the contextual clustering analysis is presented here with validity metrics [8] on the modified k-means algorithm reported elsewhere by our group [1]. Several validation measures have been reported since many years, with new methods proposed every year. However, some of the earliest algorithms have been shown to be the most effective [9] . Validity measure is calculated to determine which is the best clustering by finding the minimum value for our measure. In this paper, the authors have presented the effective validations possible with Davies-Bouldin index, Silhouette index and quantization error.
A characteristic feature of clustering algorithms, in general, is that they impose a clustering structure to a data set, even if there is no meaningful way to cluster the data. Hence, this nature of algorithms emphasizes the importance of clustering validation. To perform the task, few automated methods such as the density of clusters, the distance between clusters and the accordance between the proximity matrix and the clustering have been reported in literature. In this paper, the authors have reported three validation parameters to measure clustering quality. They are Davies-Bouldin index, Silhouette index and quantization error. These three validation measures are based on different components of the clustering structure and therefore constitute an adequate basis for evaluating the clusters [10, 15].
The data set includes 200 h- index and g-index values of authors who have published scientific papers in various Journals.
Davies-Bouldin [11] criteria is based on within-cluster distances divided by between-cluster distance. Davies- Bouldin index compares each cluster to every other cluster based on a function measuring similarity in which, for each pair of clusters, the sum of the average distances of each point in the two clusters to its respective centres (measuring compactness) is divided by the distance between the two cluster centres (measuring separation). The maximum values of this function for each cluster are averaged, resulting in a score:
Where, Ri = max Rij , i ≠ j
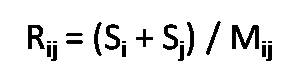
Where,
Si is the sum of the average distances from each point in cluster to the centroid of its cluster,
Mij is the distance between centroids of clusters i and j.
A lower score represents less dispersion within clusters and more distance between clusters.
Silhouette is based on the mean score for every point in the data set. Each point's individual score is based on the difference between the average distance between that point and every other point in its cluster and the minimum average distance between that point and the other points in each other cluster. This difference is then divided by a normalizing term, which is greater of the two averages [12].
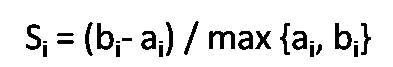
Silhouette measure relates separation to compactness by subtraction rather than division. As clustering improves, the score will approach 1.
This method calculates the quantization error of the given clustering. In vector quantization the goal is to minimize the average (squared) quantization error [13], the distance between a sample and its representation. Lower quantization errors represent a good data cluster. The quantization error is given by:
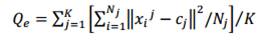
Where,
K is the number of clusters
Cj is the centroid of cluster j
Nj is the number of particles in cluster j
Xij –Cj is the distance between particles and centroid
The first step in k-means algorithm is to divide the given data set into user defined number of clusters. The initial choice of k in k-means is an interpretive decision and successive runs should be performed to obtain an optimized division of data for any chosen k value. A prior knowledge on the data structure would result in more appropriate clusters. However, as the dimensionality of the data increases, it becomes increasingly difficult to determine a proper value fork. Hence, considerable attention has been given to the subject of cluster validation, a process which attempts to evaluate a particular division of data into clusters [14,15].
Inorder to compare validity metrics for modified k-means clustering, the authors have used h- index and g-index data set. The size and attributes of the data set are varied from one another [16]. The number of clusters ranged from 3 to 8. The data was clustered using the modified k means algorithm.
For our data set, k-means was run successively to create optimal clustering of the data for k values between 3 and 8. These optimal clustering were tested by the three validity measures, resulting in a set of values for each validity measure, one each for k = 2 through 8. These scores were then compared against each other to find the best k value for the clustering according to the validity measure. The results are given in Table 1.
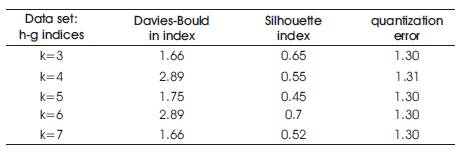
Table 1. Shows the Clustering Validation Index Values for the h- index and g- index Data Sets
From the results it is observed that the modified k-means algorithm is able to generate clusters based on user input and the validation metrics reported here suggest that the scores of each metric with respect to k values are significant [2]. The Davies-Bouldin index resulted in a reasonable number of clusters and k=3 represents best cluster.
Validity metrics incorporated to modified k-means algorithm have been determined with few computational efforts, as the proposed method works well with different data sets producing a value for each metric with expected number of clusters. The Davies-Bouldin index and Silhouette index detected the correct number of clusters for all the k values in the data set. Further, work is in progress to study the effect of dimensionality on cluster validation metrics.