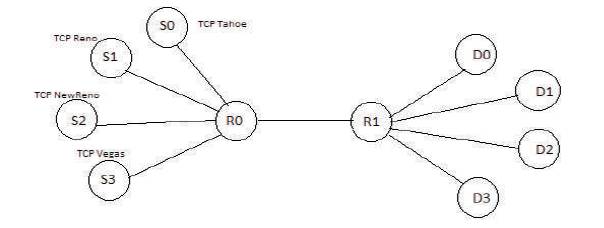
Figure 1. Simulation Network Topology
Transmission Control Protocol (TCP) is the transport layer protocol which is reliable and connection oriented. The beauty of TCP is its congestion control feature. TCP delights the packet losses as an indication of the congestion. TCP is widely used on the internet. There are various congestion control mechanisms that are available based on four basic approaches, such as slow-start, congestion avoidance, fast retransmit and fast recovery. Several TCP variants are used to control and avoid the congestion; these are TCP Tahoe, TCP Reno, TCP Vegas, and TCP New Reno. In this paper, the authors have evaluated the performance of various TCP congestion control algorithms with different Constant Bit Rate (CBR) traffic from the following aspects, based on the number of packets sent, number of packets lost and number of packets dropped. To calculate Packet Delivery Ratio (PDR), average end- end delay and average packet loss are calculated. In order to evaluate the performance of various TCP variants, the authors have used NS-2 simulator and the graphs have been generated using Xgraph.
Congestion Control deals with controlling the traffic entry into a telecommunication network, to avoid congestion collapse by avoiding over subscription of any of the processing or link capabilities of the intermediary nodes and networks and taking the resource reducing steps, such as minimizing the rate of sending packets. There are four basic mechanisms in congestion control those are slow-start, congestion avoidance, fast retransmit, and Fast Recover y [1],[2]. A transport layer protocol like Transmission Control Protocol (TCP) is needed in the network, to establish a reliable end-to-end connection over the unreliable Internet Protocol (IP). Now-a-days, most of the internet traffic is carried out as well as the majority of widely used applications are provided by TCP [3]. Early TCP implementations had very bad retransmission behavior. When the packet loss occurs, the end points send extra packets that repeat the information lost, and double the data rate sent, precisely the opposite of what is happening during congestion. The required protocols which have congestion control mechanisms similar to TCP such as TCP Tahoe, TCP Reno, TCP Vegas and TCP New Reno are used to minimize and avoid congestion. These versions of TCP use network congestion avoidance algorithm that include various aspects of an Additive Increase Multiplicative Decrease (AIMD) scheme, with other schemes such as Slow-Start to achieving Congestion Avoidance [4],[5].
The main objective of this paper is, to evaluate different TCP congestion control algorithms like TCP Tahoe, TCP Reno, TCP Vegas and TCP New Reno at different transmission rates and compare them in various aspects such as packet delivery ratio, average End to End delay and average packet loss.
A brief look at each of the TCP Variants and noting how they differ from each other have been presented. In the end, simulation results are also provided for more understanding.
TCP Tahoe refers to one of the TCP congestion control algorithms [6]. The TCP Tahoe protocol implementation added the number of new algorithms and modifications to earlier implementations. The new algorithms include Additive Increase Multiplicative Decrease (AIMD) approach and fast retransmit. The improvement includes the modification to the Round Trip Time (RTT) estimator used to set re-transmission timeout values. The fast retransmit algorithm is of special interest because it is improved in subsequent versions of TCP. In the Fast Retransmit algorithm, after receiving three duplicate ACK's for the same TCP segment, the data sender concludes that the packet has been lost and retransmits the packet without waiting for a re-transmission timer to expire, leading to higher channel utilization and connection throughput [7].
This TCP Reno preserves, the basic principle of TCP Tahoe, such as slow-start and the coarse grain retransmit timer. The TCP Reno implementation retained the enhancements incorporated into TCP Tahoe, but modified the Fast Retransmit phase to include fast recovery phase. The new algorithm prevents the communication path (“pipe”) from going empty after Fast Retransmit, thus avoiding the need to slow-start to refill it, after a single packet loss. Fast Recovery operates by assuming that each duplicate ACK received represents a single packet having left the pipe [8]. Thus, during Fast Recovery the TCP sender is able to make intelligent estimates of the amount of outstanding data. A TCP sender enters fast recovery phase after receiving an initial threshold (TCPREXMTTHRESH) of duplicate ACK’s. Once the threshold (generally is three) of duplicate ACK’s was received, the sender retransmitting one packet and reduces the congestion window by one half [9]. After entering Fast Recovery and retransmit a single packet, the sender effectively waits until half of a window of two duplicate ACKs have been received, and then sends a new packet for each additional duplicate ACK that is received. Upon receipt of an ACK for new data, the sender exits Fast Recovery. Reno significantly improves upon the behavior of TCP Tahoe when a single packet was dropped from a window of data, but can be suffer from performances problem, when multiple packets were dropped from a window of data [10],[11].
TCP Vegas uses Round Trip Time to measure the network situation. It is used to check increase or decrease in the congestion window value by using expected and actual efficiency [12], [13]. The idea is that when the network is not congested, the actual flow rate will be close to the expected flow rate. Otherwise, the actual flow rate will be smaller than the expected flow rate. Using the difference in flow rates, the congestion level in the network is estimated.
Diff = (Expected Rate – Actual Rate) Base RTT
Expected Rate = CWND/Base RTT
Actual Raate = CWND/Actual RTT
TCP Vegas tries to keep at least α packet, but no more than β packets in the queues [13]. Based on the difference, the sender updates its window size as, when difference < α, Vegas increase the CWND linearly during next RTT, and when difference > β, Vegas decrease the CWND linearly during the next RTT. Vegas leaves the CWND unchanged when α < difference < β.
TCP New Reno improves retransmission during the fast recovery phase of the TCP Reno. It includes a small change to the TCP Reno algorithm at the sender. The change concerns the sender's behaviour during the fast recovery when the partial ACK is received. The partial ACK do not acknowledges all the packets that are outstanding at the start of the fast recovery phase but acknowledges only some of them. This means there exist multiple packet losses in the similar window of data.
In TCP Reno, partial ACK's take TCP out of fast recovery by making the usable window size same as that of congestion window size. But in TCP New Reno partial ACK's do not take TCP beyond Fast Recovery [14]. Instead, partial ACK's received during the Fast Recovery are preserved as an indication that the packet immediately followed the acknowledged packet in the sequence space that has been lost and would be re-transmitted.
Thus, whenever multiple number of packets are lost from a single window of data, TCP New Reno can recover without the re-transmission time out, retransmitting one lost packet per RTT until, all lost packets from window have been transmitted [15]. TCP New Reno remains in Fast Recovery until all the data outstanding is acknowledged.
The ratio of total number of packets successfully received by the destination nodes to the number of packets sent by the source nodes.
The average delay of all the packets while travelling from source node to destination node.
The ratio of number of lost packets to the sum of number of packets received and number of lost packets.
The network simulator NS-2, version 2.35 is used for simulation. This version supports various TCP congestion control mechanisms like TCP Tahoe, TCP Reno, TCP Vegas, TCP New Reno and also various traffic sources such as FTP and CBR applications. Here the authors measured the performance of various TCP variants using the graphs generated by Xgraph tool.
In Figure 1, 12 nodes are represented for simulation of TCP Tahoe, TCP Reno, TCP Vegas and TCP New Reno in wired network. The topology used in this paper is dumbbell topology and S0 to S3 are represented as source nodes, D0 to D3 are represented as destination nodes, R0 and R1 are the routers. In regular intervals at R0, by changing CBR values the performance will be measured.
Figure 1. Simulation Network Topology
In this, the authors compared the performance of TCP Tahoe, TCP Reno, TCP Vegas, TCP New Reno through Packet Delivery Ratio (PDR), average End-to-End delay and average packet loss.
Table 1 shows the performance of various TCP variants by changing the CBR traffic. Simulation runs using the CBR flows varying from 1 to 12. When packets are transmitted between the sender and the receiver, the number of packets sent, number of packets received and number of packets dropped are identified. Based on these values, the performance of various TCP Variants will be measured. From Figure 2, the authors observed that TCP Vegas has the highest performance even in case of congestion compared to that of the other versions because, Vegas measures the network situation effectively. Tahoe, Reno and NewReno have the same throughput until congestion occurs. When congestion occurs at 8 Mbps transmission rate Vegas has better performance compared to Tahoe, Reno and New Reno. Reno has the next highest performance with least values compared to Tahoe and New Reno.
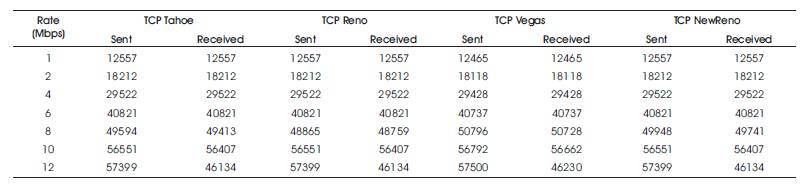
Table 1. Performance of TCP Tahoe, TCP Reno, TCP Vegas and TCP New Reno
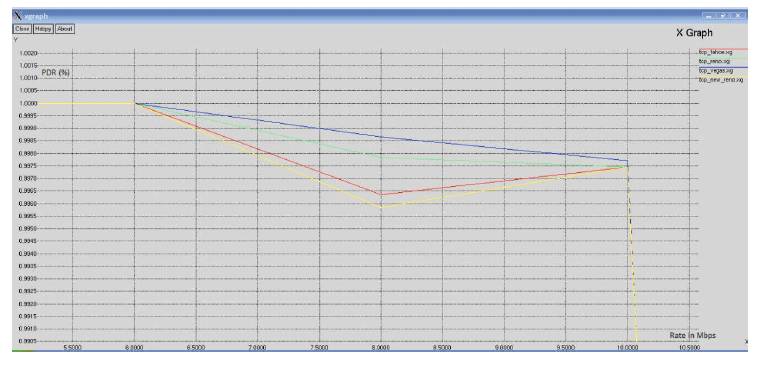
Figure 2. Packet Delivery Ratio of TCP Variants
From Figure 3, the authors observe that Reno has the lowest average delay values compared to that of the other versions-Tahoe, New Reno and Vegas. Since Reno enters fast-recovery before retransmit time out expires, Reno has lowest delay compared to other versions. In the remaining versions, Vegas has the highest performance with least values compared to New Reno and Tahoe. New Reno and Tahoe have the least performance having highest end-to-end delay values among the four versions. From Figure 4, the authors observed that the packet loss ratio is least for Vegas compared to that of the other versions Tahoe, Reno and New Reno. Tahoe has the next highest performance with least values compared to Reno and New Reno. Reno and New Reno have the lowest performance in terms of packet loss rate among the four versions.
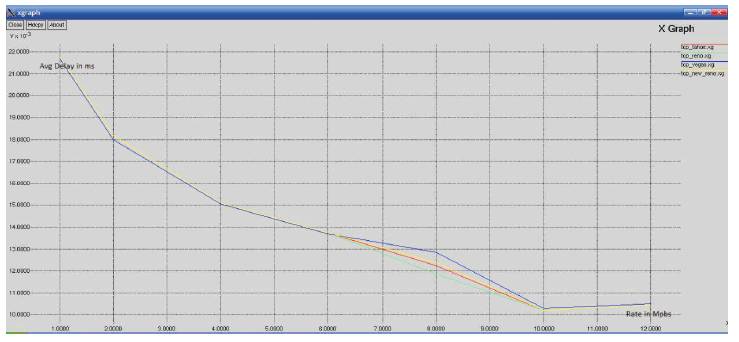
Figure 3. End-to-End Delay of TCP Variants
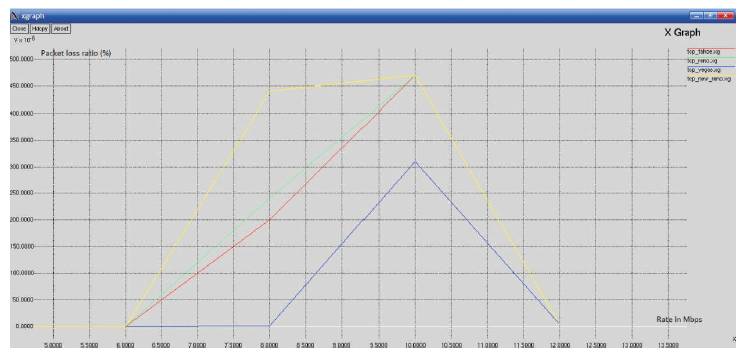
Figure 4. Packet Loss Ratio of TCP variants
By observing the simulation results and graphs TCP Vegas has the highest packet delivery ratio compared to other versions Tahoe, Reno and New Reno. It has the highest packet delivery ratio even in case of congestion. Hence, the authors concluded that Vegas have the best performance in terms of packet delivery ratio. In case of average end-to-end delay TCP Reno has the lowest value compared to other versions Tahoe, Vegas and New Reno. Hence, the authors concluded that Reno has the best performance in terms of average end to end delay. In case of average packet loss ratio Vegas has the least packet loss. From the results concluded that Vegas have the best performance in terms of packet loss rate.